IOtech eZ-Analyst User manual

USER’S MANUAL
eZ-Analyst version 5.1.x
IOtech
25971 Cannon Road
Cleveland, OH 44146-1833
(440) 439-4091
Fax: (440) 439-4093
sales@iotech.com
productsupport@iotech.com
www.iotech.com
Real-Time Vibration and
Acoustic Analysis Software
*372165D-01*
372165D-01 1086-0922 rev 15.1

eZ-Analyst 938091 iii
Manual Layout
This document is a reference manual for eZ-Analyst, its Menu options, associated Toolbar
buttons, and resulting GUI screen images. When deemed beneficial, examples were placed to
supplement the primary material. The document discusses eZ-Analyst in relation to
ZonicBook/618E, WaveBooks, and IOtech 640, 650, and 652 dynamic signal analyzers.
Differences in functionality are pointed out when of importance to the user.
Ch 1 –Software Installation
WaveBooks
ZonicBook/618E
IOtech 640, 650, and 652
Ch 2 –An Introduction to eZ-Analyst Discusses eZ-Analyst’s measurement and
playback modes.
Ch 3 –Menus discusses the following menus: Task, File, Control, Export, and Window.
The Edit Menu is discussed in chapter 4.
Ch 4 –Edit Menu discusses the following windows: Configuration, Playback Setup, Display
Preferences, and Output Channel Setup. Note that the 640e and 640u analyzers of a
relatively extensive section pertaining to output waveforms.
Ch 5 –Toolbar Buttons identifies and shows the location of the toolbar buttons and
provides a brief synopsis of their purpose.
Ch 6 –Interactive Features of the Plot Display Window explains how to change plot
display characteristics, including display functions, by using the window’s interactive
features. The chapter includes a section on cursor types and annotation options.
Ch 7 –Waterfalls, Order Tracking, & Slice Views discusses these display options
available to eZ-Analyst users.
Appendix A –Keyboard Controls for eZ-Analyst identifies keys for controlling plot
display, menus, windows, and record/playback functions.
Glossary
Check the README.TXT file, if present, for information that may not
have been available at the time this manual went to press.

eZ-Analyst 938091 v
Table of Contents
Manual Layout …… iii
Ch 1 –Software Installation
WaveBooks …… 1-1
ZonicBook/618E …… 1-3
IOtech 640, 650, and 652 …… 1-5
Ch 2 –An Introduction to eZ-Analyst
Features …… 2-2
Measurement Mode …… 2-5
Playback Mode …… 2-5
A Word about Configuration …… 2-5
Ch 3 –Menus
Task Menu …… 3-2
File Menu …… 3-10
Control Menu …… 3-10
Export Menu …… 3-11
Window Menu …… 3-13
Edit Menu …… see chapter 4
Waterfalls, Order Tracking, & Slice Views …… see chapter 7
Ch 4 –Edit Menu
Configuration Window …… 4-1
Analyzer Tab …… 4-3
Input Channels Tab …… 4-15
Analog Input Channels …..4-16
Tach Channels ….. 4-20
FFT Setup Tab …… 4-25
Recording Setup Tab …… 4-33
Block Rejection Tab …… 4-37
Octave Setup Tab…… 4-39
Preferences Tab …… 4-41
Output Channel Setup …… 4-45
ZonicBook/618E and WaveBook Waveform Output …… 4-45
640u and 640e Waveform Output …… 4-47
Playback Setup Window …… 4-57
Display Preferences Window …… 4-58
Ch 5 –Toolbar Buttons
Continued . . .

vi 938091 eZ-Analyst
Ch 6 –Interactive Features of the Plot Display Window
Introduction …… 6-1
Adding and Removing Channels …… 6-1
Using Cursors …… 6-2
Additional Functionality …… 6-6
Copy …… 6-6
Strip Charts …… 6-7
XLS Overlay (Overlay of Excel Files) …… 6-8
Displaying Channel Pairs …… 6-10
Changing the Display Range …… 6-10
Changing Format, Scale, and Grid …… 6-12
Ch 7 –Waterfalls, Order Tracking, & Slice Views
3D Waterfalls …… 7-2
Order Tracking …… 7-7
Selecting Displays …… 7-8
Using Spectrum Cursors …… 7-11
Appendix A –Keyboard Controls for eZ-Analyst
Glossary

eZ-Analyst 988490 Software Installation, WaveBooks 1-1
Software Installation 1
WaveBooks …… 1-1
ZonicBook/618E …… 1-3
IOtech 640, 650, 652, and 655 …… 1-5
WaveBooks
System Requirements
Certain WBK options are not supported by eZ-Analyst. If you are using
WBK options with WaveBook and intend to use eZ-Analyst, refer to the
WBK support table on page 1-2.
Before setting up the hardware or installing the software, verify that you have the following items.
•WaveBook data acquisition system
•Power supply with cord
•For WaveBook/516E: Ethernet patch cable
•Dynamic Signal Analysis CD
•License Key for eZ-Analyst
In addition, verify that your computer meets the following minimum requirements.
•Monitor: SVGA, 1024 x 768 resolution
•For WaveBook/516E: 10/100BaseT Ethernet port
•Requires 32-bit version of Windows: Windows 2000 SP4, Windows XP, or Windows Vista (x86)
Windows 2000 SP4 and Windows XP Users:
PC with Intel™Pentium 4 or equivalent; 1 GB memory; 10 GB disk space
Windows Vista (x86) users:
•Optional, but recommended:
EPP (Enhanced Parallel Port), or
ECP (Extended Capabilities Port)
PC must be Windows Vista Premium Ready
Software Installation for WaveBooks
Remove any previous-installed versions of WaveBook software before installing
a new version.
1. Start Windows.
2. Close all running applications.
3. Insert the Dynamic Signal Analysis CD into your CD-ROM drive and wait for the CD to
auto-run.
If the CD does not start on its own:
(a) click the desktop’s <Start> button
(b) choose the Run command
(c) select the CD-ROM drive, then select the setup.exe file
(d) click <OK>
An Opening Screen will appear.

1-2 Software Installation, WaveBooks 988490 eZ-Analyst
4. Click the <ENTER SETUP> button.
5. From the hardware selection screen [which follows a licensing agreement], select
WaveBook Systems from the drop-down list and follow the on-screen instructions.
WBK Support for WaveBooks using eZ-Analyst
WBK Option Supported
WBK10A – Analog Expansion Module - no -
WBK11A – Simultaneous Sample & Hold (SSH) Card
WBK12A and WBK13A – Programmable Filter Cards
WBK14 – Dynamic Signal Conditioning Module
WBK15 – 5B Isolated Signal Conditioning Module - no -
WBK16 – Strain Gage Module - no -
WBK17 – Counter-Input Module, with Quadrature Encoder Support - no -
WBK18 – Dynamic Signal Conditioning Module
WBK20A – PCMCIA/EPP Interface Card and Cable
WBK21 – ISA/EPP Interface Plug-In Board
WBK23 – PCI/EPP Interface Plug-In Board
WBK25 – Ethernet Interface Module
WBK30 – WaveBook Memory Options
WBK40 and WBK41 – Thermocouple and Multi-Function I/O Modules - no -
WBK61 and WBK62 – High Voltage Adapters - no -
Information pertaining to these products is included in The WBK Options Manual, p/n
489-0902.
Reference Notes:
Adobe Acrobat PDF versions of documents pertaining to WaveBook are
included on the Dynamic Signal Analysis CD and are automatically installed
onto your PC’s hard-drive as a part of product support at the time of software
installation. The default location is the Programs group, which can be
accessed via the Windows Desktop Start Menu.
After your software is installed you can setup your WaveBook device and
connect it to the host computer. Instructions for Hardware Setup are included
in your WaveBook User’s Manual.

eZ-Analyst 988490 Software Installation, ZonicBook/618E 1-3
ZonicBook/618E
WBK Support
When used with ZonicBook/618E, eZ-Analyst supports WBK18 and WBK30.
System Requirements
Before setting up the hardware or installing the software, verify that you have the following
items.
•ZonicBook/618E Data Acquisition System
•Power Supply with cord
•Dynamic Signal Analysis CD
•License Key for eZ-Analyst
•Ethernet Patch Cable
•Dynamic Signal Analysis CD
•License Key for eZ-Analyst
In addition, verify that your computer system meets the following minimum requirements.
•Monitor: SVGA, 1024 x 768 screen resolution
•Ethernet jack [on PC or on a hub connected to the Ethernet]
•Requires 32-bit version of Windows: Windows 2000 SP4, Windows XP,
or Windows Vista (x86)
Windows 2000 SP4 and Windows XP Users:
PC with Intel™Pentium 4 or equivalent; 1 GB memory; 10 GB disk space
Windows Vista (x86) users:
Software Installation for ZonicBook/618E
PC must be Windows Vista Premium Ready
Remove any previous-installed versions of eZ-Analyst software before
installing a new version.
1. Start Windows.
2. Close all running applications.
3. Insert the Dynamic Signal Analysis CD into your CD-ROM drive and wait for the CD
to auto-run.
If the CD does not start on its own:
(a) click the desktop’s <Start> button
(b) choose the Run command
(c) select the CD-ROM drive, then select the setup.exe file.
(d) click <OK>.
An Opening Screen will appear.
4. Click the <ENTER SETUP> button.
5. From the hardware selection screen [which follows a licensing agreement], select
ZonicBook/618E from the drop-down list and follow the on-screen instructions.

1-4 Software Installation, ZonicBook/618E 988490 eZ-Analyst
Reference Notes:
oAdobe Acrobat PDF versions of documents pertaining to ZonicBook/618E
are included on the Dynamic Signal Analysis CD and are automatically
installed onto your PC’s hard-drive as a part of product support at the
time of software installation. The default location is the Programs
group, which can be accessed via the Windows Desktop Start Menu.
oAfter your software is installed you can setup your ZonicBook/618 and
connect it to the host computer. Instructions are included in the
ZonicBook/618E User’s Manual, p/n 1106-0901.

eZ-Analyst 896991 Software Installation, 640, 650, 652, 655 1-5
IOtech 640, 650, 652, and 655
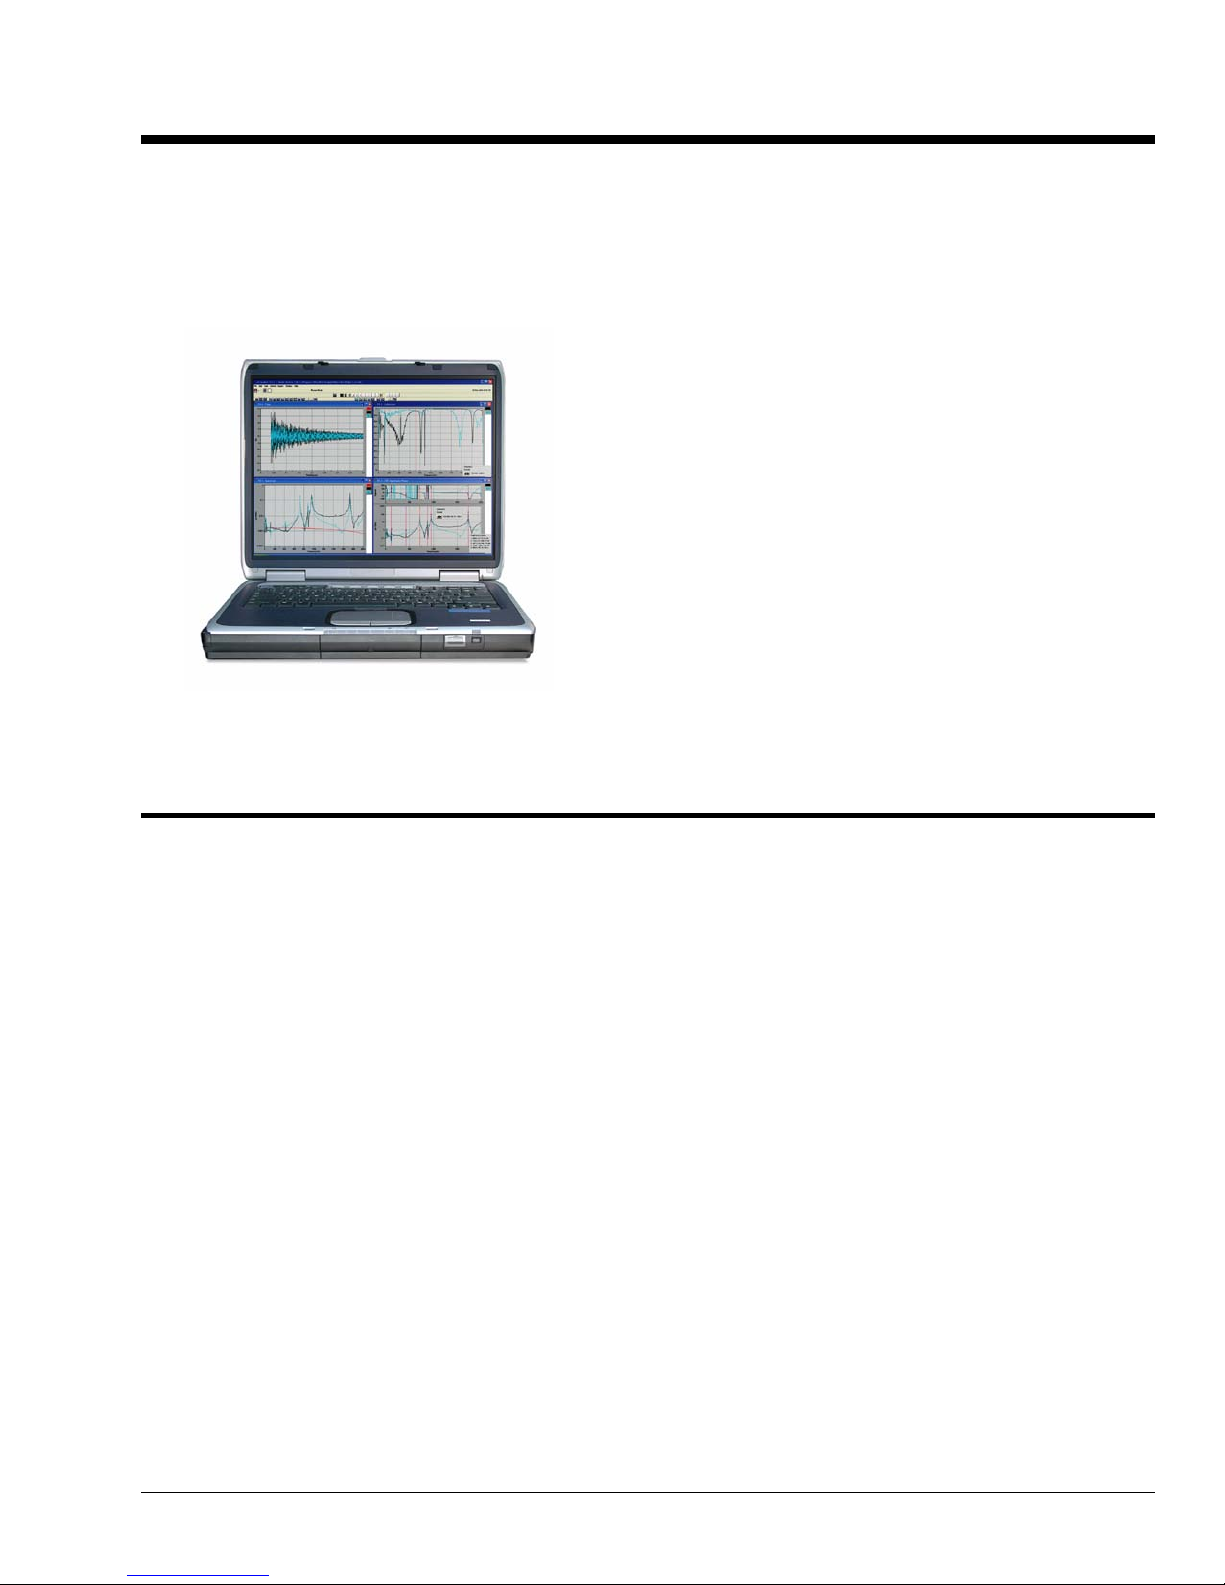
Dynamic Signal Analyzers for Vibration Analysis & Monitoring
640u, 650u, 652u, or 655u (USB2.0)
Verify that you have the following items.
•640u, 650u, 652u, or 655u
•USB Cable
•Dynamic Signal Analysis CD
•License Key for eZ-Analyst
•Requires 32-bit version of Windows:
Windows 2000 SP4, Windows XP, or Windows Vista (x86)
Windows 2000 SP4 and Windows XP Users:
PC with Intel™Pentium 4 or equivalent; 1 GB memory; 10 GB disk space
Windows Vista (x86) users:
640e and 650e (Ethernet)
PC must be Windows Vista Premium Ready
For a 640e or 650e verify that you have the following items.
•640e or 650e
•TR-2U Power Supply
•Ethernet Patch Cable
•Dynamic Signal Analysis CD
•License Keys for eZ-Analyst
•Requires 32-bit version of Windows:
Windows 2000 SP4, Windows XP, or Windows Vista (x86)
Windows 2000 SP4 and Windows XP Users:
PC with Intel™Pentium 4 or equivalent; 1 GB memory; 10 GB disk space
Windows Vista (x86) users:
PC must be Windows Vista Premium Ready
To Install the Software
(Applies to 640e/640u, 650e/650u, 652u, and 655u)
1. Close all running applications on the host PC.
2. Insert the Dynamic Signal Analysis CD into your CD-ROM drive and wait for the CD to auto-run.
An Opening Screen will appear.
4. Click the <ENTER SETUP> button.
5. From the hardware selection screen [which follows a licensing agreement], select the applicable
device (640e, 640u, 650e, 650u, 652u, or 655u) from the drop-down list and follow the on-screen
instructions.
Reference Notes:
oAfter the software is installed you can setup your 640, 650, 652, or 655 analyzer and
connect it to the host computer. Instructions are included in a Quick Start shipped with
the device.
oAdobe Acrobat PDF versions of documents pertaining to 640, 650, 652, and 655 analyzers
are included on the Dynamic Signal Analysis CD. In addition, they are automatically
installed onto your PC’s hard-drive as a part of product support at the time of software
installation. The default location is the Programs group, which can be accessed via the
Windows Desktop Start Menu.

eZ-Analyst Series 896991 Introduction 2-1
An Introduction to eZ-Analyst 2
Features …… 2-1
Measurement Mode …… 2-4
Playback Mode …… 2-4
A Word About Configuration …… 2-5
eZ-Analyst is the result of more than ten years of software
development and customer input. This software adds real-
time continuous and transient data acquisition to Wave-
Books, ZonicBook/618E, and to 640, 650, 652, and 655*
dynamic signal analyzers. Analysis can be in the time,
frequency, or order domain.
eZ-Analyst is operated through a series of setup windows
that display only the information deemed important to your
test. Acquisition configuration involves selecting desired
acquisition parameters from user-friendly menus.
*eZ-Analyst can be used for the dynamic channels of the 655 device, but not for the temperature channels. If you will be using a
655 for temperature applications you will need to use other software, such as eZ-TOMAS or DASYLab.
Features
•Real-time FFT analysis
•Easy-to-use graphical user interface provides fast setup
•Large number of display options: Time Waveform, Spectrum, Auto Spectrum,
FRF, Cross, PSD, Transfer Function, Coherence, Octave, and Waterfall
•Order Normalization and Order Tracked Plots
•Multiple Plot Overlays using exported data files
•Export to Excel, ME Scope, SMS Star, or UFF Type 58 ASCII or Binary
•Save/Recall display setups with multiple display windows and overlays
•Wide selection of real-time analysis features, including integration/differentiation
averaging, and much more

2-2 Introduction 896991 eZ-Analyst Series
Four Function View Windows in Playback Mode
eZ-Analyst is a graphical analysis application that can be used to collect, analyze, record, and
play back recorded data. With use of a 640, 650, 652, 655*, ZonicBook/618E, or WaveBook
analyzer, ez-Analyst can collect and display multiple channels of data in real-time. The
graphical displays can consist not only of the raw time-domain data, but also plots of
frequency domain data. For example, real time FFT (Fast Fourier Transform) plots.
Data that is recorded to disk-file is in the raw time domain and can be played back for
additional analysis time and time again. For example, a raw signal can be played back over-
and-over using different FFT Window algorithms to manipulate the signal. Once the desired
results have been achieved, the new data can be exported to a different file and format, while
preserving the original file. In addition, the playback capability does not require the presence
of analyzer hardware.
*eZ-Analyst can be used for the dynamic channels of the 655 device, but not for the temperature channels. If you will
be using a 655 for temperature applications you will need to use other software, such as eZ-TOMAS or DASYLab.
Slider
Task Bar
Acquisition Graph Edit Input Channel
Status Toolbar Config. Window (Open/Close)
Analog Input Tach
Channels Channels
Date/Time
Playback / Record
Status
Channel
Identifiers
Averaging
Status

eZ-Analyst Series 896991 Introduction 2-3
You can select the Measurement Mode or the Playback mode from either the Task pull-down
menu, or by using the <Change Task Mode> button [the first button in the Task Bar]. The
Task Tool Bar automatically changes to accommodate the selected mode.
1 Status
Message A message regarding the status, if applicable, will be displayed in this area. Examples of
possible messages are: Double Hammer Rejected, Overload Rejected, Reject (Manual Reject
Mode), and GAP.
2 Acquisition
Status Indicates the status of the acquisition.
Waiting Trigger indicates that a trigger has not been recognized since the Acquire button
was clicked.
Triggered indicates eZ-Analyst is capturing and processing data based on the setup
conditions.
Acquiring indicates that data is being acquired, but is not being recorded to disk.
Recording indicates that data is being recorded-to-disk, as it is being acquired.
Completed indicates eZ-Analyst has finished processing the frame of data.
The “Averages Count” increments by 1 at this time.
3 Date/Time Provides time in the following format: Day-Month-Year, Hour: Minutes: Seconds.
When in Record Mode the current time is displayed.
When in Playback Mode the measured time is displayed.
4 Slider Bar The sliding bar indicates the relative location of the displayed data. The record number and
the number of records in the file are listed to the right. The slider can be used to quickly
locate a specific record. Note that both the Record and the Playback mode make use of the
slider bar.
5 Playback /
Recording
Status
Displays the current record and the total number of records to be collected. Time
equivalents are included in parenthesis
Example, 12/25 means that the record currently displayed is the 12th record, out of a total of
25 records.
Averaging
Status This field shows when the Averaging Mode is used, during the Scope Mode or the Playback
Mode. A display of 2/5 would indicate that 2 averages have been performed out of a total of
5 averages to be performed.
6 Channels Each numbered box represents a channel. Drag a channel [channel-box] to the plot area to
have its data displayed. That channel’s data is plotted in a distinct color and a color-coded
channel button is displayed to the right of the plot.
Reference channels are bold and italic. The underlined channel is the current reference
channel. Use the right mouse button to select current reference channel. Reference
channels are specified in the Configuration accessed via the Edit Menu.

2-4 Introduction 896991 eZ-Analyst Series
Measurement Mode
The Measurement Mode is an active data-collecting mode, which, for that reason, requires the
use of data acquisition hardware. The Measurement Mode can only be selected if analyzer
hardware is present.
The Measurement Mode acquires data using one of the following three methods:
(1) Scope-Continuous, (2) Scope-Single, and (3) Record.
The Scope-Continuous and Scope-Single methods display data, but do not log data. The
scope methods are useful for signal validation and checkout. The Record method, in addition
to displaying data, logs data-to-disk based on user-defined start and stop criteria.
In addition to being selected from the Task Menu, the Measurement Mode can be selected
from the Task Tool Bar by clicking the <Change Task Mode> button while in the Playback
Mode. Clicking this button from Measurement Mode will change the task mode tool bar to
Playback.
The Measurement Mode is detailed in Chapter 3.
Measurement Mode Task Bar
Playback Mode
The Playback Mode does not require the presence of physical hardware. When in Playback,
eZ-Analyst is strictly a post-acquisition display and analysis program. Raw time-domain data,
that has been recorded-to-disk, can be played back for analysis repeatedly. For example, a
raw signal could be played back several times, each time using a different FFT Window
algorithm to manipulate the original signal. Once the desired results have been achieved the
new data can be exported in a new format and to a different file. The original file can remain
unchanged, and kept for future analysis.
To activate the Playback Mode, select Playback/Review on the Task Menu. An option is to click
the <Change Task Mode> button (the first button in the tool bar) while in the Measurement
Mode. If an analyzer (acquisition hardware) is not available eZ-Analyst will automatically
enter the Playback mode and will display the data that was most recently recorded to disk.
The Playback Mode is detailed in Chapter 3.
Playback Mode Task Bar
Scope-Continuous Scope-Single Record Cursor Lock
Change
Task Mode
Play Backward, Play Backward Stop Play Play Forward
One Frame at a Time One Frame at a Time
Change
Task Mode

eZ-Analyst Series 896991 Introduction 2-5
A Word About Configuration
Configuring Input Channels
eZ-Analyst makes use of various menus and related windows for the purpose of configuration.
Chapter 4 is devoted exclusively to the Edit menu. It is that menu which provides access to
the Configuration Window (see figure). It is from the Configuration Window that the majority
of acquisition related settings are made.

eZ-Analyst 989090 Menus 3-1
Menus 3
Task Menu …… 3-1
Measurement Mode…….3-1
Playback Mode…….3-2
Input Range (Auto/Manual)……..3-3
Calibration………..3-5
File Menu …… 3-10
Control Menu …… 3-10
Export Menu …… 3-11
Window Menu …… 3-13
Edit Menu …… see chapter 4
Waterfalls, Order Tracking, and Frequency
Slices ….. see chapter 7
Reference Note:
Refer to chapter 4 for information
regarding the Edit Menu.
Note! The “Edit Menu>Configuration>
Preferences tab” section of chapter 4
discusses a Measurement Mode panel.
This panel is of importance to file
overwrite protection, and should be
read (see page 4-38).
Refer to Chapter 7 for details regarding
three spectrum only views: 3D Waterfall,
Frequency Slice, and Spectrum Display
Split View.
Foreword
The menus, with exception of the Task Menu and the Edit Menu,are presented in the
order that they appear on eZ-Analyst’s main window. The Task Menu is discussed first
since it is from this menu that the user (1) selects Measurement Mode or Playback
Mode and (2) makes use of the Auto-Ranging feature for input channels.
The Edit Menu is perhaps the most significant of all eZ-Analyst menus and is the most
frequently used. Chapter 4 is dedicated solely to the Edit Menu.
Task Menu
Task Menu > Measurement Mode
The Measurement Mode is an active data-collecting mode, which, for that reason, requires the
use of data acquisition hardware. The Measurement Mode can only be selected if an
appropriate data acquisition device is used; otherwise, eZ-Analyst will run in the Playback
Mode.
The Measurement Mode acquires data using one of the following three methods:
(1) Scope-Continuous, (2) Scope-Single, and (3) Record.
The Scope-Continuous and Scope-Single methods display data, but do not log data. The scope
methods are useful for signal validation and checkout. The Record method, in addition to
displaying data, logs data-to-disk based on user-defined start and stop criteria.
In addition to being selected from the Task Menu, the Measurement Mode can be selected from
the Task Tool Bar by clicking the <Change Task Mode> button while in the Playback Mode.
Clicking this button from Measurement Mode will change the task mode tool bar to Playback.
Measurement Mode Task Bar
Scope-Continuous Scope-Single Record Cursor Lock
Change
Task Mode

3-2 Menus 987990 eZ-Analyst
Note that grayed-out buttons indicate that the associated function is not available due to a prerequisite not being met.
Change Task
Mode
Changes the task from Measurement Mode to Playback Mode.
The Task Bar buttons will change accordingly.
Record Starts recording data-to-disk in continuous time. Note that a ZonicBook or
WaveBook must be used to acquire data.
Scope-Continuous Starts a block-time data acquisition. This scope method is typically used to
acquire impact data or to take measurements when data storage is not required.
Scope-Single
Starts a single-time run data acquisition. This scope method is typically used to
acquire impact data or to take measurements when data storage is not required.
Signal Generator The Signal Generator button toggles between two images and is only active when
hardware is present.
The sine wave button indicates that the generator is ON. Clicking on it will turn the
generator OFF and the button image will change to a circled red line, indicating that
the generator is OFF.
Clicking the button, while the “Off Status” image is present, will turn the Signal
Generator back ON, and will change the button to show the sine wave image.
Note: For WaveBook applications you must set the applicable output channel
(that is to generate the signal) to “Active.” See, Output Channel Setup in chapter 4.
Indicates that
the Generator
is turned ON
Indicates that
the Generator
is turned OFF
Cursor Lock An active cursor lock button will have the image of an opened or locked padlock.
When the padlock is locked (closed), cursors in multiple windows will be
synchronized and locked, providing that the windows are of the same time domain,
frequency domain, or have the same octave band data.
An opened padlock image indicates that cursors in multiple windows have
independent cursor movement, i.e., they are unsynchronized.
Export This button exports data, if export conditions are set. For details, see the section,
Export Menu> Export Function Data.
Task Menu > Playback / Review Mode
The Playback Mode does not require the presence of physical hardware. When in Playback, eZ-Analyst is
strictly a post-acquisition display and analysis program. Raw time-domain data, that has been recorded-
to-disk, can be played back for analysis repeatedly. For example, a raw signal could be played back
several times, each time using a different FFT Window algorithm to manipulate the original signal. Once
the desired results have been achieved the new data can be exported in a new format and to a different
file. The original file can remain unchanged, and kept for future analysis.
To activate the Playback Mode, select Playback/Review on the Task Menu. An option is to click the
<Change Task Mode> button (the first button in the tool bar) while in the Measurement Mode. Also,
note that when a WaveBook or ZonicBook is not available, eZ-Analyst will automatically enter the
Playback mode and will display the data that was most recently recorded to disk.
You can temporarily change three aspects of Engineering Units (EU) to customize your
playback of data (see figure at right). These are EU Mode, mV/EU and EU Offset. To
change the settings navigate as follows: Edit Menu>>Configuration>>Input Channels Tab;
and then make the desired changes. The new settings will be applied to your playback
session; however, upon closing eZ-Analyst the settings will default to those originally
configured at the time the data was recorded. Chapter 4 includes additional information
about the Configuration Input Channels tab.
Section of Configuration
Input Channels Tab
Play Backward, Play Backward Stop Play Play Forward
One Frame at a Time One Frame at a Time
Change
Task Mode
Playback Mode Task Bar

eZ-Analyst 989090 Menus 3-3
Task Menu > Input Range (Auto/Manual) *
Auto-ranging is a procedure that automatically sets the input full-scale voltage (FSV) range for
input channels. The FSV is set by measuring a representative sample of real-time data. Auto-
ranging is only performed on active channels.
Auto-ranging works best if you supply the maximum expected voltage range for the data that
will be captured during the acquisition. Therefore, make the Auto Range Duration long enough
to apply a typical signal. In addition, make sure that the Auto Range Analysis Frequency is
fast enough to capture the high frequency component. Typically the Analysis Frequency will
be the same setting as eZ-Analyst’s Acquisition Analysis Frequency.
AutoRange Dialog Box, from a WaveBook
Note that AutoRange Dialog Boxes for other analyzers are similar.
* You can access the dialog box by clicking the <Auto Range> button, which is located on the
Input Channels tab, when in the “Measurement Mode.”

3-4 Menus 987990 eZ-Analyst
Mode
The Mode panel consists of three radio buttons, which are used to select one of the following
range modes: AutoRange(%), AutoRange(V), or ManualRange(V).
Starting FSV
The Starting FSV (Full Scale Voltage) panel consists of three radio buttons, which are used to
set the starting FSV to Maximum, Minimum, or Current.
Channel Gauges
The channel gauges, one per channel, display the instantaneous peak value as percentage or
voltage, depending on the mode that was selected. The color of the vertical bar has the
following significance:
Yellow The signal range is from 0 to the minimum Full-Scale Voltage set in the Auto-range Setup
window.
Green The signal range is from the minimum to the maximum of the Full-Scale Voltage set in the
Auto-range Setup window.
Red The signal range is over the maximum of the Full-Scale Voltage set in the Auto-range Setup
window.
%, FSVF, & Factors Display
Maximum FSV is the high-end limit for the input voltage.
Note that 25.7 V is the highest possible FSV for a ZonicBook
Medallion.
Minimum FSV is the low-end limit for the input voltage. In
the figure at the right Minimum FSV is set to 0.2 volts.
HI Accept %defines the highest acceptable percentage of
peak input voltage for the selected FSV, i.e., Current, Minimum, or Maximum. Thus, if
our selected FSV was 0.2 V and we had an upper limit of 90%; then our upper limit in
volts would be 0.18 V. An example follows as to how exceeding this value causes a range
adjustment.
LO Accept %defines the lowest acceptable percentage of peak input voltage for the
selected FSV, i.e., (Current, Minimum, or Maximum). Thus, if our selected FSV was 0.2 V
and we had a lower limit of 10%; then our actual low limit in volts would be .02 V.
Incr Factor (Increasing Factor) is the factor by which the Current FSV will increase,
should the peak exceed the upper limit. In the figure we see that the Increasing factor is
1.5.
Decr Factor (Decreasing Factor) is the factor by which the Current FSV will decrease,
should the peak not reach the lower limit. Keeping the decrease factor at “1” will result in
no decrease of the Current FSV. Setting the Decrease Factor to 0.8 would cause the
Current FSV to decrease to 80% of its value if the peak fell short of the low limit.
Note: These are the same values that were entered in the Vpeak column in the Channel Setup
window. The values are immediately replaced when the Auto ranging process begins.

eZ-Analyst 989090 Menus 3-5
An Example of Auto-Ranging
Maximum FSV set at 25.7 V
Minimum FSV set at 0.2 V
Upper Limit set at 90%
Lower Limit set at 10%
Increasing Factor set at 1.5
Decreasing Factor set at 1
In this example we have set the radio button for
Current FSV instead of Minimum or Maximum
(note 2). The starting value, in the example, is 0.20 V.
In the first iteration we see
that we have a peak of 0.19 V.
This falls outside of our band of
0.02 to 0.18 V that was
established by our upper and
lower limit percentages; i.e.,
90% of the Current FSV and
10% of the FSV.
An Example of Auto-Ranging
As a result, the Current FSV is increased by a factor of 1.5 (our Increasing Factor) and the
Current FSV becomes 0.30 V. Our limits, in volts, also changed since we are now looking
at percentages of 0.30 volts instead of the same percentages of 0.20 volts.
In the second iteration of our example, we see a 0.22 volt peak. This value is within our
established limits so the Current FSV does not change.
Note 1: If the Capture Mode is the Input Channel (Trigger Mode), the Auto Range process waits for a
trigger.
Note 2: A Start FSV of Minimum or Maximum can selected instead of Current FSV, as in our example.
Minimum FSV is the default.
Task Menu > Calibration
When calibration is performed, a signal of known Peak level [or RMS value] is supplied to a
transducer that is connected to an active input channel. An accelerometer calibrator or piston
phone is typically used to generate the calibration signal for vibration sensors and microphones,
respectively.
Examples:
Accelerometer calibrators typically make use of linear engineering
units and, as their name implies, are used for calibrating
accelerometers.
Piston phones are most often used for calibrating microphones. Piston
phones typically make use of decibel (dB) engineering units.
eZ-Analyst includes a Calibration window for selecting the channels to be calibrated and for
entering several signal-related parameters. In addition, the calibration is actually started from
the window.

3-6 Menus 989090 eZ-Analyst
When you are in “Measurement Mode” you can access the Calibration window from the Task
Menu or from the Input/Output Channels tab.
Calibration Display Screen
When a channel is calibrated, the number of averages used will be 5, or the
number that is designated in the “No. of Averages” field (located on the
Analyzer Tab). The greater of the two values will be used, automatically.
A discussion of the various regions of the Calibration window now follows.
The section concludes with an example.
Calibration Process
Single
Channel Used to select one active channel at a time. When the calibrator only has
one channel output, the Single Channel method must be used. When
Single Channel is selected, the “Active” column shows a radio button next
to each channel.
Multiple
Channel Used to select two or more channels for simultaneous calibration. This is
only an option when the calibrator offers more than one output. When
Multiple Channel is selected, the “Active” column shows a checkbox next to
each channel.
Calibration Domain
With the use of Fourier Transform, any signal can be viewed from a time domain or a
frequency domain. Either domain can be selected for use in the calibration process.
Time The overall value is computed using time domain data.
Freq-
uency The overall value is computed with frequency domain data by summing up
frequency component of FFT spectrum.
Calibrator Frequency (Hz)
This field is used to enter the frequency setting of the calibrator. The analysis frequency,
which is twice this frequency, is used if possible. Otherwise, the maximum allowed
analysis frequency is used.
Table of contents