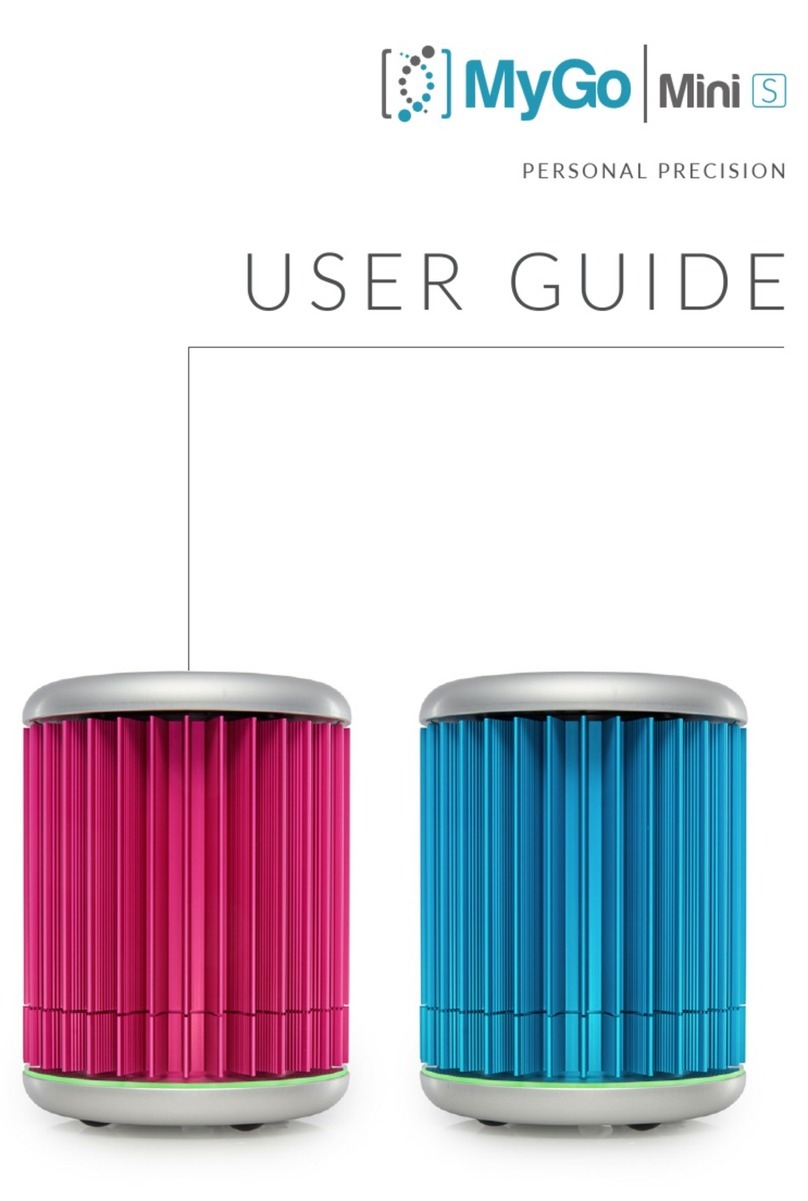
MyGo Mini User manual

USER GUIDE
PERSONAL PRECISION
MyGo
M
i
n
i

2 3
WELCOME
Thank you for choosing the MyGo Mini.
The MyGo Mini is the world’s most compact
real-time PCR instrument, with no moving parts
providing silent operation and maximum reliability.
With outstanding precision, it is capable of providing
great results over a broad range of applications.
Personal precision... SETUP
Learn how to install your
MyGo Mini - from setting it
up on your workbench, to
configuring the instrument
and installing the software.
TIPS
Learn some useful tips when
using your instrument.
EXPERIMENT
Learn the basics of setting
up an experiment on your
MyGo Mini.
ANALYSIS
Learn how to easily
analyse your results.
EXPORT
Learn how to export your data
for use with other software.
MAINTENANCE
Learn how to look after
your MyGo Mini.
TROUBLESHOOTING
If you ever have a problem
with your instrument, learn
how to troubleshoot it here.
CONTENT
This quick start guide will teach you what you need
to know to start running your MyGo Mini. It describes
everything from opening and closing the lid, to data
analysis for your qPCR experiments.
Contents include...

4 5
1. MYGO MINI QPCR INSTRUMENT
2. MYGO MINI USER GUIDE
3. POWER SUPPLY UNIT AND MAINS CABLE
4. ETHERNET CABLE
5. USB DRIVE
6. USB DRIVE EXTENSION CABLE
SETUP
INSTALLING YOUR MYGO MINI
You should have the following items in the MyGo Mini box:
Please keep the box the MyGo Mini came in, in case you need to
protect your MyGo Mini during storage or shipment in future.
Heatsink
Lid
Foot
Display LEDs
LID
The lid of the MyGo Mini
can be removed from the
instrument and must be
attached at all times when
not in use. To remove the
lid push down and turn
anticlockwise. To attach
the lid, first line up the lugs
on the lid with the grooves
on the mount plate as
shown below. Once aligned
press down, and then turn
clockwise to secure until you
feel a hard stop.
If the instrument is
connected to power the
instrument will say “Lid on”
and “Lid off” when you attach
and remove the heated lid.
The instrument will display
green when the lid is fitted,
and display pulsating yellow
when the lid is removed.
The lid may get warm during
operation; this is normal.
HEATSINK
This is the outer body of
the instrument and enables
efficient cooling of the
system during thermal
cycling. Ensure that there
is free airflow around the
instrument - do not cover
or wrap the instrument,
and keep it at least 5 cm
away from objects or walls.
FOOT
The foot should always be
placed facing down on your
worktop during operation.
Grooves
Lugs

6 7
USB PORT
MYGO MINI CONNECTIONS
If you turn your MyGo Mini upside down you will see
three connections as shown below:
Insert the USB drive here
to run an experiment from
the USB drive, or to update
firmware using a USB drive.
You can use the supplied USB
drive extension cable.
This is for connecting your
MyGo Mini to your LAN or
computer.
USB Port
Ethernet Port
Power
ETHERNET PORT
POWER
This is to connect your MyGo Mini to the provided power supply unit.
Connect one end of
the ethernet cable to
the instrument and the
other end to a LAN port,
or directly to your computer.
Once your MyGo Mini is
connected to a LAN, you can
connect to your instrument via
Wi-Fi if your network supports it.
POWERING ON YOUR MYGO MINI
Connect the power supply to the MyGo Mini, place
the MyGo Mini on your lab bench, and then connect
AC power to the power supply unit. Your instrument
will now turn on after a few seconds. The display LEDs
will light up multi-coloured, and then turn green if a lid
is attached, or yellow if not. Your MyGo Mini is ready
to run.
CONNECTING
YOUR MYGO MINI
TO A NETWORK,
PC OR LAPTOP
A summary of these connections
is shown on the following page...

8 9
MyGo Mini Connection Modes
1. Direct network connection
2. Local area network connection
3. USB drive connection
MYGO MINI LIGHTS AND SOUNDS
The MyGo Mini uses display LEDs and sounds to
help you understand what the instrument is doing.
Here is a summary of these display LEDs and sounds:
DISPLAY LEDs
SOUNDS
Green Idle / Ready to run
Yellow Lid off
Blue Experiment is starting/
cooling down
Blue Running, low temperature
Pink Running, medium temperature
Red Running, high temperature
Multi-Coloured Experiment complete
Red-Flashing Fault detected
“Lid On” The lid has been attached
“Lid Off” The lid has been removed
“Analysis Starting” An experiment has begun
“Analysis Complete” An experiment has been
completed

10 11
INSTALLING YOUR
MYGO MINI SOFTWARE
Your MyGo USB drive contains software for Windows,
Mac OS X and Linux operating systems. Please open
the software le matching your chosen operating
system. The latest version of the software can also be
downloaded from our website mygopcr.com.
WINDOWS
Double-click on the
windows installer and follow
the on-screen instructions
to install your MyGo Mini
software on Windows.
MAC OS X
Double-click on the
disk image and follow
the on-screen instructions
to install your MyGo Mini
software on your Mac PC.
CONFIGURING YOUR MYGO MINI
With your MyGo Mini software open and your
MyGo Mini connected to the network please connect
to your MyGo Mini Instrument.
Please select Configuration

12 13
To add your new MyGo Mini
select the Add button. You
will now be presented with
a list of available instruments.
Please select MyGo Mini
Double-click on the
instrument you wish to
connect to, or press Select
with the instrument selected.
The instrument will now
be added to the list of
Registered Instruments
for use in the software.

14 15
Intensity (RFU)
Cycle
TIPS
Here are some great tips to keep in mind whilst running your
MyGo instrument.
1. LID GETS WARM
2. DO NOT LEAVE THE LID OFF
3. SPIN YOUR TUBES
4. REMOVE ALL BUBBLES
5. KEEP YOUR LAB CLEAN
6. KEEP YOUR INSTRUMENT CLEAN
7. PC SETTINGS
LID GETS WARM
The MyGo Mini lid can get warm during operation, this is
completely normal.
SPIN YOUR TUBES
This will ensure all well contents are at the bottom of the
wells and will improve performance.
REMOVE ALL BUBBLES
Bubbles can cause optical artefacts as shown in the graph
below. Ensure that no bubbles are present in reaction volumes.
KEEP YOUR LAB CLEAN
Please keep your work space clean including all lab equipment
like surfaces, pipettes, and tube racks. This will keep the
instrument clean and help maintain good results.
KEEP YOUR INSTRUMENT CLEAN
We recommend a routine cleaning of your instrument. To do
so follow the cleaning guide in the Maintenance section.
PC SETTINGS
Please disable all power saving settings e.g. sleep and hibernate.
DO NOT LEAVE THE LID OFF
If the lid is off dust may fall into the wells and affect the
performance of your instrument.
Artefact

16 17
CREATE A NEW EXPERIMENT
EXPERIMENT
This section will teach you everything you need to know
to get started with MyGo Mini experiments. You will
learn how to create, save, open and close experiments.
You will also learn how to set up an experiment including
thermal prole, sample information and optical settings.
Finally we will show you how to run your new experiment
from the software and from the USB drive provided.
Below is the MyGo mini home screen.
Click New to create
a new experiment.
EXPERIMENT SUMMARY
Once you have created a new experiment the
Experiment Summary will be displayed as shown below:
By default the experiment
name will be “New
Experiment” with a date
and time stamp, which
can be edited.
The summary will give
you information about the
instrument you are running,
the settings chosen and any
useful notes you choose to
add about your experiment.

18 19
The Files of Type drop down
menu gives you the option to
open an experiment normally
or as a template that can be
used for a new run.
OPEN AN EXPERIMENT
By selecting Open you can open an experiment
as shown below:
FILES OF TYPE
EXPERIMENT FILE
An experiment file will contain
all the data and analyses but
can not be re-run.
To open as an Experiment
File select the first option
shown on the opposite page.
EXPERIMENT FILE
AS TEMPLATE
Opening an experiment file
as a template allows you to
use the same profile, samples,
settings and analyses to
re-run a previous experiment,
generating new data. When an
experiment file is opened as
a template, it has the same:
1. Temperature profile.
2. Optical settings.
3. Samples and targets.
4. Analyses, including settings.
If you wish to open an
Experiment File as Template
select the second option.
USB RUN
To open a USB run navigate to the USB location using the
Open dialog window shown to the left. Select Experiment File
in the Files of Type drop down menu and then double click on
the USB run.

20 21
SAVING AN EXPERIMENT
Once an experiment has completed it can either be
automatically saved to a pre-set location on your
computer or manually saved by you. The experiment
must be saved before the software is closed to ensure
that data is not lost.
AUTOMATIC
SAVING
When starting a run you will
be prompted with the window
displayed below.
Make sure the rst checkbox is selected and your
experiments will be automatically saved. To prevent
the software from showing this dialog again, select the
second checkbox. You can change these settings later
by clicking Conguration and selecting General Cong.
To automatically save your
data when the experiment
has nished, rstly click
Browse and choose the
location to save your run to.
MANUAL SAVING
Once your experiment has finished you can save your experiment
manually by selecting Save or Save As. If your experiment is
unsaved, you will be prompted to choose a location to save your
experiment. If your experiment is already saved you can save any
changes made to the experiment by selecting Save, which will
overwrite the previous version.
CLOSING AN EXPERIMENT
To close an experiment select Close. If the experiment has not
been saved the following dialog box will appear:

22 23
SETTING UP A PROFILE
In this section we will cover Hold Times, Programs
and setting up a temperature prole.
HOLD TIMES
During thermal cycling protocols hold times should be chosen
to allow for the following: thermal equilibration of reaction
volumes; completion of biochemical reactions, for example full
length strand extension; and optical data acquisition.
Typically, optical data is acquired at the same temperature
that strand extension occurs. By default this time is set to
30 seconds, However, this time can be reduced to a minimum
of 3 seconds, to save time, or increased to more than 30 seconds
in order to increase PCR efficiency and optical sensitivity.
For other hold times during cycling protocols, by default times
are set to 10 seconds. However, this time can be reduced to a
minimum of 3 seconds, to save time, or increased to more than
10 seconds in order to increase PCR efficiency.
A thermal prole is required to perform an experiment.
Select the profile tab as shown below:
PROGRAMS
To add a program to your experiment click
Add in the Programs pane. Programs can
be deleted by selecting them in the list then
clicking Delete. The program order can also
be altered by selecting the program to move
then clicking the Up and Down arrows.

24 25
TEMPERATURE PROFILE
Once programs have been added to the experiment they will
appear in the Temperature Profile pane in the order they are
present in the Programs window as shown below:
PROGRAM
SETTINGS
To alter the settings of
a particular program you
should first select it, then
refer to the right hand pane.
In the example above the
Melting program is selected
and can be edited in the
right hand pane.
SAMPLES
You will now learn how to set up samples and targets
which can be dened as follows:
SAMPLES TARGETS
A description of the
specimen being analysed
e.g. “Mouse #5”
A molecular target e.g. “x174”,
detected with a specified
fluorescent reporter e.g. “FAM”
Samples or targets do not need to be dened
before starting a run. They can be added to
an experiment, whilst it is running, or once it
has nished. With a new experiment created,
please select the Samples tab as shown below:

26 27
ADDING SAMPLES AND TARGETS
Samples and targets can be added and removed
from the experiment by selecting +and -in the
Samples and Targets pane.
The order of samples and targets can be altered
by clicking the Up and Down arrows in the Samples
and Targets pane.
AVAILABLE TARGETS
The MyGo Mini comes pre-calibrated for 7 different fluorescent
labels, and the software enables users to use any dye with an
emission maximum between 510nm and 560nm. A list of the
available dyes on the MyGo Mini can be viewed below:
DYE FILE GENERATION
The dye file generation analysis allows you to calibrate new
dyes that are not included in the factory-calibrated list. The
calibration is based on a PCR amplification using the relevant
dye or labelled probe. To generate your own dye file go to
Analysis > Auto Dye File Generation.
You can visit our website for more information on dye file
generation.
ASSIGNING SAMPLES TO WELLS
Assign wells by selecting them and clicking Set.
Samples can also be unassigned by selecting
wells you wish to un-assign and clicking Clear.
ASSIGNING TARGETS TO WELLS
Targets can be assigned to wells as a Standard,
Unknown or Negative by clicking Std., Unk., or Neg.,
respectively. Assignments can be cleared by clicking
Clear with the targets and wells you wish to clear
selected. For more information about different types
of standard controls please see the full version of the
software manual.
Factory Calibrated Dyes SYBR Green I, ResoLight,
FAM, VIC, HEX, CAL 540,
CAL 560,

28 29
Sample and target setups can be saved in the following formats:
SAVING AND OPENING A SAMPLE SETUP
If you wish to save or open sample and target information setup
you can select Save As... or Open, respectively.
CSV Editable .csv files.
PSD A proprietary locked file format.
RDML The Real-time PCR Data Markup Language (RDML)
is a structured and universal data standard for
exchanging quantitative PCR (qPCR) data.
If you need greater control
of how optical data is acquired
during your experiment, select
“Use Advanced Settings”.
RUN SETTINGS
The MyGo Mini software provides
default optical settings which do
not need to be changed for most
applications. To view them, select
the Run Settings tab.
CYCLING ACQUISITIONS
During cycling, by default, optical data
will be acquired with settings compatible
with a broad range of assays.
MELT ACQUISITIONS
During melting analysis, optical
data will be recorded every 500ms.
This rate provides relatively compact
experimental data file sizes, and
supports demanding High
Resolution Melting assays.

30 31
DYE CALIBRATIONS
Here is where you can review the current dyes present
in your experiment. You have the following options
when working with dyes in your MyGo Mini software:
OPEN
Open dye calibrations
from a file to be added to
this experiment.
SAVE
Save a dye calibration from
your experiment to a file on
your computer. These can then
be used on multiple computers
and MyGo Mini instruments.
REMOVE
Remove dye calibrations
from this experiment.
Factory calibrated dye
files can not be removed.
RENAME
Rename your dye files
to your liking.
UPDATE FROM DEVICE
Upload dye files from
your MyGo Mini to your
new experiment.
Integration Time controls the exposure time, in seconds, of the
optical sensor inside the MyGo instrument. Brighter reagents
require shorter integration times than dimmer reagents.
Longer integration times will provide improved signal to noise
with dim fluorescent reporters. Short integration times will
reduce the risk of the fluorescence detection system being
saturated by very bright fluorescent reporters.
CYCLING ACQUISITIONS - INTEGRATION TIME (S)
Here you can specify the integration time (in seconds) for
optical data acquisitions made during thermal cycling.
MELT ACQUISITIONS - INTEGRATION TIME FOR MELT (S)
Here you can specify the integration time (in seconds) for
optical data acquisitions made during melting analysis.
ADVANCED SETTINGS
Here, if necessary, you can tailor optical settings to
your assay’s characteristics.

32 33
STARTING A RUN FROM
THE SOFTWARE
To start a run from the MyGo Mini software select
Start Run. You will then be presented with the auto
save options (unless you have chosen not to be
prompted) and then be asked to choose an instrument
from the list of Registered Instruments. Select an
instrument and press Select to begin the run.
STARTING A RUN FROM
A USB STICK
To start a run using a USB drive select Start Run. Then,
when you are asked to choose an instrument, select
Start run from USB. You will then be prompted to nd
the location of your USB drive. Once selected press
Save and safely remove your USB drive as normal. The
USB drive can now be placed into the instrument and
your experiment will start automatically.
LOADING TUBES INTO
YOUR MYGO MINI
In order to ensure that the heated lid is balanced, please
make sure that the mount contains a tube in each of
positions 1, 5, 9, and 13. These positions can be lled
with tubes containing reagents, or empty tubes.
5
1 9
13

34 35
ANALYSIS
This section will teach you about different types
of analysis available. These can be grouped into the
following groups. For information about more analysis
options please see the full version of the software manual.
QUANTIFICATION
Determine accurate quantities
of template or relative expression
levels of genes using Absolute
Quantification or Relative
Quantification.
GENOTYPING
Use TaqMan probes or High
Resolution Melting to perform
SNP genotyping using Automatic
Endpoint Genotyping or
Automatic High Resolution Melt.
MELTING
Automatically determine the
melting temperature of your
amplicons using Automatic
Tm Calling.
RUN FUSION
Combine data from multiple
runs on your MyGo Mini for
analysis together.

36 37
Analysis types are separated into Automatic and Manual
sections. Automatic analysis types use advanced automated
data processing to provide accurate results with minimal user
intervention. Manual analysis types enable users to apply
traditional analytical methods.
SELECT ANALYSIS TYPE
You can add an analysis type by selecting the “+” button
in the bottom left of the software window.
Ticks and crosses indicate
which analyses can be applied
to the data in your experiment.
QUALITY
Quality is a measure of how clean an amplication appears.
This value will tend to be higher for amplications with a clear
exponential phase and steady baseline, and lower for noisier
or flatter curves.
INTENSITY
Intensity is a measure of the size of the exponential
phase of the amplification. Note that this may be smaller
for amplifications with a negative baseline drift.
PERFORMANCE
Performance is a measure related to the observed efciency of
amplication at later cycles. This value will tend to be lower for
inhibited or out-competed reactions, and higher for efcient reactions.
AUTOMATIC QUANTIFICATION
POSITIVE / NEGATIVE CALLING
The first step in amplification analysis is to determine which
targets have produced a positive amplification curve and which
amplifications have produced a negative amplification curve.
For every amplification curve the software calculates
three metrics, these metrics are used to determine which
amplifications are positive. These metrics are:

38 39
The dots represent individual amplification curves in your
experiment. All dots that are within the top right of the
graph are called positive and will be subject to normalization
determined in Advanced Settings.
To switch between “Intensity vs Quality” and “Performance
vs Quality” select the Graph Axes drop down menu.
All 3 thresholds are used for calling even if they are not
currently displayed on the graph.
SETTINGS
The software uses a combination of Quality (Q), Performance
(P), and Intensity (I) thresholds to determine if an amplification
is positive (green zone) or negative (red zone). All values (Q, P
and I) must be above the relevant threshold for an amplification
to be called positive. The Settings tab enables you to review
metrics for amplifications and set appropriate thresholds.
EXCL. CYC. MIN.
The software will exclude at least this number of cycles
from data before performing analysis.
AUTO EXCL. CYC.
By default the software will automatically determine which
cycles at the beginning of a run exhibit artefacts, and exclude
this number of cycles from data before performing analysis.
This feature can be disabled by deselecting this option.
ARTEFACT FILTERING
Biochemical and physical factors can cause fluorescence levels
to change during a run. These are often observed during early
cycles. Filtering out these artefacts can improve the accuracy
of amplification analysis. Two settings enable you to control the
process of filtering out such artefacts.
Table of contents
Other MyGo Laboratory Equipment manuals
Popular Laboratory Equipment manuals by other brands
Thermo Scientific
Thermo Scientific Dionex Integrion HPIC Maintenance Procedure

MMM Group
MMM Group ecocell 22 Instructions for use

Miele
Miele A 312 operating instructions

Millipore
Millipore XX4004700 user guide

primotec
primotec Metalight Mini Installation and operating instruction

Buchi
Buchi Lyovapor L-200 Operation manual