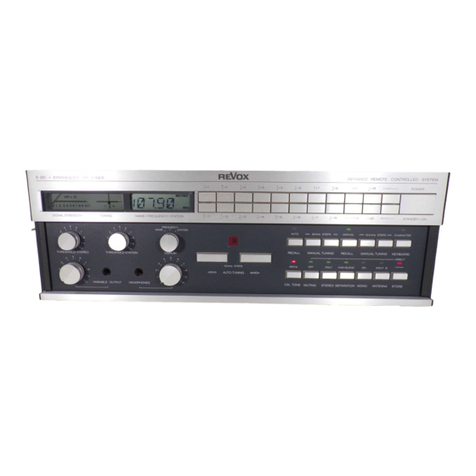
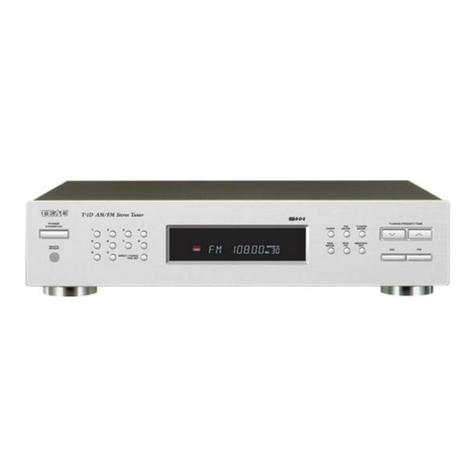
Revox A76 User manual

Service Manual

Service SVSanya
R^OX A7
18 174 572 Printed in Switzerland

Contents Page
1GENERAL 4
2. DISMANTLING 4
2. 1.Removal of front panel 4
2.2. Removal from cabinet 4
2.3. Lacing of dial cord 4
3. CIRCUIT DESCRIPTION 5
3. 1.Operating controls 5
3.2. Schematics 5
3.3. RF input section (front end) 5
3.4. IF-section 6
3.5. Demodulator 6
3.6. Subcarrier re-generation 6
3.7. Multiplex decoder 7
3.8. Indicator circuits 7
3.9. Power supply 8
4. ALIGNMENT INSTRUCTIONS 9
4.1. Test equipment 9
4.2. Additional tools and filters 9
4.3. Checking of supply voltages 10
4.4. Tuning of IF filters 10
4.5. Alignment of center tuning discriminator 1
1
4.6. Checking the selectivity 1
1
4.7. Alignment of RF input section 12
4.8. Alignment of IF amplifier 13
4.9. Checking symmetry of the center tuning meter (44) 13
4.10. Checking for correct limiting 13
2

Page
4.1 1. Sensitivity check on the center tuning (44) and the
signal strength meters (43) 13
4.12. Alignment of FM demodulator 14
4.13. Alignment of multipath indicator 14
4.14. Alignment of subcarrier oscillator (76 kHz) 15
4.15. Alignment of 19 kHz circuit 15
4.16. Alignment of 38 kHz circuit 16
4.17. Tuning of the 19 kHz band pass filter 16
4.18. Alignment of multiplex filter 17
4.19. Adjustment for minimum stereo crosstalk 17
4.20. Checking of automatic mono-stereo changeover 18
4.21 .Checking range of output potmeters 18
5.
INSTRUCTIONS FOR MEASURINGTHE MOST
IMPORTANT PERFORMANCE DATA 19
5.1. Input sensitivity 19
5.2. Static selectivity 19
5.3. Image response 20
5.4. Spurious response 20
5.5. Distortion 21
5.6. Signal to noise ratio 21
5.7. Stereo separation (crosstalk) 21
5.8. Frequency response 22
6.
TECHNICAL DATA 23
7.
SCHEMATICS 25
3

The REVOX A76 FM-Stereo Tuner is apiece of high quality
equipment which passes through aseries of scrupulous tests
during production as well as avery careful final inspection.
Therefore, when servicing this tuner, it is absolutely ne -
cessary to check all vital data in order to ensure that the
original characteristics will be maintained.
Important
When soldering Field Effect (FET )and Radio Frequency
Transistors the following precautions must be observed:
Tuner must be turned off.
Work with earthed soldering iron only.
Provide electrical contact between tip of iron and tuner
chassis.
2. DISMANTLING
2J.
Removal of front panel
—pull rotary knobs from their shafts
—carefully pull off front panel which is held by six snap-on
fasteners
ZZ
Removal from cabinet
—place top side of cabinet onto asoft pad
—undo four chassis mounting screws
—pull chassis from the cabinet
—remove spacerplates (with rubber strips)
—remove upper and lower shielding panel
Z3.1.
Stranded steel-wire
—Take off pulley (1)and orient It so that the hole between
two angled eyelets is in 12 o'clock position.
—Lace large loop of steel wire through left hand eyelet and
wind 11/2 turns of wire onto pulley. Slide pulley onto
shaft and secure it by pushing asuitable rod (round needle
file) through hole In pulley and hole in panel behind.
—Lace wire over guide rollers, along pointer slide and hook
onto removed drive-pulley (2)
—Turn tuning capacitor ccw to stop, slide drive pulley with
slot pointing downwards onto capacitor shaft.
—Turn drive pulley cw to stop. (Allow 1to rotate). In this
position there must be exactly 2turns of steel cord on the
drive pulley.
2.3.2.
Nylon cord
—Find approx, centre of cord and wind 2turns onto drive
shaft (3)
—Take off drive pulley (2) and connect R.H. end of cord.
Put drive pulley back onto cap shaft, slot pointing up-
wards.
—Turn pulley (1)cw to stop and attach nylon cord via
spring (4) to the R.H. eyelet.
—Run dial drive several times back and forth and check for
proper winding of dial cords.
4

39 52 51
46 47 48 49 50
1111/
11111
1i?anr
II |o|aa“DD II coxa lol 1FM 1. 1 1 1 1 i,
LX::ri
/
45 44 43 42 41 40
Fig. 3.1.-1
2.3.3.
Positioning of dial pointer
—Turn drive shaft (3)ccw until it stops with the tuning
capacitor fully closed
—attach pointer slider to steel wire
—with front panel and dial installed, slide pointer to the
left hand end of the horizontal line on the dial (5) .
58 59 57
3. CIRCUIT DESCRIPTION
3.1.
Operating controls
The index numbers on all operating controls are Identical to
those used in the Operating Instructions (see fig. 3. 1.-1 ).
3.2.
Schematics
The following schematics are contained in section 7of this
manual:
3.2.1
Functionally grouped Block diagram
One group function corresponds to one actual circuit board.
3.2.2.
Interconnecting diagram showing all power supply and signal
connections.
Please note:
The circuit of the push-button assembly (G)1.076.291 is
shown on this interconnecting diagram only.
3.2.3.
Complete circuit diagram with signal connections. On this
diagram the switching elements of the push-button assembly
are shown as peripheral circuit elements.
3.3.
RF input section (front end) 1.076.150
(schematic A)
The signal arriving on the 60 ohms or 240 ohms antenna
sockets is fed via abalancing transformer (Baiun )to the tuned
RF-input stage with its FET Q101. Coupling to the mixer
Q102 is achieved through the band-pass formed by LI 04/
LI 05.
The RF signal from the stabilized oscillator Q104 passes
through the buffer stage Q103 and reaches (via the oscillator
5

ARF input section
BIFsection
CDemodulator
DSubcarrier re-generation
EMultiplex decoder
FIndicator circuits
GPushbutton board
HPower supply
transformer L108 )GATE 2of the mixer Q102. The buffer-
stage Q103 serves to prevent interactions between mixer and
oscillator. The IF signal is taken from the balanced output
of L106.
For silent tuning and muting of weak stations (button
"MUTING ON" (49 )depressed )the last IF stage may be
biased into cutoff by the variable trigger (indicating circuits)
whereby the triggering point is adjustable to the desired
signal strength.
3.4.
IF-section 1.076.170
(schematic B)
in order to achieve constant transmission characteristics,
IF-filters and IF-amplification are completely separate
entities. Effective signal selection is concentrated in the
passive filter-section which lies ahead of the IF amplifier and
is therefore entirely independent of signal amplitude or
limiting action.
The filter consists of eight individually tuned parallel re-
sonant L/C circuits and has abandpass characteristic which
approximates the Gaussian probability distribution over
the range of ±120 kHz (fig. 3.4.- 1).
In that range, the envelope delay remains virtually constant
(fig. 3.4.-2 )resulting in excellent performance with regard
to keeping any modulation distortion at aminimum.
The IF-amplifier which follows is made up of five Integrated
Circuits (IC's )each one being aseparate amplifier with a
differential input stage. Limiting in the last IFstage is already
effective at alevel equalling the tuners input noise, there-
fore the audio output signal will remain constant from the
lowest antenna input (1juV )on upward. Figure 3.4.-3
illustrates the audio signal to noise ratios for stereo and
mono operation, starting at the point from where limiting
becomes effective.
Level dependent DC currents are branched off from the
diodes D201, D202 and D203 for signal strength Indication.
By adding those currents apseudologarlthmic Indication
characteristic is achieved which allows evaluation of signal-
strengths ranging from afew microvolts up to approx. 10mV.
For centre tuning indication asignal is taken from the fourth
IF stage and fed to aseparate narrow-band detector
(indicator circuits).
3.5.
Demodulator 1.076. 190
(schematic C)
Demodulation of the frequency modulated signal Is achieved
in adelay-line demodulator. This demodulator Is made up
of adriver stage formed by the differential amplifier with
transistors Q301, Q302 and Q303, two coaxial delay-lines
(with an electrical length equalling X/8 of the intermediate
frequency )as the load impedance and D301/D302 as the
rectifying circuit, in this arrangement FM is being changed
into AM by the frequency dependent impedance of the two
coax line sections, one of which is open whereas the other is
short circuited at the end by capacitor C308.
This delay-line demodulator has abandwidth of 5MHz. This
in connection with the broadband characteristics of the IF-
amplifier (5MHz) results in acapture ratio of 1dB thereby
ensuring excellent common frequency suppression. The
operating principle of the delay-line demodulator makes for
asimple circuit which is free of any critical components and
tuning elements (AM suppression depends entirely on the
limiting characteristics of the IF amplifier).
The multiplex signal is taken off at trimpot P301 (DC-
Balance )and is tripped of its IFcomponents by an RC-net-
work. The output voltage of the demodulator has avalue of
15 mV approx. (at 75 kHz deviation) and is then amplified
to 1Vapprox, by the multiplex amplifier Q304, Q305 and
Q306.
3.6.
Subcarrier re-generation 1.076.210
(schematic D)
The 38 kHz subcarrier is re-generated in aphase locked loop
oscillator. The oscillator together with the differential
6

T(fis)
Fig. 3.4-1
amplifier Q405 and Q406 produces a76 kHz frequency
which, after pulse shaping, passes IC401 operated as a fre-
quency divider at the ratio of 1:2:4. The resulting 38 kHz
(subcarrier) is then used to operate the switching demodula-
tor. The 19 kHz signal from the frequency divider is fed to
the phase comparator Q403/Q404 where it is compared with
the pilot-frequency arriving from the bandpass L401/
L402.
The 15 Hz low-pass filter formed by R409, C408, R410
prevents any interference components in the pilot signal
from reaching the varicap diodes D402 in the 76 kHz oscilla-
tor. This arrangement operates in the manner of anarrow
pilot frequency bandpass with a±15 Hz bandwidth. The bias
voltage for the varicap-diodes is obtained from the Zener-
diode D401.
3.7.
Mulitplex decoder 1.076.220
(schematic E)
The Multiplex-Decoder operates on the switching principle.
Separation of the multiplexed signal takes place in the low-
pass network R508, C504, R509 for the main channel and
in the 38 kHz bandpass L501, C501, R502 for the sub-carrier
or difference channel. Amplification of the sub-carrier takes
place in Q501 whereas Q503 and Q504 operate as the
switching demodulator.
The switching principle was selected because in contrast to
envelope-detection it transposes only those frequencies in
the audible range which are uneven multiples of the sub-
carrier. Thus the lowest critical interference frequencies
occur around 114 kHz and they are effectively suppressed
by the 114 kHz filter L505 -C518 and the 38 kHz band-
pass in the difference channel.
Across the load resistors R518/R519 the signals L-R and
—(L-R )are being formed, with the main signal appearing
in phase across those load resistors. Any residual compo-
nents are suppressed by the in-phase operation of the differen-
tial amplifier Q505 and Q506, which works at the same
time as the matrix by forming the Land Rsignals from the
difference channel and from the main channel, which arrives
from the Q502 amplifier.
8
7
6X
/5\
200 100 kHz UK) 2CK)
1pV 2510 20 50 100 2(K} 5(K) 1mV 25 10
Vanteon
Fig. 3.4-3
Alow pass 15 kHz filter to suppress multiplex residuals is
situated between the impedance matching stages Q507/Q508
and the matrix output. The audio level at the low impedance
outputs is adjustable from 50 mV to 1V, referenced to an
FM deviation of 75 kHz.
3.8.
Indicator circuits 1.076.200
(schematic F)
This portion of the tuner contains the auxiliary circuits for
tuning indication and for various automatic functions.
The IF-signal arriving from the fourth IF stage is amplified
by Q601 and then passed to anarrow band detector whose
small band-width produces the sensitive response of the
"CENTER TUNING" (44) meter.
As already mentioned in aprevious chapter, alevel depen-
dent current for signal strength indication is derived from
the first three IFstages and fed to the "SIGNALSTRENGTH"
meter after amplification in the Q602 amplifier.
The level dependent triggering circuit formed by Q604 and
Q605 delivers agating signal to the base of Q510 in the
stereo decoder for mono-stereo changeover and also biases
the last IF stage for noise squelch and silent tuning. By de-
pressing the button "TRIGGER LEVEL VARIATION" (48)
R702 in the collector leg of Q602, which normally provides
maximum sensitivity, is replaced by the potentiometer
"TRIGGER LEVEL" (39 ). This allows awide variation of
the triggering point with consequent muting even of rather
powerful stations. With the button "MUTING ON" (49
)
released, the triggering circuit will respond for automatic
mono-stereo changeover only.
In the multiplex decoder the circuit formed by 0510/051
1
and 0512 analyses whether or not the following conditions
are met for automatic changeover to stereo operation:
1. signal from the level dependent trigger (input base 0510)
2. presence of apilot signal. (This signal is derived from the
band-pass in the sub-carrier regenerating module. It is
amplified by 0509 and then rectified by the diode D502).
7

3. mono-stereo switch "STEREO AUTOMATIC" (47) de-
pressed (thus allowing asignal to reach the base of 051 1).
With all three conditions satisfied, 0512 becomes conductive
and the difference channel amplifier 0501 begins to operate.
With the switching of 0512 the stereo indicator "STEREO"
(output EG 1)will also receive current.
For multipath indication "MULTIPATH" (42) the multiplex
signal is being fed to the monostable trigger 0608/0607 and
signal is fed to the monostable trigger 0608/0607 and
receiving direct and reflected signals, will trigger that cir-
cuit Into the conductive mode, thereby causing the light
bulb "MULTIPATH" to become Illuminated (button "MUL-
TIPATH INDICATOR" (50) depressed).
3.a
Power supply 1.076.130
(schematic H) 1.076.140
The power supply consists of two electronically regulated
sections for —23 Vand +23 V. Zener diodes stabilize the
supply voltages —6.2 Vand +6.2 Vwhich feed the integrated
circuits in the IF amplifier auxiliary circuits.
*Modifications MK II *
Tuners of the MK II version have the function MULTIPATH
INDICATOR replaced by the button labeled STEREO FIL-
TER (50 ). Therefore the circuit of the indicator light
MULTIPATH can no longer be switched off.
With button STEREO FILTER, the signal to noise ratio of
week or distant stereo stations can be improved. This is
being achieved by reducing the bandwidth of the 38 kHz re-
sonant circuit L501/C501 (raising the Qby disconnecting
the 8.2 kohm resistor). The narrow bandwidth of the 38 kHz
filter results in areduced stereo base; stereo crosstalk drops
to 10 dB at 1kHz.
8

tFmatching network
]Test generator |(for IF filter measurements)
“1coaxial Push-on terminal
BNC cable RG 58 54.02.0327
^Q_ O™
I
lOn max. 350 mm
4,7 k
alligator clip
—23 V(blu) from distribution board
(not required with the RF input section 1,076.150)
Fig. 4Z-1 38 kHz bandpass
(for subcarrier minimum adjustment)
15 kHz lowpass filter
(for AF measureme ts
f=15 kHz: attenuation ma .0.2 dB
f>19 kHz: attenuat'on >45 dB
Input 4,7 k53mH 34,4 mH 37,7 mH Output
0348 n
Fig. 4.2.-3
1,41 n<
,<
<
<
>4,7 k
>
1,77 n
Tuner 60 H
Fig. 4.Z-2 Fig. 4.Z-4
4, ALIGNMENT INSTRUCTIONS
4.1.
Test equipment
For correct alignment the following test equipment (or
equivalents) will be required:
Stereo test generator Rohde &Schwarz type SMSF BN
41410, range 87 to 108 MHz and 10.2 to 11.2 MHz
Stereo modulator Philips PM 6450
Audio generator low distortion type (THD less than 0.05 %)
Digital counter (for 38 kHz)
Oscilloscope (with internal and external triggering) including
RF probe 10:1
DC transistor or vacuum tube voltmeter (VTVM )including
RF probe
Multimeter for supply voltages
Distortion analyser (or audio millivoltmeter with suitable
filters)
Note:
The signal voltage indicated for the stereo test generator is
an open circuit voltage (o.c.v. ). If the internal impedance of
the test generator equals 60 ohms, avoltage of exactly 1/2 of
the test generator's open circuit voltage will result accross the
60 ohm input of the tuner (see fig. 4.2.-4).
When working with test generators whose output calibration
is already taking into account the nominal load Impedance
of the equipment under test, the generator's output is to be
set to one half of the Indicated open circuit voltage.
The predominantly used test frequency of 94 MHz is to be
taken as aguide only. Prior to starting any alignment proce-
dures, It should be checked whether or not that frequency
does not produce an interference with aneighbouring FM
transmitter. (This should be checked with the test generator
connected to the tuner, but with the signal turned off ). If
an FM broadcast can still be received, the test frequency
should be altered slightly.
The stereo test generator is to be connected to the 60 ohm
antenna input for all tests (except for the tuning steps 4.4
to 4.6 which require the test frequency to be fed via the IF
matching network).
4.Z
Additional tools and filters All readings are to be taken against chassis.
One set of cables (coaxial cable RG 58)
One set of tuning tools
The following filters and matching networks are required for
IFmeasurements, subcarrier minimum adjustment and audio
frequency measurements. The construction of these circuits
is not critical.
IF matching network fig. 4.2.-1 (for measurements on the
IF filters)
38 kHz bandpass fig. 4.2.-2 (for subcarrier minimum ad-
justment)
15 kHz lowpass filter fig. 4.Z-3 (for audiofrequency mea-
surements)
9

Fig. 43.-1 Fig. 4.4-2
It is absolutely essential to check the supply voltages before
attempting any alignment of the tuner.
43.
Checking of supply voltages
Tuner switched on (power switch only, no other button de-
pressed); voltage readings against chassis.
Current consumption on 220 Vline: 65 mA
red: +23 V(+ 1/—0V) 1Ripple voltage less than
blu: -23 V(+0 /-I V) |1 mV
org: +6.2 V(+ 0.5/-0.2 V)
grn: -6.2 V(+ 0.2/-0.5 V)
vio: +4V(+0.8/-0.5 V)
C134 (V2))
C125 (V1)j -15 V(±0,8 V)
44.
Tuning of IF filters
Important: All tuning slugs are to be positioned so as to pro-
duce amaximum when turned to their upper setting. (see
fig. 44.-1
)
correct
incorrect
Test equipment
Test generator frequency 10.7 MHz (+20 kHz ), 63 mV
o.c.v. no modulation
IF matching network (see fig. 4.2.-1
)
VTVM wit RF probe, range to read 0.9 V(+0.2/—0.1 V)
4.4.1. Tuner:
power switch depressed
4.4.2.
Remove spade lug AB 1(test point 1)and connect IF
matching network. (On tuners with the new RF section
1.076.160-1 the —23 Vconnection is not required).
44.3.
Connect RF probe of VTVM to testpoint 2(see fig. 4.4.-2
)
44.4.
Adjust slugs of the IF filters FT 201 to FT 208 to obtain
an exact maximum voltage reading on the VTVM. This tuning
procedure must be repeated until no improvement can be
achieved any more.
4.4.5.
Immediately following upon the tuning of the IF filters,
the centre tuning discriminator must be aligned as described
under section 4.5 (any frequency drift of the test generator
would lead to an erroneous adjustment).
Important: do not alter the frequency setting of the test
generator.
10

VTVM
Fig. 4.5.-1 Fig. 4.6.-1
4.5.
Alignment of center tuning discriminator
(narrow band discriminator)
Important: The centre tuning discriminator FT 601 must be
aligned immediately following the tuning of the IF filters
(any frequency drift of the test generator would lead to an
erroneous adjustment).
Test equipment:
Test generator, frequency 10.7 MHz (±20 kHz )63 mV
o.c.v. no modulation.
IF matching network (see fig. 4.2.-!
)
VTVM without RF probe, range to read DC +8V(+ 1V/
-2 V)
4.5.1. Tuner:
Power switch depressed.
4.5.2.
IF matching network remains connected to test point 1(see
fig. 4.4.2.)
4.5.3.
Connect aresistor of 1Mohm directly to test point 3(see
fig. 4. 5.-1 )and connect VTVM to that resistor
4.5.4.
Turn slug of secondary winding of discriminator FT 601
almost completely up (see fig. 4.5.-1
)
4.5.5.
Adjust primary circuit by finding amaximum with the
tuning slug in its upper position as described under 4.4. The
voltage reading thus obtained should be from 6to 9V.
4.5.6.
Adjust slug of secondary coil until obtaining azero indication
on the centre tuning meter (44)
4.6.
Checking the selectivity
A. Bandwidth
Test equipment:
Test generator, frequency 10.7 MHz (±20 kHz )63 mV
o.c.v. no modulation
IF matching network (see fig. 4.2.-1
)
VTVM with RF probe, range to read 1V
4.6.1. Tuner:
power switch depressed
4.6.2.
IF matching network remains connected to test point 1(see
fig. 4.4.2.)
4.6.3.
Connect RF probe of VTVM to test point 2(see 4.4.3. and
fig. 4.4.-2.)
4.6.4.
Adjust output level of test generator to obtain areading of
1Von the VTVM
46.5.
Ater the frequency of the test generator by ±65 kHz; this
must reduce the VTVM reading to 0.7 V(—3dB)
B. Static selectivity
To measure the static selectivity, atest generator is required
whose open circuit output voltage can be attenuated to less
than 1/xV.
4.6.6.
Connect RF probe of VTVM to test point 4(see fig. 4.6.-1
)
4.6.7.
Adjust output voltage of test generator to its minimum
(less than 1fiV) and increase gradually until areading of 1V
is obtained on the VTVM. During this test, no limiting must
occur in 1C 204. This can be checked by slightly increasing
11

VTVM
Fig. 4.7.-1 Fig. 4.7.-2
the send level of the test generator which must cause a
corresponding rise of the signal as indicated on the VTVM.
4.6.8.
Note the value of the output level as read on the test ge-
nerator
46.9.
Alter the frequency of the test generator by ±300 kHz
while increasing the output level from the test generator by
60 dB
During this test, the signal as indicated on the VTVM must
remain below 1V(static selection 60 dB)
4.7.
Alignment of RF input section
Test equipment:
Test generator, frequency 90 MHz, 0.2 mV o.c.v. no mo-
dulation
VTVM with RF probe, range to read 0.9 V
4.7.1. Tuner:
power switch depressed
4.7.2.
Checking of dial and pointer. Run pointer from one extreme
end of dial to the other and check whether or not pointer
travels the full length of the dial.
4.7.3.
Connect RF probe of VTVM to test point 5(see fig. 4.7.-1
)
4.7.4.
Connect test generator to the tuner's 60 ohm input (BNC/59
)
4.7.5.
Turn pointer exactly to 90 MHz mark on the dial.
4.7.6.
Adjust oscillator slug LI 07 until azero indication is obtained
on the centre tuning meter (44). This adjustment is carried
out from the soldered side of the print (see fig. 4.7.-2 )
4.7.7.
Adjust coils LI 03/Ll 04 and L105 of the tuned RF stages to
obtain amaximum reading (adjustment from soldered side,
see fig. 4.7.-2)
VTVM reading for tuned RF input section: 0.9 V(+0.5/
-0.2 V)
4.7.8.
Set test generator to the frequency of 106 MHz. Move pointer
exactly to the 106 MHz mark on the dial.
4.7.9.
Adjust oscillator trimmer Cl 19 to obtain zero indication on
the centre tuning meter (44). (This adjustment is carried out
from the soldered side, see fig. 4.7.-2)
4.7.10.
Adjust trimmer capacitors Cl 03, Cl 09 and Cl 10 in the
tuned RF input stages to obtain amaximum reading. (Solde-
red side, see fig. 4.7.-2)
VTVM reading for tuned RF input section: 0.9 V(+0.5/
-0.2 V)
4.7.11.
Repeat alignment procedures 4.7.5. to 4.7.7. and 4.7.8. to
4.7.10. until no further Improvement can be observed.
4.7.12
Adjust coil LI 06 to obtain maximum reading (at 90 MHz or
106 MHz).
(This adjustment is to be carried out from the component
side of the print, see fig. 4.7.-3)
4.7.13.
Adjustment of oscillator transformer LI 08:
Connect RF probe of VTVM to test point 12, meter range
to read 1V(see fig. 4.7.3.
)
Set pointer to the 100 MHz mark on the dial.
Adjust oscillator transformer LI 08 to obtain maximum
reading. VTVM reading: 0.7 V(± 0.1 V)
Check to make sure that an identical signal drop of 2dB
occurs on both ends of the dial.
12

VTVM
L106 VTVM
Fig. 4.7.-3
4.8=
Alignment of IF amplifier
(Adjustment of transformer coupling. For alignment in-
structions pertaining to the IFfilters, see 4.4.)
Test equipment:
Test generator, frequency 94 MHz, 2juV o.c.v. no mo-
dulation
VTVM with RF probe, range to read 0.5 Vapprox.
4.8.1. Tuner:
Power switch depressed
Move pointer to the 94 MHz mark and tune to obtain exact
zero indication on the centre tuning meter (44).
4.8.2.
Connect RF probe of VTVM to test point 6(see fig. 4.8.-1.)
4.8.3.
Connect test generator to the tuner's 60 ohm input (BNC/59
)
4.8.4.
Adjust IF transformers L201 to L204 to obtain maximum
reading (VTVM reading 0.5 Vapprox. ). During this test, no
limiting must take place in 1C 204. (This can be checked by
slightly increasing the output level of the test generator
which must cause acorresponding rise of the signal as indi-
cated on the VTVM. If limiting does occur the output level
of the test generator must be reduced).
4.9.
Checking symmetry of the center tuning meter (44)
Optimal pointer deviation
—am
0
11
maximum
permissible correction
Fig. 4.9.-1
Fig. 4.8.-1
4.9.1.
Use same test generator setting as under 4.8.
4.9.2.
Turn tuning knob (40 )slowly cw and ccw to detune while
observing the pointer for symmetrical movement (see fig.
4.9.
-1
)
4.9.3.
Asymmetry error not exceeding one quarter of the width
of the "zero zone" is to be corrected with the secondary slug
of the center tuning discriminator FT 601. See section 4.5.6.
and fig. 4.5.-1.
4.10.
Checking for correct limiting
(IF amplifier)
4.10.1.
Use same test generator settings as under 4.8.
4.10.2.
RF probe of VTVM remains connected to test point 6(see
section 4.8.2.
)
4.10.3.
Increase output level of test generator gradually. When raising
the output level above 4piV o.c.v., the voltage level as indica-
ted by the VTVM must not increase any more. (Limiting
taking effect).
4.11.
Sensitivity check on the center tuning (44 )and the signal
strength meters (43)
4.11.1.
Increase output level of the test generator to 10 mV (no
modulation)
4.11.2.
When running the tuning control (40) through its full range
with this signal present at the tuner's input, the following
meter indications must be obtained:
Center tuning (44) from ±2to end of scale
Signal strenght (43) from 5to end of scale
13

L205 P301
Fig. 412.-1 Fig. 413.-1
412.
Alignment of FM demodulator
Test equipment:
Test generator frequency 94 MHz, 2mV o.c.v. modulated
with stereo modulator, deviation 75 kHz, modulating fre-
quency 1kHz (L=R), no pilot frequency.
1kHz (L=R)no pilot frequency
15 kHz low pass filter (see fig. 4.2.-3)
Distortion analyser
VTVM without RF probe, DC range
412.1.
Power switch depressed, tuning pointer set to the 94 MHz
mark; fine tune to obtain zero indication on the center
tuning meter (44 )set the audio output controls (55) to
their maximum setting (fully clockwise)
412.2.
Connect 15 kHz low pass filter between the tuner's audio
output (56) and distortion analyser.
412.3.
Measure audio output voltage with the distortion analyser.
With the demodulator aligned, the audio output voltage
reads: 0.5 V(±0.1 V). Maximum permissible level difference
between the two audio outputs: 0.5 dB.
4.12.4.
Calibrate distortion analyser to 100 percent, measure dis-
tortion.
Adjust IF transformer L205 to obtain minimum di tortlon
(see fig. 412.-1 ). The maximum total harmon cd' tortion
with the demodulator aligned must not exceed 0.3 %.
412 5
*CH r;aresis or of 1Mohm to test point 7(see fig.4 12 -1 );
connect VTVM (DC) to that resistor.
4.12.6
Adjust symmetry potentiometer P301 (see fig. 4.12. 1)to
obtain anull indication on the VTVM.
4.12.7.
Repeat alignment steps 4.12.3. to 4.12.6. until no further
improvement can be reached.
413.
Alignment of multipath indicator
Test equipment:
Test generator, frequency 94 MHz, 2mV o.c.v. modulated
with stereo modulator, deviation 82.5 kHz, modulating
frequency 1kHz (L= R), no pilot frequency.
4.13.1. Tuner:
Power switch depressed, button MULTIPATH INDICATOR
depressed (Tuners of the MK II variety are not equipped
with the button MULTIPATH INDICATOR)
Set dial pointer to 94 MHz mark; fine tune to obtain zero
indication on the center tuning meter (44).
4.13.2.
Adjust trim potentiometer P601 (see fig. 4.13.- 1)until the
light bulb MULTIPATH (42) becomes Illuminated; then turn
back P601 to the point where the light just goes off.
14

Fig. 4J4.-1 Fig. 4.15.-1
4J4. 4.15.
Alignment of subcarrier oscillator (76 kHz) Alignment of 19 kHz circuit
Test equipment: Test equipment:
Test generator, frequency 94 MHz, 2mV o.c.v., no modula-
tion, no pilot signal
Digital counter for afrequency of 38 kHz, range approx.
1Vpp.
4.14.1. Tuner:
Power switch depressed,
set dial pointer to the 94 MHz mark; fine tune to obtain zero
indication on the center tuning meter (44)
4.14.2.
Connect digital counter to test point 8(see fig. 4. 14.-1 )
4.14.3.
Tune 76 kHz oscillator coil L403 (see fig. 4. 14.-1 ). Since the
squarewave frequency is being measured after the 1C divider
(1:2), this adjustment must aim for afrequency of
38 kHz ±25 Hz)
Test generator, frequency 94 MHz, 2mV o.c.v., modulated
with stereo modulator 9%pilot carrier only (6.75 kHz
)
VTVM AC range to read 3.5 V(+0.5/-0.5 V).
4.15.1. Tuner:
Power switch depressed,
button STEREO AUTOMATIC (47) depressed
Set dial pointer to the 94 MHz mark; fine tune to obtain
zero indication on the center tuning meter (44)
4.15.2.
Connect VTVM to test point 9(see fig. 4.15.-1
)
4.15.3.
Adjust L504 of the 19 kHz circuit to obtain amaximum,
VTVM reading 3.5 V(+ 0.5/-0.5 V)
4.15.4.
Check to see if light bulb STEREO (45) is illuminated.
4.15.5.
Turn off pilot carrier, check STEREO indicator light is now
off.
Test operation of STEREO indicator lamp which must come
on again with 6%pilot carrier (deviation 4.5 kHz)

L402
Fig. 4. 16.-1
4Ja
Alignment of 38 kHz circuit
Test equipment;
Test generator, frequency 94 MHz, 2mV o.c.v., modulated
with stereo-modulator, 75 kHz deviation, modulating fre-
quency 1kHz, left channel only, no pilot frequency.
Cathode- Ray Oscilloscope with attenuator 10 :1, external
triggering (1kHz ), Y-amplifier, AC sensitivity 0.02 V/cm
time base 50 jusec/cm
4.16.1. Tuner:
power switch depressed
set dial pointer to 94 MHz mark; fine tune to obtain zero
indication on the CENTRE TUNING meter (44).
4.16.2.
Connect attenuator to test point 10(see fig. 4. 16.-1
)
4.16.3.
Tune L501 of the 38 kHz circuit (fig. 4. 16.-1 )to obtain a
precise envelope crossover as shown in fig. 4. 16.-2.
Fig. 4.1 7.-1
4.17.
Tuning of the 19 kHz band pass filter
Test equipment:
Test generator, frequency 94 MHz, 2mV o.c.v., modulated
with stereo-modulator, 75 kHz deviation, modulating fre-
quency 1kHz, left channel only, pilot carrier 9%(6.75 kHz
deviation)
Cathode- Ray Oscilloscope with attenuator 10:1, Internal
triggering, Y-amplifier, AC sensitivity 0.05 V/cm, timebase
2jusec/cm
4.17.1. Tuner:
power switch depressed
Button STEREO AUTOMATIC (47 )depressed, set dial
pointer to 94 MHz mark; fine tune to obtain zero indication
on CENTRE TUNING meter (44).
4.17.2.
connect attenuator to test point 11(see fig. 4.17.-1 ).
4.17.3.
Adjust 19 kHz bandpass L401 and L402 (see fig. 4. 17.-1 )
until the envelope crossover coincides with the leading edge
of the matrix switching frequency (see fig. 4. 17.-2 ). Both
tuning slugs should then be at approx, the same height.
correct
incorrect correct incorrect
Fig. 4. 16.-2 Fig. 4. 17.-2
16

Fig. 4. 18.-1
4Ja
Alignment of multiplex filter
Test equipment:
Test generator, frequency 94 MHz, 2mV o.c.v., modulated
with stereo-modulator, 9%pilot carrier only (6.75 kHz
deviation
)
distortion analyzer or VTVM
38 kHz band pass (see fig. 4.2.-2)
4.18.1. Tuner:
power switch depressed
button STEREO AUTOMATIC (47) depressed
Audio output controls (55 )at maximum (fully cw ), set
dial pointer to 94 MHz mark; fine tune to obtain zero indi-
cation on CENTRE TUNING meter (44).
4.18.2.
Connect 38 kHz band pass between tuner output (56,
channel 1or channel 2respectively) and distortion analyzer
or VTVM.
4.18.3.
Adjust multiplex-filters L503 and L502 (for channels 1and
2respectively) to obtain aminimum of MPX-sIgnal (less than
1.5 mV) (see fig. 4. 18.-1 ).
Fig. 4.19.-1
4.19.
Adjustment for minimum stereo crosstalk
Test equipment:
Test generator, frequency 94 MHz, 2mV o.c.v., modulated
with stereo-modulator, deviation 40 kHz, modulating fre-
quency 1kHz (L=R), pilot carrier 9%(deviation 6.75 kHz
)
distortion analyzer or VTVM
15 kHz low pass filter (see fig. 4.2.-3)
4.19.1. Tuner:
Power switch depressed
Button STEREO AUTOMATIC (47) depressed
Audio output controls (55) at maximum (fully cw), set dial
pointer to 94 MHz mark; fine tune to obtain zero indication
on the CENTRE TUNING meter (44).
4.19.2.
Connect 15 kHz low-pass between tuner output (56, channel
1or channel 2respectively )and distortion analyzer or
VTVM.
4.19.3.
Calibrate distortion analyzer (or VTVM) for 0dB reference
deflection.
4.19.4.
Turn off modulation on channel 1;measure crosstalk on
channel 2and adjust with trimpot P501 for minimum reading
(see fig. 4. 19.-1
)
The crosstalk figure must exceed 40 dB.
4.19.5.
Turn on modulation on channel 1and turn off modulation
on channel 2; measure crosstalk from channel 1(value
obtained must be better than 40 dB).
17

420.
Checking of automatic mono-stereo changeover
(level-dependent)
Test equipment:
Test generator frequency 94 MHz o.c.v. variable from 2to
20 juV, modulated with stereo modulate ,deviation 40 kHz,
modulating fequency 1kHz (L=R), pilot carrier 9%
(deviation 6.75 kHz).
4.20.1. Tune :
Power switch depr essed
Buttons STEREO AUTOMATIC (47) and MUTING ON
(49 )depressed, set dial pointer to 94 MHz mark; fine tune
to obtain zero indication on the CENTRE TUN NG meter
(44 ).
4.20.2.
Reduce generator output level gradually from 20 /zV o.c.v.
while observing the STEREO (45) indicator light, and also
monitoring the audio output.
Check generator level at which the STEREO indicator light
goes off and the audio output disappears.
The circui swork satisfactorily when swi ching occurs while
lowering the generator level down th ough 15 /uV o.c.v.
4.20.3.
Depress button TRIGGER LEVEL VAR (48) and raise send
level to 100 'Vo.c.v. Slowly rotate the TRIGGER LEVEL
(39
)
control until reception again returns to mono, or until
the audio ou put ceases.
The automatic changeover circuit works satisfactorily when
triggering occurs at position 5of the control.
4,21 .
Checking range of output potmeters
Test equipment:
Test generator, frequency 94 MHz, 2mV oc.v., modulated
wth stereo- modulator, 40 kHz deviat’on, modulating fre-
q*ency 1kHz (L=R), plot carrier 9%(6.75 kHz de-
viation).
15 kHz low-pass filter (see fig 4.2 -3).
4.21.1. Tuner:
Power sw tch depressed
Button STEREO AUTOMATIC (47 )depressed, set dial
pointer to 94 MHz mark; fine tune to obtain zero indication
on CENTRE TUNING mete (44).
421.2.
Connect 15 kHz low-pass fIter between tuner output (56,
channel Ior channel II respectively) and distortion analyzer
or audio millivoltmeter.
4.21.3.
Calibrate distort on analyzer (or millivoltmeter )to obtain
reference deflection.
4.21.4.
Turn output-potmeters (56 )of channel Iand channel II
fully counter clock wise and measure output level.
Both controls are functioning properly when att nuating the
signal by 26 dB.
18

5INSTRUCTIONS FOR MEASURING
THE MOST IMPORTANT PERFORMANCE
DATA
For any of the following measurements all metal shields must
be installed on their proper places (Shield on rf-input
section, plus the large cover plates on top and bottom of the
tuner).
The output voltage of the test generator is stated in open
circuit voltage (o.c.v. ). If the internal (source) Impedance of
the test generator is 60 ohms, then the voltage developed
across the tuners 60 ohm input will be exactly one half of
the generators o.c.v. (see iig. 4.2.-4).
Test generators which are calibrated to indicate the signal
voltage across the nominal terminating impedance have to
to be set to one half of the prescribed o.c.v. value.
The predominantly used test frequency of 94 MHz is to be
taken as aguide only. Prior to starting any alignment pro-
cedures, \i should be checked whether or not that frequency
does not produce an interfe ence with aneighbouring FM
transm tter. (This should be checked with the test generator
connected to the tuner, but with the sgnal turned off ). If
an FM boadcast can still be received, the test frequency of
94 MHz (or 87.5 MHz) should be altered slightly.
For all measurements:
Connect 15 kHz low-pass filter between tuner output (56,
channel Ior channel II respectively) and distortion analyzer
or audio-millivoltmeter.
5.1.
Input sensitivity
Test equipment:
Test generator, frequency 94 MHz, 2/iV o.c.v., modulated
with stereo modulator, 15 kHz deviation, modulating fre-
quency 1kHz (L=R) pilot carrier 9%(6.75 kHz deviation ).
Distortion analyzer or audio millivoltmeter.
5.1.1. Tuner:
Power switch depressed
Button STEREO AUTOMATIC (47
)
depressed. Adjust ge-
nerator frequency until a zero reading is obtained on the
CENTRE TUNING meter (44) (approx. 94 MHz).
5.1.2.
Calibrate distortion analyzer (or audio millivoltmeter )to
obtain areference reading.
5.1.3.
Turn off modulation to measure signal to noise ratio. The
tuners sensitivity is within specifications when obtaining a
ratio of 30 dB in the mono-mode.
(The input signal of 2/xV o.c.v. must not trigger the auto-
matic mono-stereo changeover).
5.1.4.
Raise o.c.v. level from the test generator to 20 juV o.c.v. and
measure signal to noise ratio. The tuners sensitivity \s within
specifications if aratio of 30 dB or more is obtained in
the stereo-mode. (The input signal of 20 mV o.c.v. must be
sufficient to effect positive triggering of the automat-c mono-
stereo changeover
)
5.2.
Measuring static selectivity
See 4.6.6. to 4.6.7.
19
Other manuals for A76
3
Table of contents
Other Revox Tuner manuals