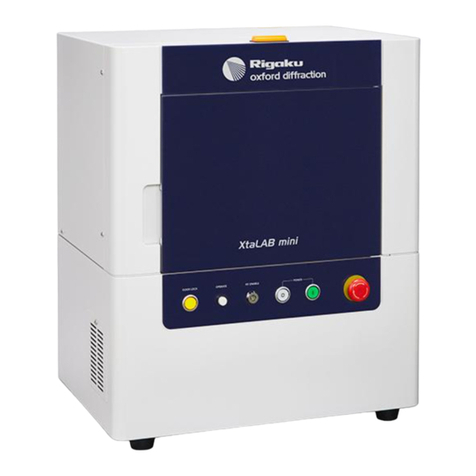
Rigaku R-XAS User manual

Cat.No. 2170L101/L102
R-XAS Looper
Instruction Manual
Manual No. ME12044A02

Thank you for your purchase of Rigaku’s product.
This manual describes the correct use of the product as well the usage precautions to be observed. To
obtain full-expected performance from the product, thoroughly read this manual.
Also, store this manual at an easily accessible place so that you can promptly refer to it whenever
it is necessary.
NOTICE
1. This manual described in it may not be disclosed to a third party or copied, in whole or in part,
without the written consent of Rigaku.
2. As a rule, one set of the instruction manual has to be purchased for each product.
3. If there are any missing or incorrectly collated pages in the delivered instruction manual,
contact the nearest Rigaku branch office or sales office for instruction manual replacement.
4. In no event will Rigaku be responsible for the results of the use of this manual.
5. The contents of this manual are subject to change without prior notice.

ME12044A−i
Contents
1. OVERVIEW.................................................................................................................................. 1
2. PRINCIPLE OF MEASUREMENT............................................................................................ 2
3. CONFIGURATION...................................................................................................................... 3
4. SPECIFICATIONS....................................................................................................................... 5
4.1 Goniometer Section...................................................................................................................5
4.2 Counter and Electronic Circuit Section .......................................................................................5
5. INSTALLATION.......................................................................................................................... 6
5.1 Preparations for Adjustment......................................................................................................6
5.2 Adjustment of Optical Axes.......................................................................................................8
5.2.1 Setup of the divergence slit (DS).....................................................................................8
5.2.2 Model with a direct-beam monitor ...................................................................................8
5.2.3 Model without a direct-beam monitor...............................................................................9
6. MEASUREMENT...................................................................................................................... 10
6.1 Preparations for Measurement.................................................................................................10
6.2 Adjustment of the Monochromator...........................................................................................10
6.3 Adjustment of the Detector .....................................................................................................10
6.4 Measurement .........................................................................................................................10
6.5 Example of Measurement........................................................................................................11
6.5.1 Installing the analyzing crystal.......................................................................................11
6.5.2 Moving the goniometer .................................................................................................11
6.5.3 Setting the detector provisionally....................................................................................12
6.5.4 Setting the slits.............................................................................................................12
6.5.5 Adjusting the monochromator........................................................................................13
6.5.6 Adjusting the detector...................................................................................................16
6.5.7 Measurement...............................................................................................................18
6.6 Switching the Measurement Mode ...........................................................................................19
7. WARRANTY.............................................................................................................................. 22
8. WARNINGS................................................................................................................................ 23
9. MAINTENANCE AND SAFETY............................................................................................... 24
10. TROUBLESHOOTING............................................................................................................. 25
11. WHEN A SIX-SAMPLE CHANGER IS IN USE (OPTIONAL ITEM).................................... 26
11.1 General..................................................................................................................................26
11.2 Configuration..........................................................................................................................26
11.3 Operating Method...................................................................................................................27
11.3.1 Mounting the sample holders.........................................................................................27
11.3.2 Mounting the turret.......................................................................................................27
11.3.3 Installing the sample changer in the equipment and connecting it......................................27
11.4 Software Operation.................................................................................................................28
11.4.1 Setup...........................................................................................................................28
11.4.2 Operation.....................................................................................................................28
11.4.3 Measurement conditions ...............................................................................................29
11.4.4 Set-reset Mode Measurement.......................................................................................30

ME12044A−ii
First Edition: May 27, 2003
Second Edition: May 27, 2003

−1−
ME12044A
1. OVERVIEW
Each of the elements contained in a material has X-ray absorption edges of specific energies. When the
absorption coefficient is precisely measured near and beyond the absorption edges, a oscillatoryvibration
of the X-ray absorption as a function of photon energy is observed. This is the X-ray Absorption Fine
Structure (XAFS), which can be further divided into an X-ray Absorption Near-Edge Structure (XANES)
observed near the absorption edge,and an Extended X-ray Absorption Fine Structure (EXAFS) observed
along approximately 1 keV on the higher-energy side above the edge. While information on the valence
state of an atom is obtained from the XANES spectrum, analysis of the EXAFS spectrum provides
information on the local structure. The R-XAS Looper is the equipment developed for the measurement of
XAFS spectrum in a laboratory.
Figure 1.1General View of the System (D010524A01)

−2−
ME12044A
2. PRINCIPLE OF MEASUREMENT
In XAFS measurement, an absorption coefficient is measured accurately by varying the energy of X-rays
irradiated onto the sample. Because a highly monochromatic X-ray (∆E < 10 eV) is required, it is
necessary to perform crystal spectrometry. However, the ordinary spectrometry using a plane crystal can
utilize only a small divergent angle, and therefore the intensity of the X-rays that can be used remains low,
which would increase the time required for measurement. For this reason, the R-XAS Looper adopts an
optical system that performs spectrometry and collection simultaneously using a Johann-type or
Johannson-type curved crystal. In Figure 2.1, S is an X-ray source, A the center of the monochromator
crystal, and F a receiving slit. These three points are arranged on the Rowland circle with radius R, in such
a manner that the relation SA = AF will be satisfied. The energy of the X-rays is varied by controlling that
distance.
The monochromatic X-rays selected in this way are irradiated onto the sample, thereby measuring the
intensity of the X-rays transmitted through the sample. By determining the ratio between that X-ray
intensity and that of the incident X-rays, the absorption coefficient can be measured.
R
O
θ
θ
L
L
F
S
Ax
y
B
Figure 2.1Principle of the Focusing Optical System

−3−
ME12044A
3. CONFIGURATION
The R-XAS Looper is composed of two sections: the spectrometer section,which selects monochromatic
X-rays by applying spectrometry to the continuous X-rays emitted from an X-ray generator, and the
sample section, in which the intensity of X-rays transmitting through the sample (or emitted from the
sample) is measured and the intensity of incident X-rays is monitored at the same time. The left-hand part
of the illustration in Figure 3.1 represents the spectrometer section, while the smaller chamber on the right
side is the sample section.
Figure 3.1View with the Cover Opened (D010524A02)
The spectrometer section is consisted an X-ray generator, spectrometer (goniometer), divergence slit,
receiving slit, and monochromator (Figure 3.2). The X-ray generator is a fixed-target tube of 3 kW. The
spectrometer adopts the so-called “Linear spectrometer”method, which employs stepping motors to exert
control such that the distance from the X-ray source to the monochromator crystal and the distance from
the monochromator crystal to the receiving slit remain equal, thereby allowing X-rays of any desired
energy level can be selected. The divergence slit (DS) and the receiving slit (RS) are variable slits driven
by stepping motors, with their width controlled from a computer. The monochromator is provided with the
three axes, namely of ω, tilt, and Z. A Johann-or Johannson-type monochromator crystal with a Rowland
circle radius of 320 mm is mounted on the monochromator, which is then controlled from a computer.

−4−
ME12044A
(D010524A03) (D010524A04)
Figure 3.2Spectrometer Section and Detection Section
The intensity monitor (I0-detector) for incident X-rays consists of a semi-transmission-type proportional
counter with Be window on both side, and provides linearity of up to 1 million cps through combined use
with a high-speed electronic circuit. On the other hand, the intensity monitor (I-detector) for X-rays
transmitted through the sample employs a high-speed scintillation counter, and is capable of counting
X-rays with a high degree of detection efficiency over a broad range of energy levels.
XG
Shutter
Monochromator
Receiving slit
Proportional counter
Sample
Scintillation counter

−5−
ME12044A
4. SPECIFICATIONS
4.1 Goniometer Section
(1) Spectrometer section
(a) Optical system :Curved-crystal spectrometer system
(b) Rowland circle radius :320 mm
(c) Scanning method :Biaxial link pulse-motor driven
(d) Scanning range :2θ= 30°to 90°
(2) Monochromator section
Movable range (Min. step) :ω-axis ±3°(1/1000°)
tilt-axis ±3°(1/1000°)
Z-axis ±3 mm (1/100 mm)
(3) Slit section
Movable range (Min. step) :Divergence slit: 0 to 8 mm (1/100 mm)
Receiving slit: 0 to 8 mm (1/100 mm)
4.2 Counter and Electronic Circuit Section
(1) Proportional counter (S-PC)
I0(Incident X-ray intensity) detection
(a) Amplifier :Fixed gain
(b) High-voltage power supply and pulse-height analyzer (HV/PHA)
(i) Lower level :0 to 5 V
(ii) Upper level :0 to 5 V
(iii) Output voltage :0 to 1500 V
(c) Filled gases
Ne :For the low-energy region (5 to 7 keV)
Ar :For the medium-energy region (6 to 15 keV)
Xe :For the high-energy region (Over 15 keV)
(2) Scintillation counter (SC)
For measurement of transmission X-rays and florescence (common use)
:Diameter: 1.5 inches
(a) Amplifier :Fixed gain
(b) Pulse-height analyzer (PHA)
(i) Lower level :0 to 5 V
(ii) Upper level :0 to 5 V
(c) High-voltage power supply for detectors
Output voltage :0 to 1500 V

−6−
ME12044A
5. INSTALLATION
To ensure accurate XAFS measurement, optical system must be adjusted precisely. While the positional
adjustment of the monochromator crystal is performed by controlling the axes of the monochromator using
a computer, the position of the X-ray generator is adjusted manually. The relevant procedure will be
described below. (The adjustment procedure for optical axes varies somewhat between models supplied
with a direct-beam monitor and those without one. The following explanation covers both cases.)
5.1 Preparations for Adjustment
With the spectrometer placed in the datum position (2θ= 90 degrees), remove the two screws
(indicated by the arrows in Figure 5.1) fastening the monochromator to the spectrometer,and detach
the monochromator. In that operation, the Insulock ties that clamp the cable to the monochromator
may have to be cut off in some cases. Exercise caution when cutting off the tie using nippers or the
like, to prevent damaging the cables. After the monochromator has been removed, install the
optical-axis adjustment slit in the same location. Then, place the direct-beam monitor immediately
behind the slit. On a model not provided with a direct-beam monitor, install the scintillation counter
immediately behind the optical-axis adjustment slit. This scintillator counter is the same one that is
employed for measurement. Connect its cable to the counter through the hole between the
spectrometer section and the sample section.
Figure 5.1Monochromator (D010524A05)
Figure 5.2After Removing the Monochromator (D010524A06)
Screws

−7−
ME12044A
Figure 5.3After Installing the Optical-axis Adjustment Slit (D010524A07)
Figure 5.4View with the X-ray Intensity Monitor Installed (D010524A08)
(D030328A01) (D030328A02)
Figure 5.5View with the SC Installed Using an X-ray Intensity Monitor Jig and Cable Hole

−8−
ME12044A
5.2 Adjustment of Optical Axes
The optical-axis adjustment slit is designed so that it will be positioned at the center of rotation of the
monochromator, with a width of 0.05 mm. The effective focal size of the X-ray is 0.06 mm with
take-off angle of six degrees. The optical system is designed in such a manner that it will deliver
precise data when it is adjusted so that the three points of the X-ray source, the divergence-slit center,
and the optical-axis adjustment slit are aligned in straight away. As the positions of the divergence slit
and optical-axis adjustment slit are adjusted mechanically with high accuracy, the above condition must
be satisfied by changing the position of the X-ray source, specifically that of the X-ray tube.
5.2.1 Setup of the divergence slit (DS)
First, the XG is set to 10 kV-10 mA, and then the divergence slit is set to 0.05 mm using the
control software. Select “init”and click on [OK] to activate the initialization. Enter the value of
0.05, select “move,”and click on [OK] (Figure 5.6).
Figure 5.6DS Setup Screen
5.2.2 Model with a direct-beam monitor
Open the shutter (Note), and observe the deflection of the needle of the direct-beam monitor. If no
deflection is observed, turn up the gain. If the needle does not deflect even when the gain has been
turned up, increase the X-ray load (turn up the X-ray tube voltage or tube current).
When the deflection of the needle has been confirmed, loosen the fixing screw and adjust the
position of the X-ray source using the X-ray-tube adjustment knob. Set the knob to a point at which
the deflection of the needle is at its maximum. Once the position of the tube has beenestablished,
fasten the screw securely.
This completes the adjustment of the optical axes. Remove the optical-axis adjustment slit, and
re-install the monochromator.
Figure 5.7X-ray-tube Adjustment Knob (D010524A09)
Note: If the shutteris to be opened, the radiation enclosure must always remain closed.
Adjustment Knob
Fixing Screw

−9−
ME12044A
5.2.3 Model without a direct-beam monitor
First, initialize the scintillation counter (SC). Selecting “ADJUST”→“I Detector”in the control
software pops up the dialog box shown in Figure 5.8. There, enter the values HV = 900, Base line
= 0.5,and Window = 3.0, and click on [OK]. Ignore the other settings, regardless of what their
values are.
Figure 5.8Scintillation Counter (I-counter) Setup Screen
In this condition, open the shutter and measure the intensity of the direct beam. Select the [FT] tab
in the Counter dialog box, and set the FT time to 0.5 sec and the FT cycle number to 300, then
click on [OK]. This will start the measurement. Use the X-ray-tube adjustment knob to adjust the
position of the X-ray generator section. Set the knob to a position at which the X-ray intensity
reaches its maximum. Once the X-ray-tube position has been established, fasten the tube securely
by tightening the fixing screw. If the X-ray intensity is too low, increase the X-ray load (by turning
up the X-ray tube voltage or tube current). If no X-rays are detected, widen the divergence slit.

−10 −
ME12044A
6. MEASUREMENT
The XAFS spectrum measurement is carried out in the order of monochromator adjustment →detector
adjustment →preliminary measurement →main measurement, following selection of the monochrometer
crystal and placement of the sample. For the operation method ofthe measurement software, refer to the
MexWin instruction manual (ME13250A).
6.1 Preparations for Measurement
Because the XAFS spectrum measurement consists of measuring the absorption coefficient, it enables
a spectrum to be obtained regardless of the state of the sample, whether be it in a solid phase, liquid
phase, or gas phase. However, the spectrum may be distorted or a major error may occur in the
analysis if the sample thickness is not uniform or dispersion of elements is not uniform. When a
powder sample is to be measured, a simple solution would be to apply it to a piece of Scotch tape. In
such a case, try to apply the sample as evenly as possible.
Once the sample has been prepared, position the monochrometer crystal suited to the absorption-edge
energy of the target element. If multiple candidates are available, choose one based on the energy
resolution or X-ray intensity.
6.2 Adjustment of the Monochromator
Move the goniometer to a higher-energy region (by approximately 200 eV) than the absorption edge of
the target element. Set the divergence slit to 6 mm and the receiving slit to approximately 0.2 mm, and
select Adjust →Monochromator. Scan the ω-axis. Initially, scan the entire range (-3 to +3°) in steps
of 0.01°. If a peak is found, scan the range of ±0.1°with that peak in the center, in steps of 0.001°,
and set the ω-axis to the peak position.
6.3 Adjustment of the Detector
Select Adjust →I Counter, and execute HV scan. If a peak is found, enter that peak value in the HV
field of the PHA scan tab, and activate the PHA scan. Enter the values obtained in the HV scan and
PHA scan in the respective fields of the HV/PHA tab, and click on [OK]. This completes the setup of
the I-detector. In addition, set up the I0-counter by following a similar procedure.
6.4 Measurement
Open the measurement-condition dialog box by selecting Measure →Execute. The equipment comes
with the measurement conditions set for K-absorption edges from Ti to Ag and some of the
LIII-absorption edges that can be measured using the Looper. Specify the name of the element in the
condition field to invoke the corresponding measurement conditions. Set the measurement time at each
point to one second, and conduct preliminary measurement. If the preliminary measurement results are
satisfactory, extend the measurement time and execute the main measurement. As a rough guide, this
measurement time should be set such that a million counts will be taken where the X-ray intensity is
the lowest. If too much time is required to perform the measurement, then change the settings of the
optical system. For example, change the selection of the monochromator crystal, widen the slit, or the
like. If the preliminary measurement results are abnormal, it is likely that the optical system is not
tuned up properly. Perform the adjustment.

−11 −
ME12044A
6.5 Example of Measurement
The Looper is supplied with copper foil (5 µin thickness) as the test sample for use in the adjustment
and inspection of the optical system. The specific measurement procedure using the copper foil is
described below.
6.5.1 Installing the monochromator crystal
The equipment is supplied as standard with a Ge (220) crystal. Install this crystal in the
monochromator. It can be plugged in and retained by a magnet. If the current setting in the control
software is not Ge (220), choose Ge (220) after selecting Setup →Crystal.
Figure 6.1Ge (220) (D030328A03)
6.5.2 Moving the goniometer
Move the goniometer to 9200 eV. Normally, the crystal adjustment of XAFS is performed at an
energy point that is approximately 200 eV higher than the energy of the absorption edge of the
element to be measured. As the energy of the K-absorption edge of Cu is 8984 eV, make the
adjustment with the goniometer at 9200 eV. Select Manual →Goniometer, enter 9200 in the
Energy field, and click on [OK].
Figure 6.2Goniometer Setup Screen
Standard accessory
Ge (220)

−12 −
ME12044A
6.5.3 Setting the detector provisionally
The I0-detector (proportional counter) is used to adjust the monochromator crystal. Initialize the
I0-detector. Select Adjust →I0Counter, enter HV = 1050, Base line = 0.5, Window = 3, and click
on [OK].
Figure 6.3Detector Setup Screen
6.5.4 Setting the slits
Set the divergence slit (DS) and receiving slit (RS). Set the DS to 2 mm and the RS to 0.2 mm.
Figure 6.4Slit Setup Screen

−13 −
ME12044A
6.5.5 Adjusting the monochromator
In the R-XAS Series, the section that containing the monochromator-crystal set is referred to as
the “monochromator,”and control is exerted on its three axes;ω, tilt,and Z. The ω-axis represents
the axis of rotation in the direction of the diffraction plane, tilt is the axis of elevation orthogonal to
ω, and Z is the longitudinal axis. Adjust the monochromator precisely so that the X-rays emitted
from the X-ray generator are led to the sample section.
Figure 6.5Adjust Menu
Select “Adjust”→“Monochromator”in the main menu.
Figure 6.6Monochromator Adjustment Dialog Box
Specify the scanning range of each axis in “start”and “end.”Next, specify the step width and
measurement time at each point and select, using the radio button, the output of the detector, I0or I,
to be displayed on the screen. The detector selected in that operation must have been initialized. In
cases in which no signal is displayed despite the factthat scanning has been performed, or an error
occurs, initialize the detector.

−14 −
ME12044A
Clicking on “OK”after setting the various values will initiate the scan, and a peak profile will be
displayed. After the scan is complete or is terminated by emergency stop button , a dialog box will
appear prompting the selection of a range. Specify, using the mouse, a range containing the peak
profile in which the monochromator axis is to be set, and click on “OK.”If no range is selected,
the system will find a peak from the range currently displayed, fit it using quadratic function, and
move the axis to the peak value. Pressing “Cancel”will cause the system to hold further action.
Enlarge the profile, read the values, and set each axis manually.
Normally, the Z-axis is set in the position at which a peak is detected in the Z-axis scan after the
goniometer is moved to the energy of the characteristic X-rays. If there are no appropriate
characteristic X-rays within the movable range of the goniometer, set the Z-axis using the
absorption edge. The procedure for doing so is as follows: load the standard sample, such as metal
foil, into the sample holder, and set the goniometer to the energy of the absorption edge. Monitor
the output of the I-detector, and define as the Z-axis position as that at which the X-ray intensity
falls in the case of a transmission layout, or as that at which fluorescence X-rays start being
emitted in the case of fluorescence layout.
The adjustment procedure for the ω-axis will be described below.
(1) XG setup
The XG is set to 18 kV-10 mA. As the goniometer is positioned at 9200 eV, the XG should be set
to an X-ray-tube voltage of double that value. The tube current may be at its minimum.
(2) Rough adjustment
Select Adjust →Monochromator. Open the Omega tag, enter Start = -3.0, end = 3.0, Step = 0.01,
FT = 0.5, and click on [OK]. The Omega-axis scan will begin. A peak should appear in the
proximityof 0°. However, if the peak position deviates significantly (±1°), reinstall the
monochromator.
When a peak is observed, perform fine scanning of the area of the peak.
Figure 6.7Omega-axis Adjustment Tab

−15 −
ME12044A
Figure 6.8Range Selection Dialog Box
Figure 6.9Example of an Enlarged Profile
In the display of a profile, blue indicates Diff and yellow denotes Int. When ascan is completed or
is terminated by clicking on STOP, a dialog box like the one illustrated in Figure 6.8 will be
displayed. Select the range, and click on [OK]. The system will start seeking the center by fitting
the peak by a quadratic curve and prompting selection of whether to move to that position.
Clicking on [OK] again here moves you to the position determined through calculation. A profile
can be enlarged when the starting point of the desired enlargement range is specified by
left-clicking and dragging the mouse pointer to the end point, then left-clicking again (Figure 6.9).
(3) Fine adjustment
Fine adjustment should be performed by scanning the range of approximately 0.2°, in steps of
0.002°.
Figure 6.10 Example of Fine-adjustment Setup

−16 −
ME12044A
6.5.6 Adjusting the detector
In XAFS measurement, the energy of detected X-rays varies depending on the element under
measurement, unlike in powder X-ray diffraction, which uses characteristic X-rays. This requires
changing the voltage of the detector and the settings of the single channel analyzer.
The standard configuration of the R-XAS Series employs a semi-transmission-type proportional
counter for monitoring the intensity of incident X-rays, and a scintillation counter for counting the
intensity of X-rays transmitted through the sample. While the scintillation counter provides
detection efficiency of nearly 100% over a wide energy range, the detection efficiency of the
proportional counter varies depending on the type of gas with which it is filled. For XAFS
measurement, it is desirable to use an I0-detector with detection efficiency ranging from
approximately 10%to 30% for incident X-rays. Therefore, the gas best suited to the target energy
must be chosen. To make an adjustment using the Cu foil, employ the Ar-300 (filled with argon
gas) supplied with the equipment as a standard accessory.
Adjust the detector by selecting “Adjust”→“I0Counter”(or “I Counter”). For “HV scan,” set
the window of the single channel analyzer to the specified value, and gradually vary the voltage
imposed on the detector. This will change the gain of the detector and bring the pulse hight of the
output signal to within the range of the single channel analyzer. Enter the voltage of the peak
position detected by “HV scan”in HV of “PHA scan,”and initiate the PHA scan. The value of
the starting point of the peak obtained in the PHA scan will become the “Baseline”value, and the
width of the peak will become the “Window”value. When the scintillation counter and proportional
counter are compared, the PHA scan of the latter is found to be narrower in width. In addition, the
proportional counter exhibits escape peaks that are not seen on a scintillation counter. An actual
adjustment procedure using the Ar-300 will be described below.
(1) HV scan
Enter HV (low) = 800, HV (high) = 1200, Step = 5, and click on [OK]. As the HV scan comes to
an end, a dialog box for range selection will be displayed, as in the case of the ωscan. Enlarge the
proximities of the peak selectively, and click on [OK]. However, note that the peak value found
here will be stored in the HV/PHA tab, but that the value will not be reflected in the PHA scan tab
in the following step. Therefore, it will be necessary to memorize the value.
If no peak is observed, it is likely that there is no X-ray entering the detector. Perform the
preparations again, starting from the adjustment of the monochromator.
Figure 6.11 HV Scan Tag
Table of contents
Other Rigaku Measuring Instrument manuals
Popular Measuring Instrument manuals by other brands

Roche
Roche cobas Urisys 1100 Quick reference guide

Mytrex
Mytrex myActive Alert instruction sheet

ParTech
ParTech 7300w2 Monitor instruction manual

Associated Research
Associated Research HypotULTRA 7820 Operation and service manual

Hioki
Hioki 9291 instruction manual

ARJAY ENGINEERING
ARJAY ENGINEERING 4200-IG-2 user manual