SKILLQUBE qubeCONTROLLER User manual
User manual
qubeCONTROLLER

GENERAL INFORMATION 4
DISPOSAL 4
UPDATES 4
SYSTEM SETTINGS 4
OPENING THE CONTROL CENTRE 4
ESTABLISHING A WIFI CONNECTION 4
ACTIVATING THE CONTROLLER 5
5
CONNECTING SYSTEMS FOR LOGIN 5
CONTROLLER – CONTROLLING THE VITAL VALUES 6
SP02 7
ETCO2 8
RESPIRATORY FREQUENCY 8
SENDING THE TREND TIME AND VITAL PARAMETERS 8
IMPACTING SENT VITAL PARAMETERS WITH TREND TIME 8
REANIMATION 9
CONNECTING SYSTEMS 10
REPRESENTATION OF THE CPR DASHBOARD 13
ASSESSMENT CONTROL 13
PAGER ALARM 13
VENTILATION DEVICE 14
MENU 14
TRAINING LOGS 14
INTEGRATING THE CPR SENSOR 14
APP SETTINGS 15
MEDIA 15
SCENARIOS IN THE qubeController 16
LOGIN TO THE CLOUD 16
SCENARIOS 16
SCENARIO DESCRIPTION 17
18
CHECKLISTS 18
MEDIA 18

STARTING OR CHANGING A SCENARIO 18
PAUSING OR TERMINATING THE SCENARIO 18
CONTROLLING THE SCENARIO 18
PHASES 19
WRITTEN LOGBOOKS 19
IMPRINT 20

GENERAL INFORMATION
DISPOSAL
As our deliveries may include batteries and accumulators, we are obliged under
Batteriegesetz (BattG) [German Battery Act] to point the following out to you:
Batteries and accumulators must not be disposed of as household waste. Used
batteries may contain harmful substances which may cause damage to the
environment or your health if they are not stored or disposed of properly. However,
batteries also include important raw materials, such as iron, zinc, manganese or nickel,
and can be recycled.
After use, you can either send the batteries back to us or return them for free in the
immediate vicinity (e.g. in a shop or at municipal collection points or in our dispatch
warehouse). Returning batteries in retail shops is restricted to a reasonable quantity
for end users as well as being restricted to those used batteries which the retailer offers
or has offered as new batteries in their product range.
UPDATES
Please do not implement any updates to new operating systems of the tablet
manufacturer Apple without having them authorised by SKILLQUBE. However, we
kindly ask you to update the application regularly so that we can guarantee the full
functionality and compatibility. If you have any further questions or experience
technical problems, please do not hesitate to contact us under
www.skillqube.com/support.
SYSTEM SETTINGS
The qubeSERIES offers the option of adapting pre-defined settings for all monitors as
well as the controller. This includes, for instance, changing the units for temperature,
artificial ventilation and blood sugar or setting the reanimation duration of the AED for
the monitors
OPENING THE CONTROL CENTRE
To open the control centre, swipe from the bottom of the screen upwards on any
screen. On an iPad with IOS 12 or a newer version, swipe from the top right
downwards. With older versions, swipe from the bottom to the top.
ESTABLISHING A WIFI CONNECTION
Before starting the simulation, ensure that the controller, monitor and assessment are
in the same WIFI. For this purpose, in the Home screen, open Settings > WIFI, and
select the corresponding network. Repeat this on all devices.
ACTIVATING THE CONTROLLER
In the latest version, qubeSERIE users can decide on which iPads the controller is to
be activated. After the initial installation, you will be prompted to log into the cloud. After
a successful login, the controller is activated and can be used. If the hardware is
renewed or is to be replaced
due to a defect, the controller
can be deactivated and
reactivated on a new device.
Only selected persons of an
organisation can log in or out.
Further information is provided
in the qubeCLOUD manual.
CONNECTING SYSTEMS
FOR LOGIN
When connecting the
controller and the monitor,
please ensure that the systems
are located in one network to
guarantee a stable connection.
(Interfering frequencies in the
direct surroundings may impair
the connection and even cause
a loss of connection in the
worst case)
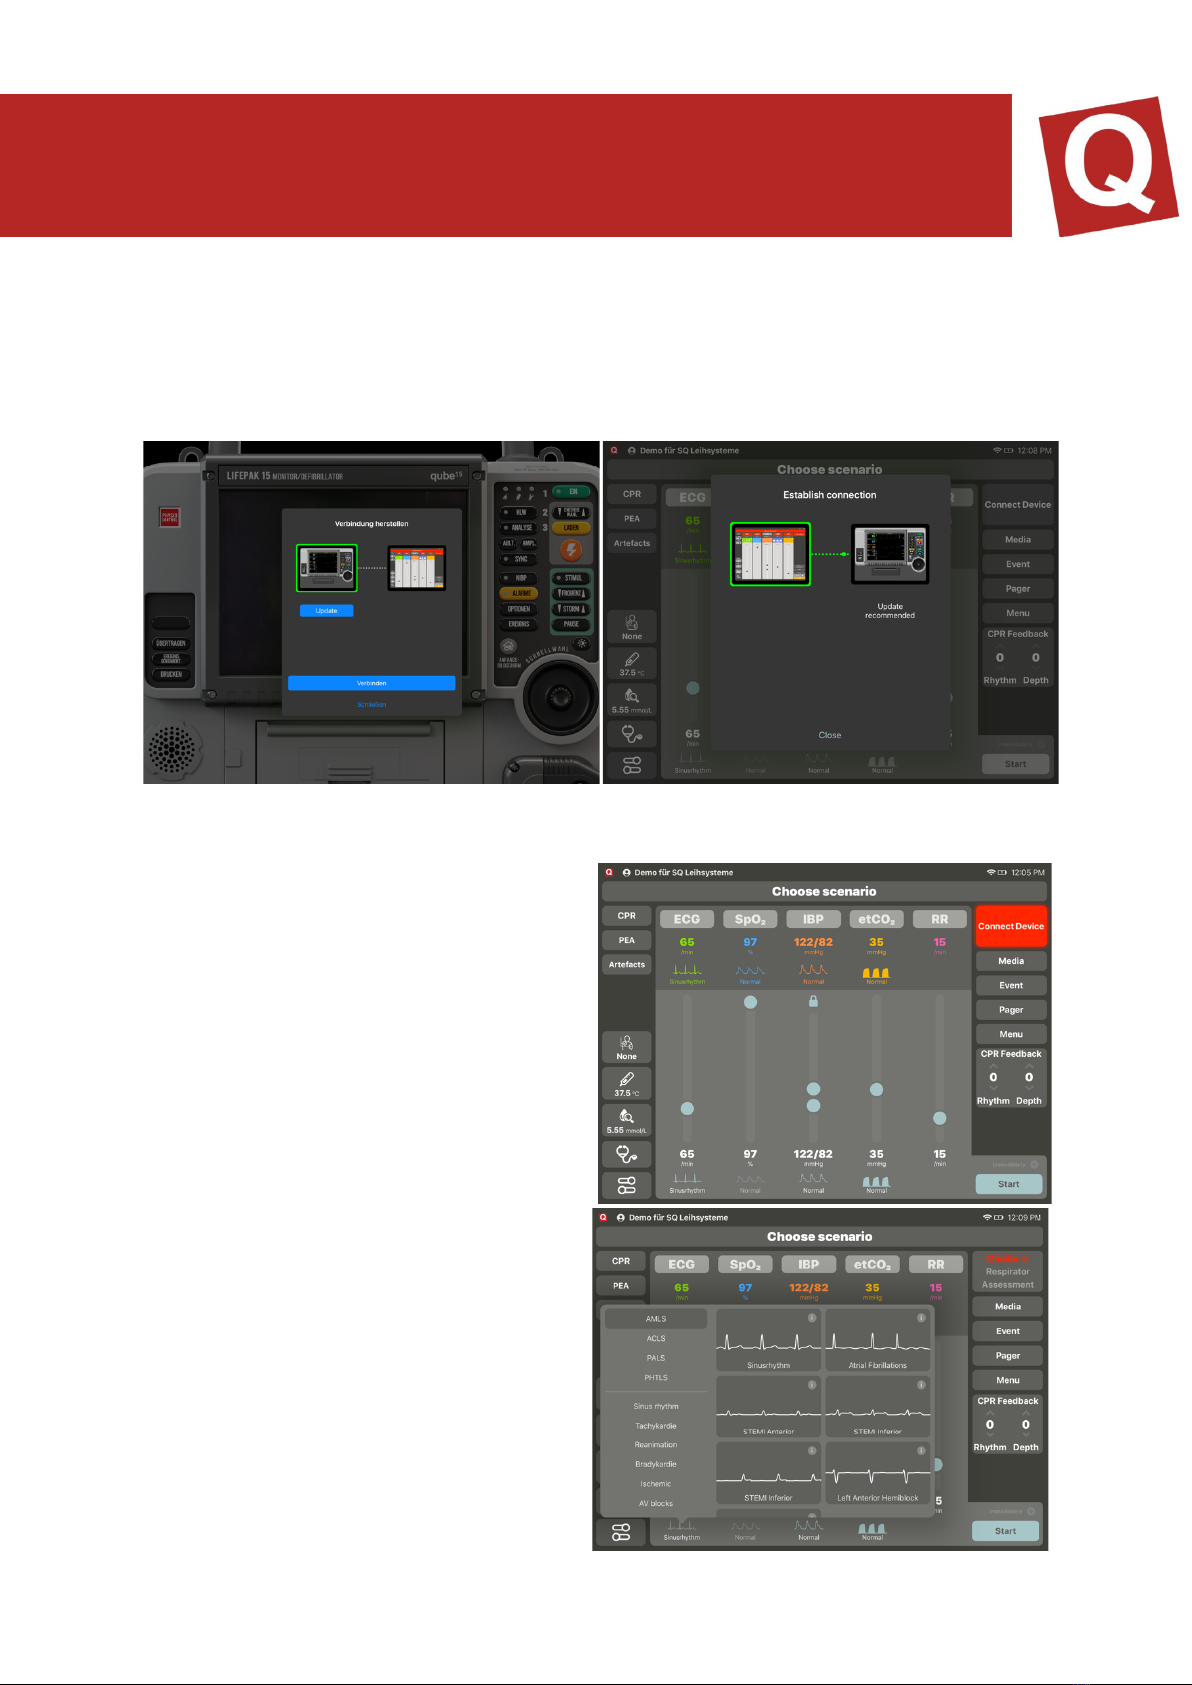
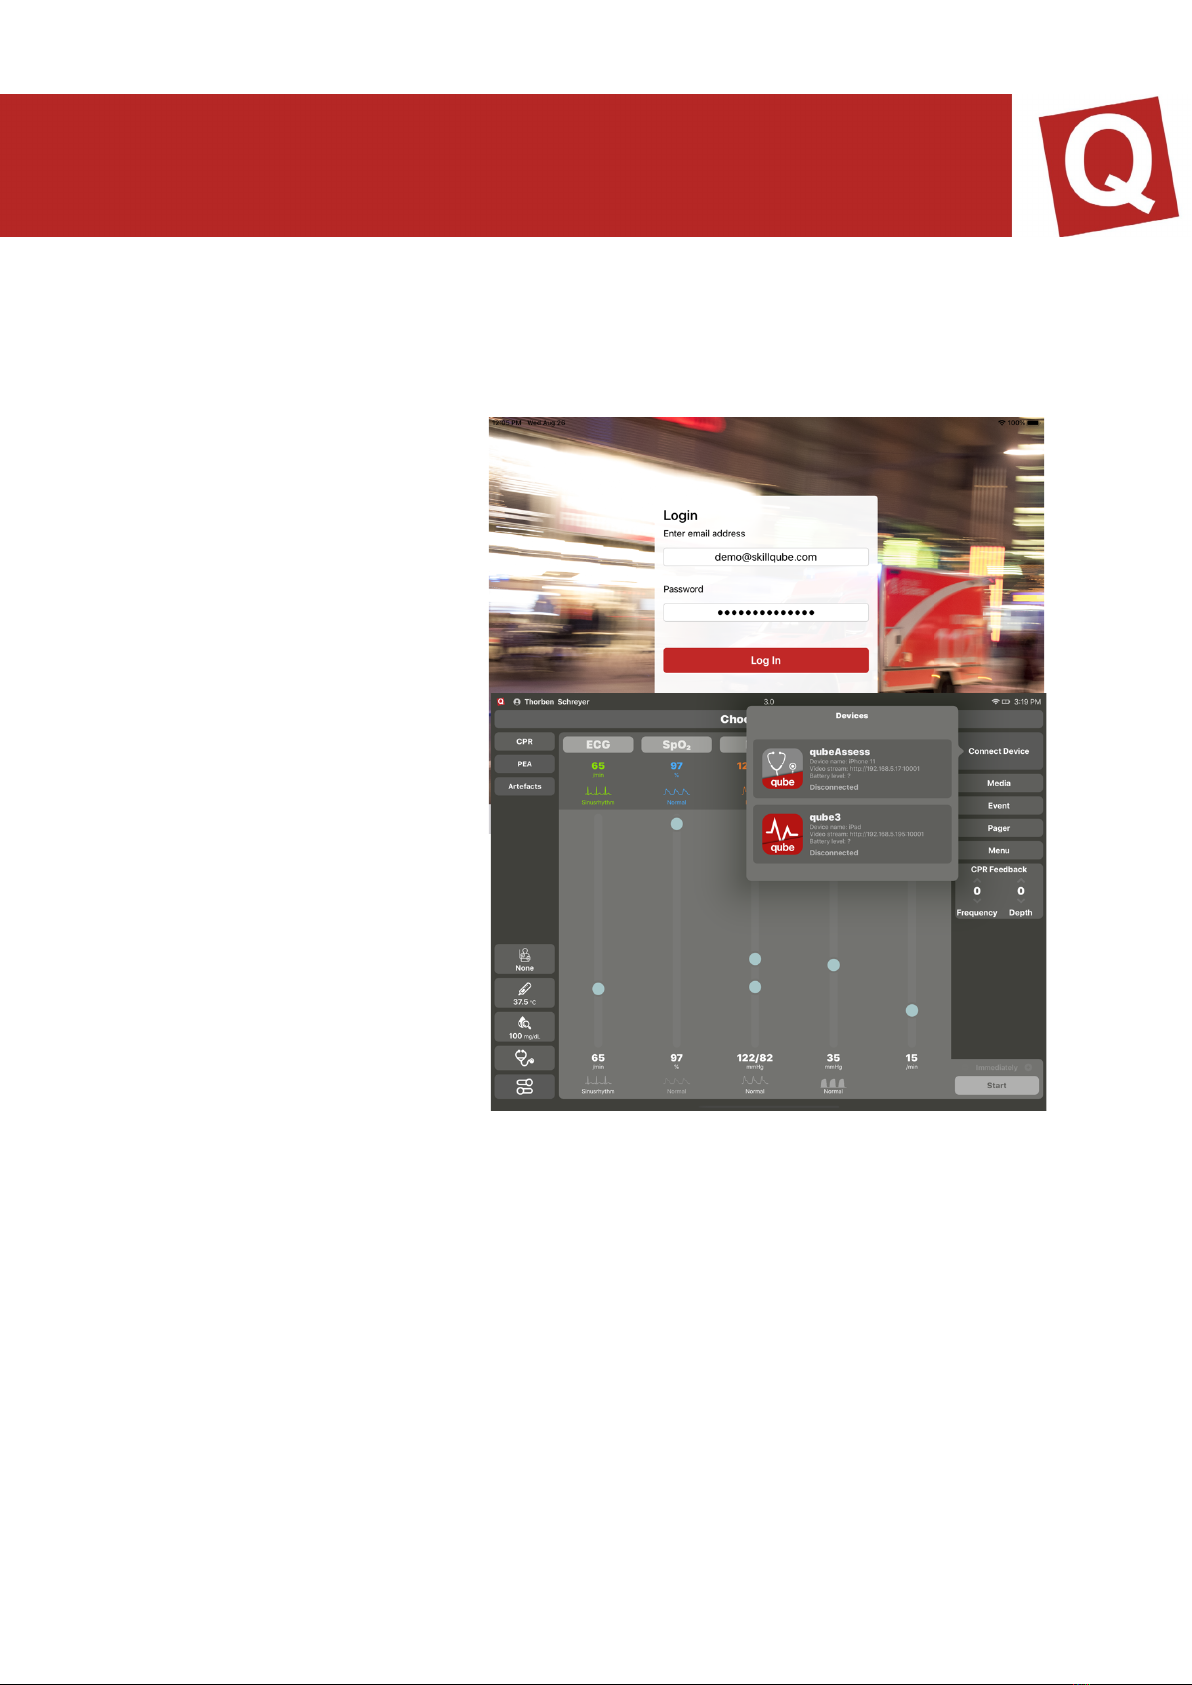
To couple the system, now tap on the red flashing “Connect device” button. When
pressing the button, all available devices in the area are displayed on the screen.
(Figure 2) Search for your monitor and select it. On the monitor, you will be prompted
to connect the controller with the monitor (figure 3). Once the devices have been
connected, a check mark will appear as confirmation.
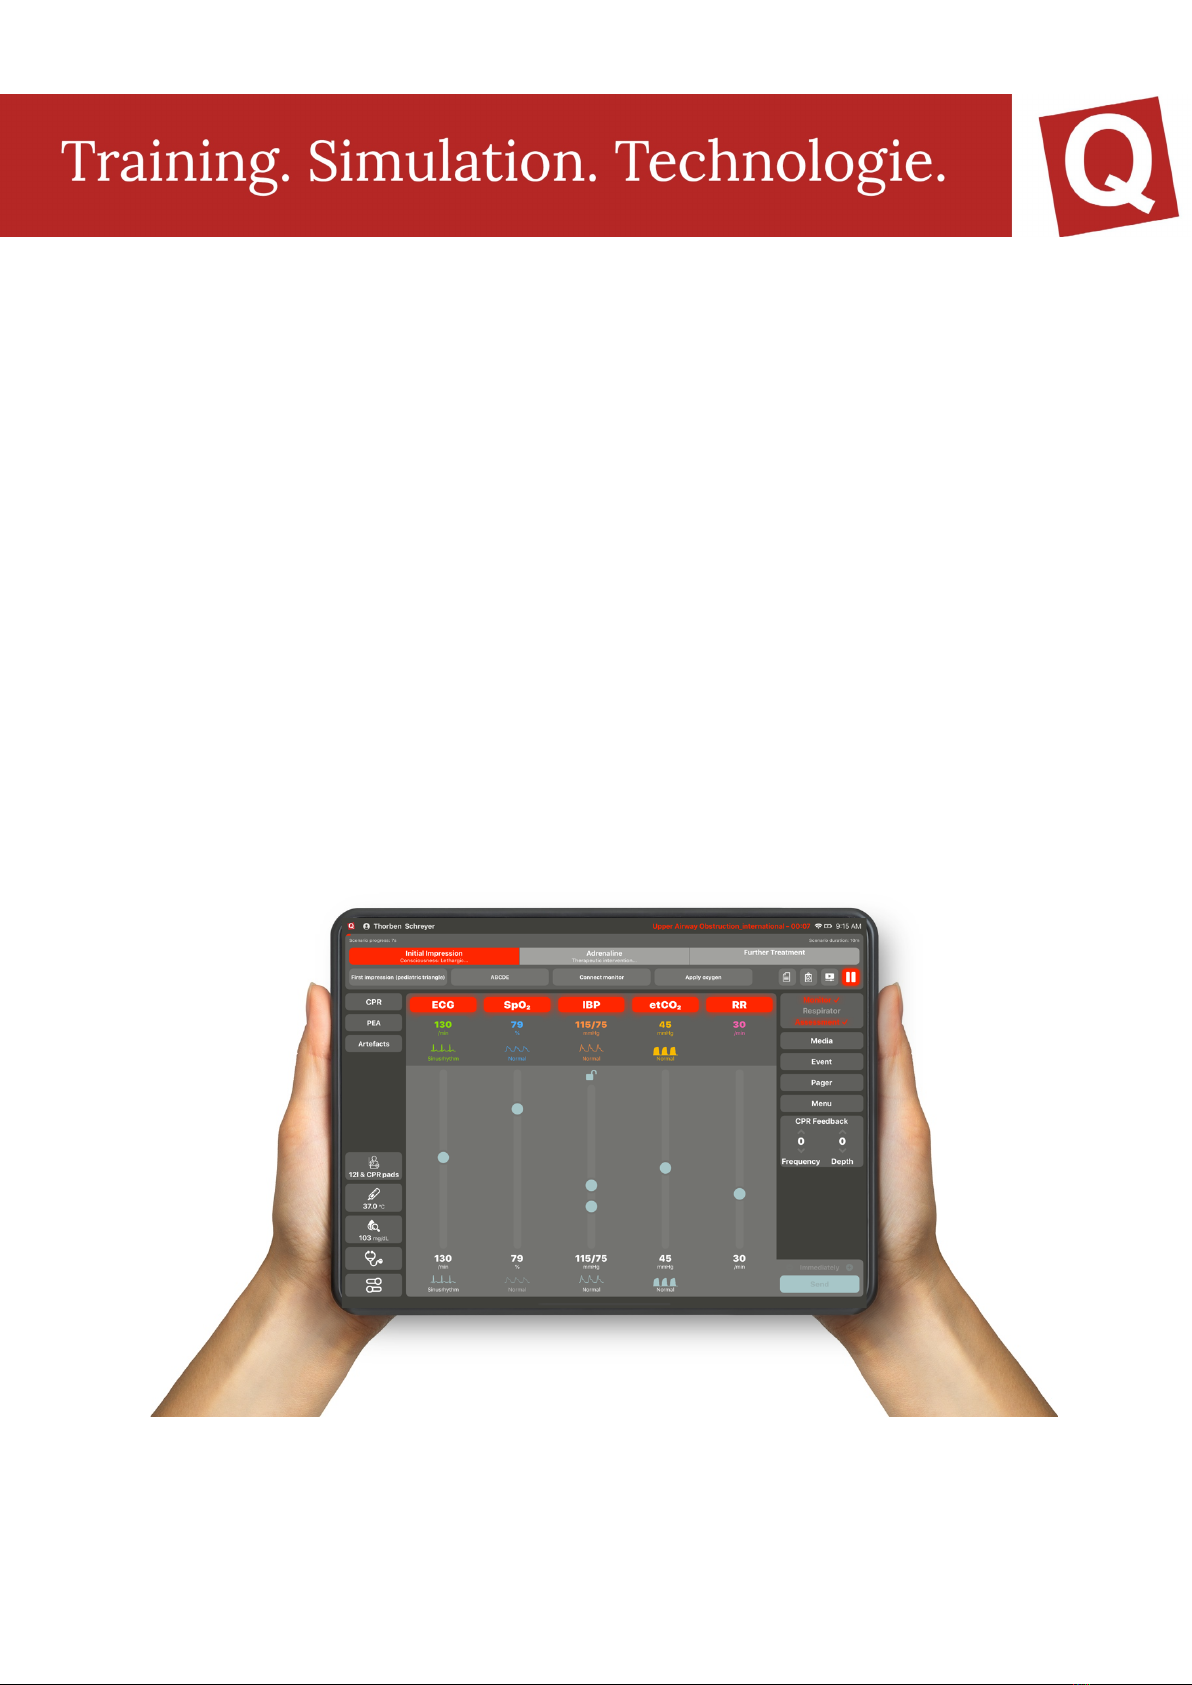
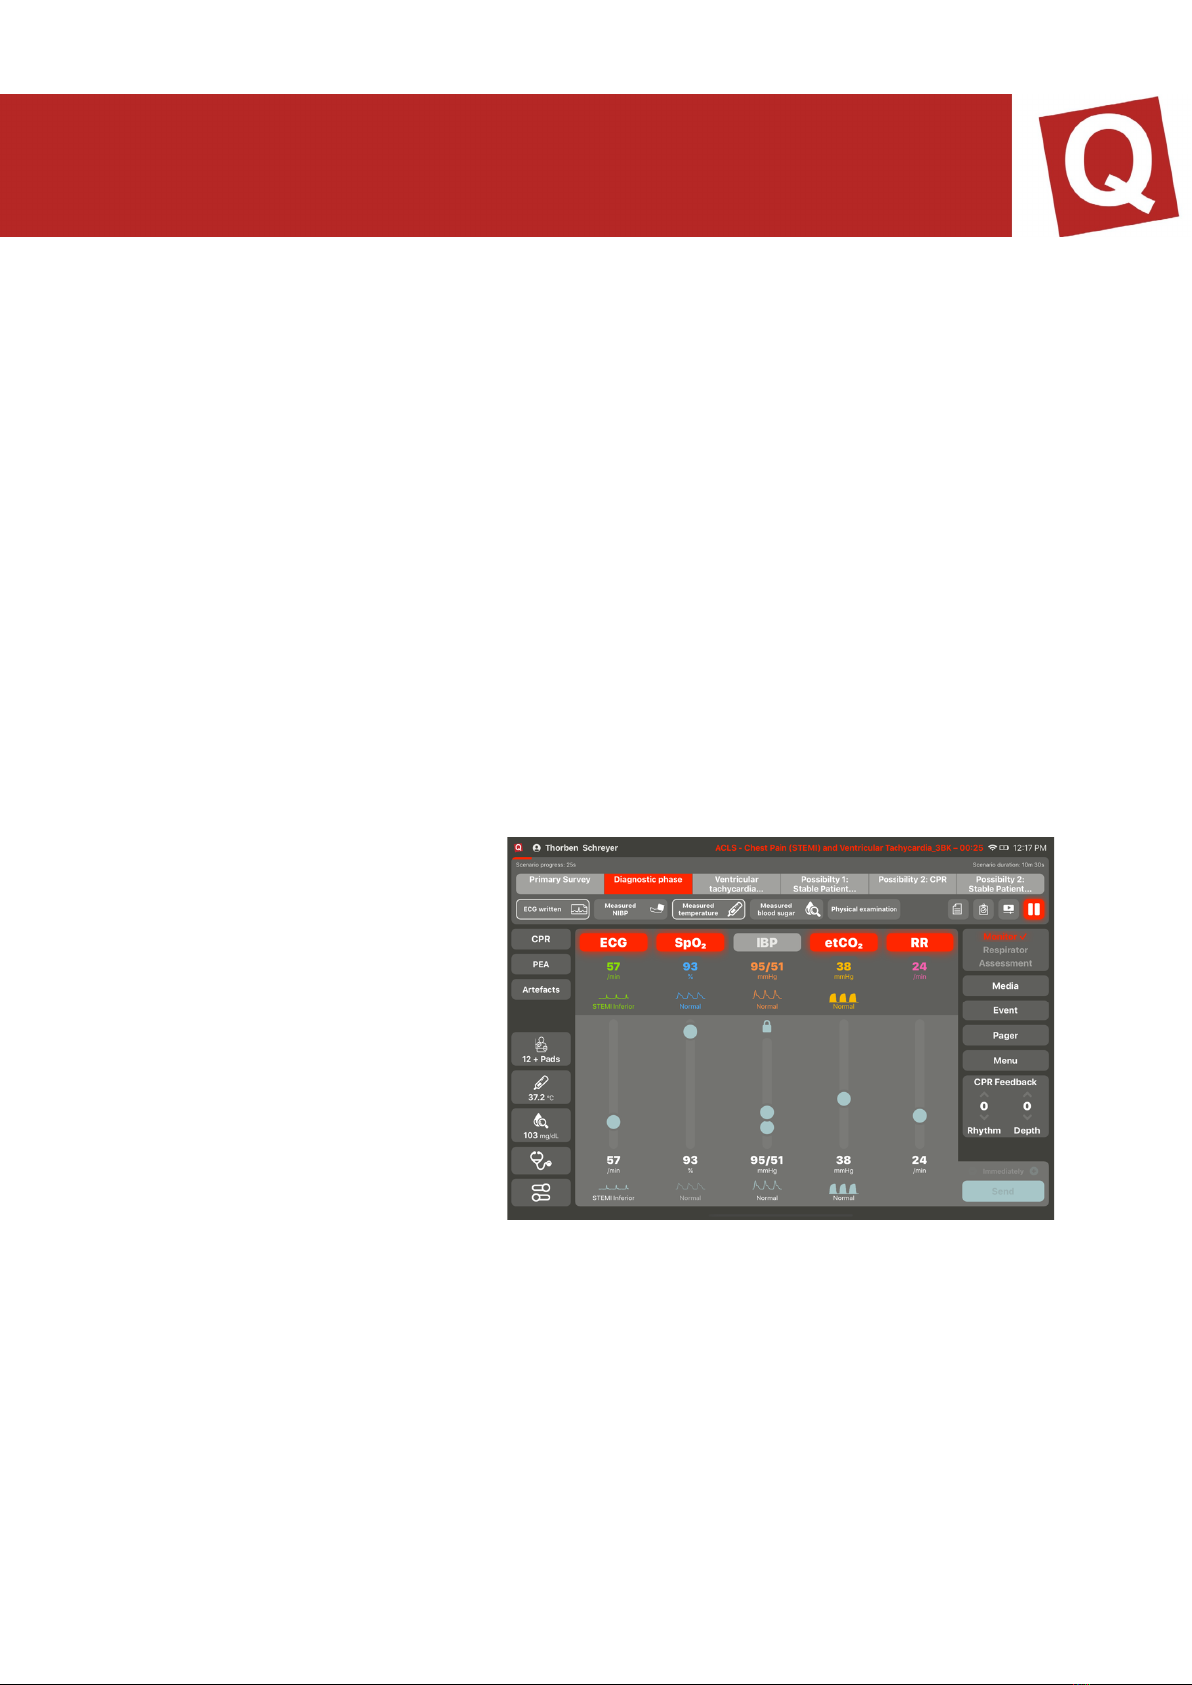
CONTROLLER – CONTROLLING THE VITAL VALUES
In “free scenarios”, the patient is
controlled via the control module located
in the centre. You have the option of
switching the values on or off, changing
the numeric value or the wave form or
implementing other settings. Each
module has an identical structure to
reduce complexity. The structure is
arranged from the bottom to the top. as
follows: (Figure 4)
In the modules, the target and the actual
value areas are displayed separately.
The upper area displays the actual
values (numerical value and wave form)
which are visible to the participants on
the monitor if it is switched on. The target
values are displayed in the lower area.
(Numeric value and wave form
By tapping on the wave form (figure 5),
the submenu with all available wave
forms is displayed. By selecting the “i”
button, additional information can be

displayed. Tap the ECG wave form to select it. The selected wave form is framed in
yellow, and the selection window closes. All vital values are converted to the values to
be expected (pre-set if activated in the AppSettings). Subsequently, in the bottom right,
select “Send” in order to send the new values to the monitor.
In the extended settings (figure 6), you
have the option of setting the pacer
threshold as well as the PP difference. With
the pacer threshold, you can set the mA
value which is to be achieved on the
monitor for the patient to react. With the PP
difference, you can set the difference
between the eclectically derived ECG heart
rate and the measured heart rate via the
SpO2 sensor. Additionally, poor circulation
and the CO display are indicated here. You
can furthermore set the sound volume of
the iPad monitor.
SP02
SpO2 is directly connected to the blood pressure. This means that when the blood
pressure drops, the SpO2 wave form becomes smaller too. If the systolic blood
pressure falls under 50 mmHg, the wave form is automatically displayed as flatline,
and the numeric value is replaced by a “?”
There is also an option of simulating a situation in which the SpO2 derivation is not
working correctly. For this purpose, “Cold hand” is activated in the settings of SpO2.
Using IABD supports 2 functions of the unit. On the one hand, it is used for displaying
the regular NIBD blood pressure value. For this purpose, the instructor only needs to
set the desired value. When a participant measures the blood pressure on the unit, the
set value is displayed. If the instructor has set a trend time, the value present on the
controller at the point in time at which the measurement is terminated is displayed. Via
the extended settings, you can de-couple the systole and the diastole in order to set
both values independently from each other. By activating and deactivating the IABD
value, you can activate the arterial wave form on the monitor. When the artery is
switched on, all values are directly displayed on the monitor; for this reason, the system
sends you a new security query. To separate the systole and the diastole, tap onto the
lock symbol. If it is opened, the systole and the diastole can be set independently from
each other. If it is closed, a dependency is given again

ETCO2
EtCo2 offers different wave forms. When etCo2 is switched on, the respiratory
frequency is activated automatically. When using EtCo2, it is to be ensured that the
respiratory frequency is always greater than 0 since, otherwise, no wave form is visible.
RESPIRATORY FREQUENCY
Under the extended settings, the respiratory frequency includes the option of setting
the CO. This can then be displayed on the corresponding devices (monitor interfaces).
SENDING THE TREND TIME AND VITAL PARAMETERS
If new values are set, the button “Send” changes its colour from grey to green. If the
button is coloured, this means that a new dataset with vital parameters can be sent to
the monitor. Before sending, the period (trend time) of the corresponding change can
be adapted, i.e. how quickly the newly set values shall change. Here, several values
can be controlled simultaneously, or each value can be controlled independently. After
sending, the button is displayed in grey again.
IMPACTING SENT VITAL PARAMETERS WITH TREND TIME
By moving the desired slider, the instructor can select a submenu offering the following
options:
Stop all trends -> All active trends will be stopped and can be set again
Stop SpO2 trend -> Only the specifically selected trend will be stopped. All other
trends remain unaffected.
Continue all trends -> All trends will continue running as usual.

REANIMATION
To simplify the processing of reanimation situations, instructors can change over to the
CPR area. Here, the instructor can select which rhythm is to be set after the shock,
including a trend time. Additionally, the total number of shocks administered is
displayed. If the “Artefacts” button is activated during reanimation, the assessment
starts and, in the end, indicates the CPR fraction value.
If the “PEA” button is pressed, all values except for the heart rate fall to 0. PEA remains
illuminated in red until the blood pressure or EtCo2 value is changed. The “PEA” button
can be deactivated by pressing it again.
To be able to use the CPR feedback, you will need the controller, the monitor and the
CPR sensors by SKILLQUBE. The sensors are connected via Bluetooth. To connect
the sensors, please proceed as follows.
· Connect the controller and the monitor
· Move the CPR sensors within reach of the monitors (50cm)
· On the controller, under “Menu”, tap on “Integrate CPR sensor”
· The system then automatically searches the sensors in the surroundings of
the iPad monitor
· The sensors found can now be connected via “Connect”
· The system is ready to start and can be used
To register the performance of the participants, you can enter the names in the
beginning of the scenario Now open the CPR view; you can see the participants who
you have entered before. By selecting the participant, the reanimation performance is
allocated to the corresponding participant. After the training, each participant has their
individual performance displayed in the logbook.
CONNECTING SYSTEMS
To successfully connect the
systems, take the sensor out of
the charging device and ensure
that the sensor battery is not
empty. Then connect your
controller with the monitor. After
a successful connection, now,
the surface should look like
displayed in the figure below.
Subsequently, move the sensor
close to the monitor to establish
a connection. For this purpose,
open the "Menu” tab on the
controller and press “CPR sensor”. (If you use the CPR feedback for the first time on
the monitor used, a prompt will appear asking whether the app is allowed to access
Bluetooth. Confirm this with “OK”)

The monitor will now search for all sensors in the vicinity; for this purpose, Bluetooth
must be activated! Now tap on Connect; the selected sensor will flash briefly in the
beginning.
CALIBRATING THE SENSOR
If a red open-end wrench is visible on the displayed sensor, tap on it and follow the
instructions until they disappear. Once all steps have been correctly implemented, the
sensor is calibrated and connected.
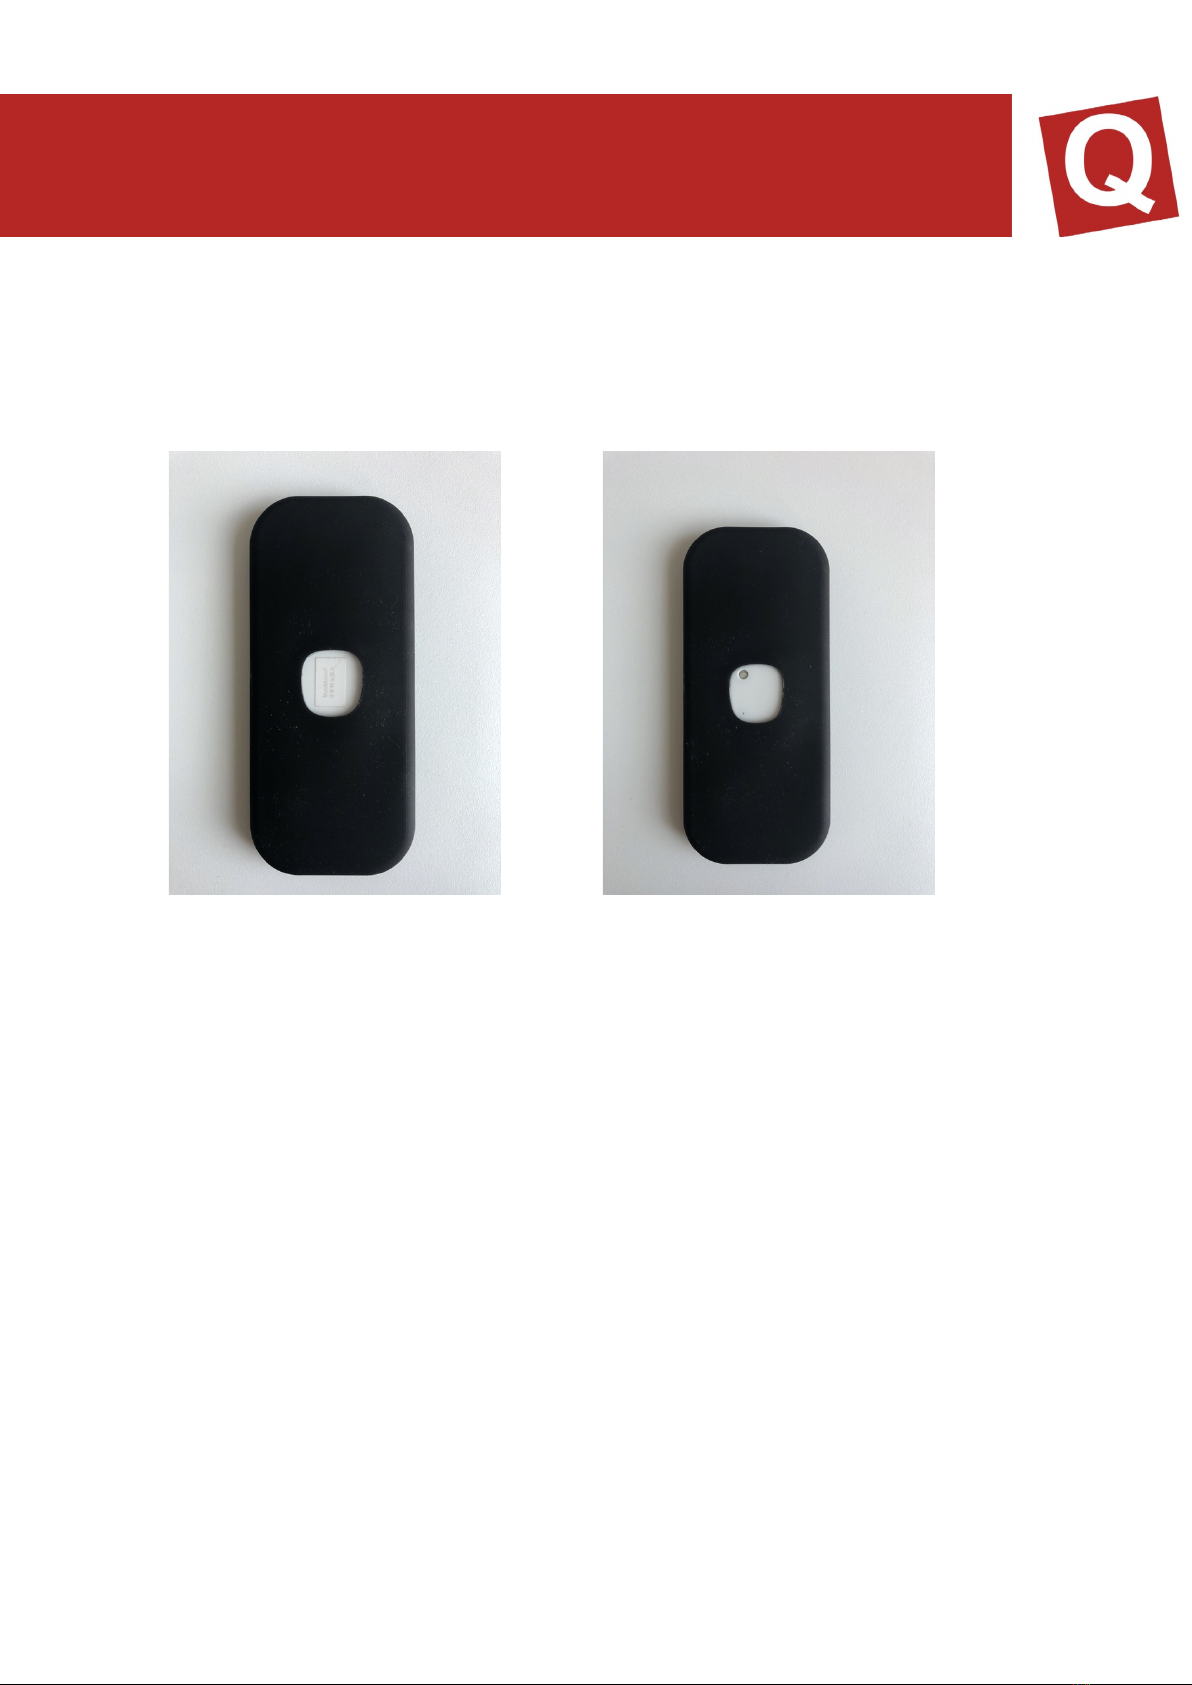
CPR POD
Once you have successfully connected the sensor and no calibration is required, insert
the sensor into the CPR Pod included in the scope of delivery. Here, please ensure
the correct orientation of the sensor; the upper side must be pointed upwards in the
pod.
CORRECT WRONG
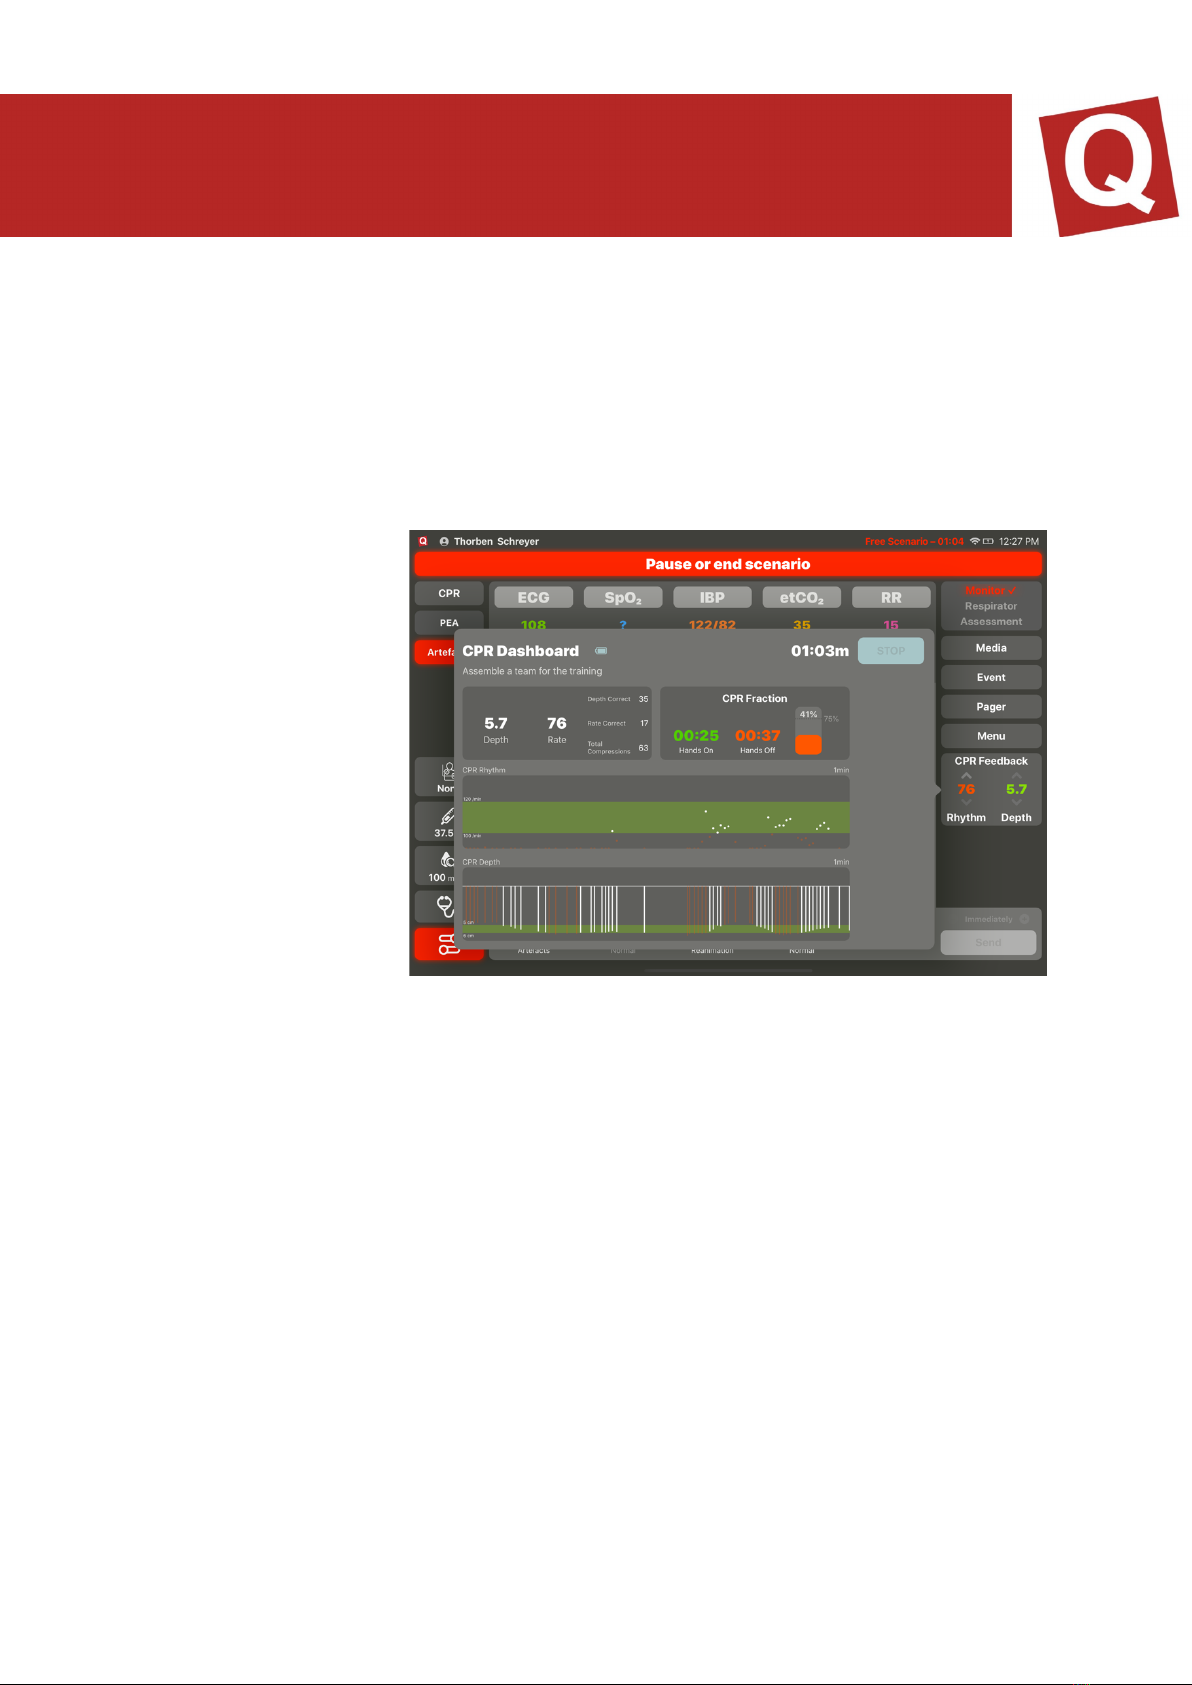
REPRESENTATION OF THE CPR DASHBOARD
In the left-hand field, the compression depth and speed as well as the total number of
compressions carried out, and, above it, information as to how often the participant
has pressed deep enough and whether the correct speed of the compressions has
been achieved, are displayed to the instructor.
In the top right field, the
CPR fraction is
displayed; here, the
hands-on/hands-off
time is indicated in %. A
fraction between 60 –
80% is ideal. A high-
performance CPR is
given as of 90%.
The field for the CPR
rhythm indicates the
compression speed in
the course of one
minute. This should be
between 100 –
120/min. The lower
field displays the compression depth, which can be set in the app settings, so that it
can be adjusted to the usual guidelines. The values displayed in white are the correctly
implemented ones, while the values displayed in red are the incorrectly implemented
ones.
ASSESSMENT CONTROL
In addition to the monitor, the assessment app can be connected to the controller and
will then provide the values for temperature, blood sugar and auscultation. To change
the values, press the corresponding field in the bottom left corner of the controller and
change the values as desired. These will be sent directly and displayed on the
assessment app when opening it.
PAGER ALARM
Participations in a simulation can be alarmed in the simulation via a pager. For this
purpose, the assessment software must be installed on a terminal device. By default,
SKILLQUBE delivers an iPod Touch for this purpose.

The alarm texts can be entered and stored on the controller as desired. An alarm is
issued if the instructor taps onto one of the alarm notifications entered before. The
latter is then displayed with an alarm sound and a displayed pager on the assessment
app. The participant can confirm the alarm by tapping on the monitor of the assessment
app. An alarm may be issued at any point in time.
VENTILATION DEVICE
If a ventilation device is connected to the controller, the icon for the control and/or
overview for the ventilation device appears in the left bottom corner. Here, the
instructor is informed about all set values and the current ventilation mode. Based on
this information, the instructor can react to the settings of the participants at all times
and change the patient.
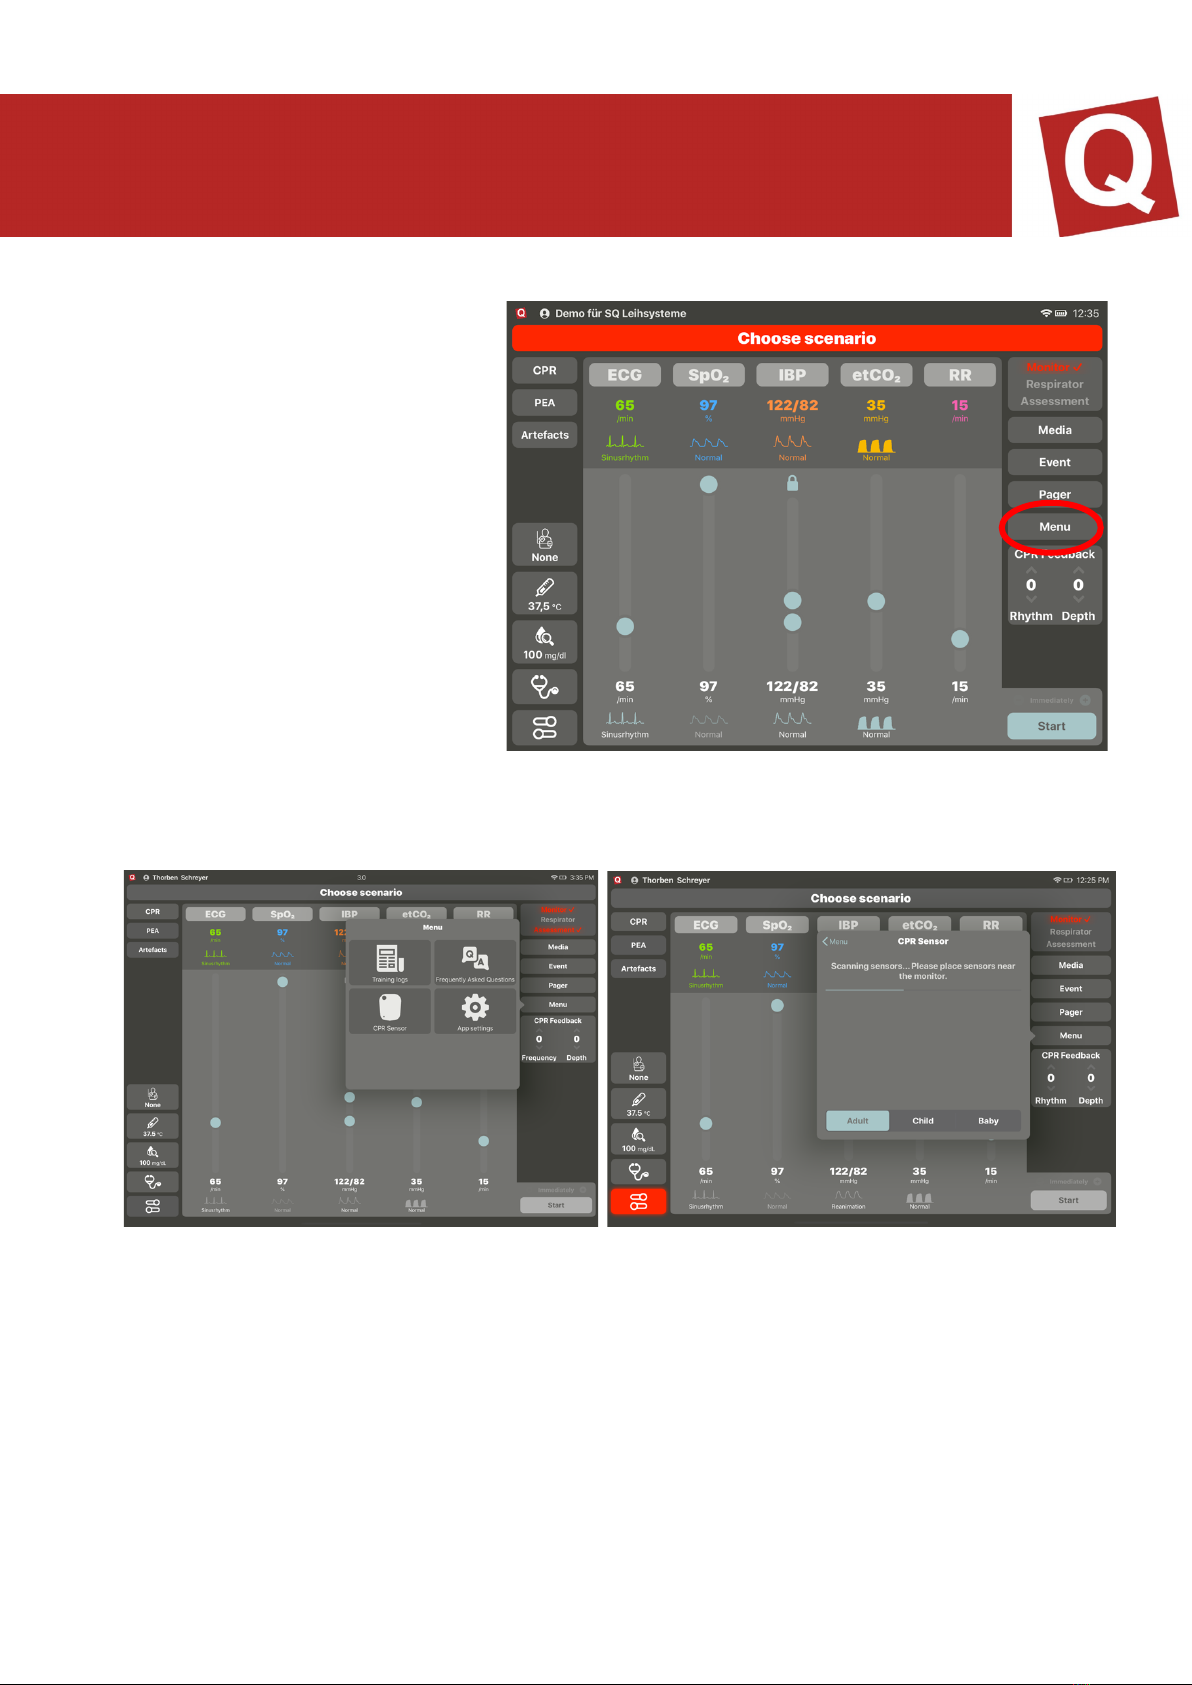
MENU
To provide the instructor with a better overview, various menu points have been
summarised. This includes the training logs, the settings of the monitor volume at the
iPad, the integration of a CPR sensor for using the CPR feedback and access to the
AppSettings, which can no accessed more easily.
TRAINING LOGS
Training logs are created for each scenario. They are used for logging the implemented
measures of the participants in the simulation and the set values at the controller by
the instructor.
To open them, tap on “Menu” and then on “Training logs”. All available logs will be
displayed. By tapping on the desired log again, the latter is displayed. It is possible to
transfer it to another device via the Apple export function. By swiping from the left to
the right, you are provided with the option of deleting the training log. Alternatively, via
“Edit”, a multiple selection can be made to delete it. Once logs have been deleted, they
can no longer be restored.
INTEGRATING THE CPR SENSOR
You need a CPR sensor to use the CPR mode. To integrate the CPR sensor, proceed
as described under CPR feedback. Via the selection “Adult, child, baby”, you can
allocate the values set by you in the app settings as quick selection. These are decisive
for the compression depth and frequency as well as the related evaluation.

APP SETTINGS
By means of the App settings menu item, you can access the app settings, via which
the basic controller settings can be implemented. The following settings can be made:
Setting
Value
Temperature unit
°C or °F
Blood sugar unit
mg/dl or mmol/l
Co2 unit
mmHg or kPa
Parameter pre-settings on/off
Defines whether pre-set vital values are
taken over
CPR settings
CPR pre-settings (baby, child, adult) with
frequency and compression depth
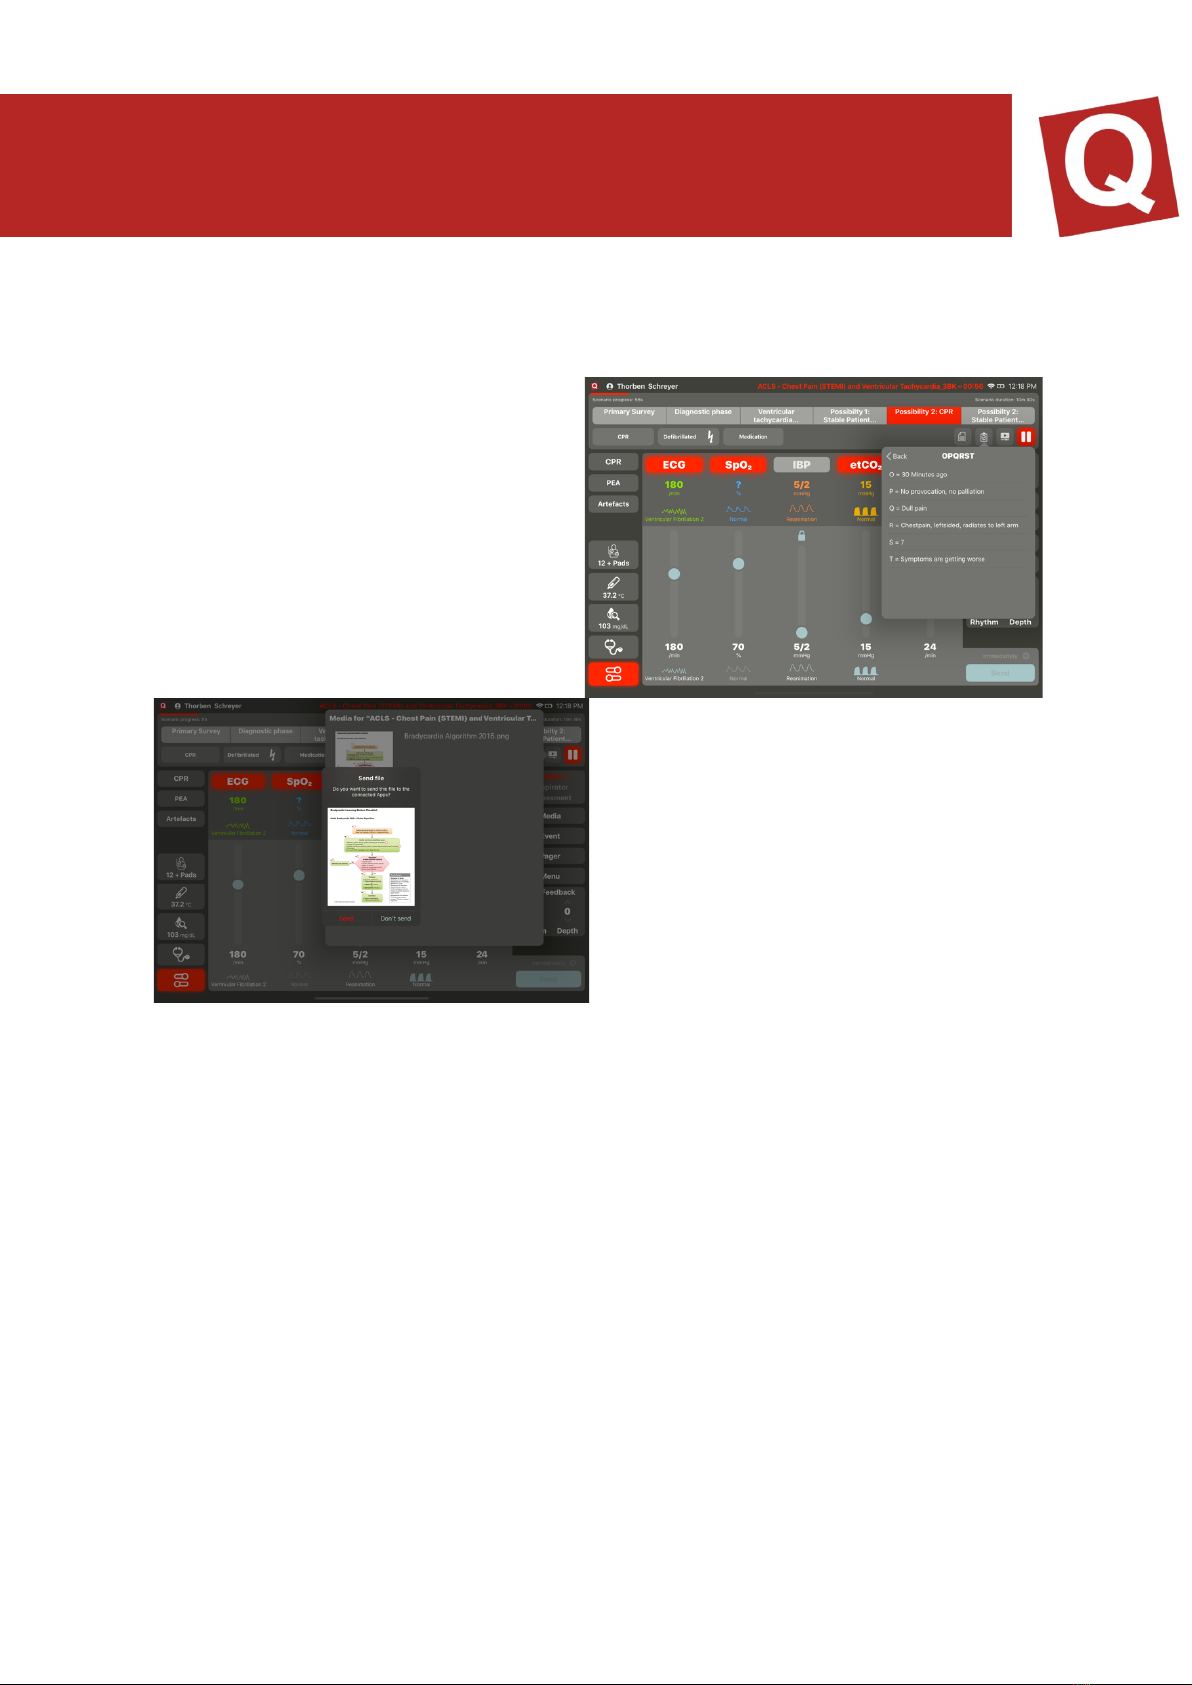
MEDIA
You can send all media present on the iPad to the assessment app. For this purpose,
tap the ”Media” button in the top left corner and, subsequently, select the image or
video that you wish to send. When pressing “Send”, the image will be sent to the
assessment app.
EVENT DOCUMENTATION
Via the event documentation, you can document special events in the training log. Pre-
fabricated events exist which you can supplement by your own. For this purpose, enter
the desired text in the text field.
Select “Save” to add your event to the library. All events marked with * can be deleted
by swiping from the right to the left.
SCENARIOS IN THE qubeController
You can create scenarios in the qubeCloud, which are then played back via the
controller. To ensure that the scenarios can be stored on your system, you must
connect to the internet and establish a cloud connection with your access data. Once
the scenarios have been updated, the internet connection is no longer required. An
internet connection is only required if you wish to update the existing scenarios. The
creation of a scenario is explained in detail in the qubeCloud manual.
LOGIN TO THE CLOUD
To log in to the cloud, if this has not been done already, select “Login” (1) in the top left
corner. A login window appears. The login data is identical to the login data used in the
qubeCloud.
To log out, tap on your name and confirm with “Log out”.
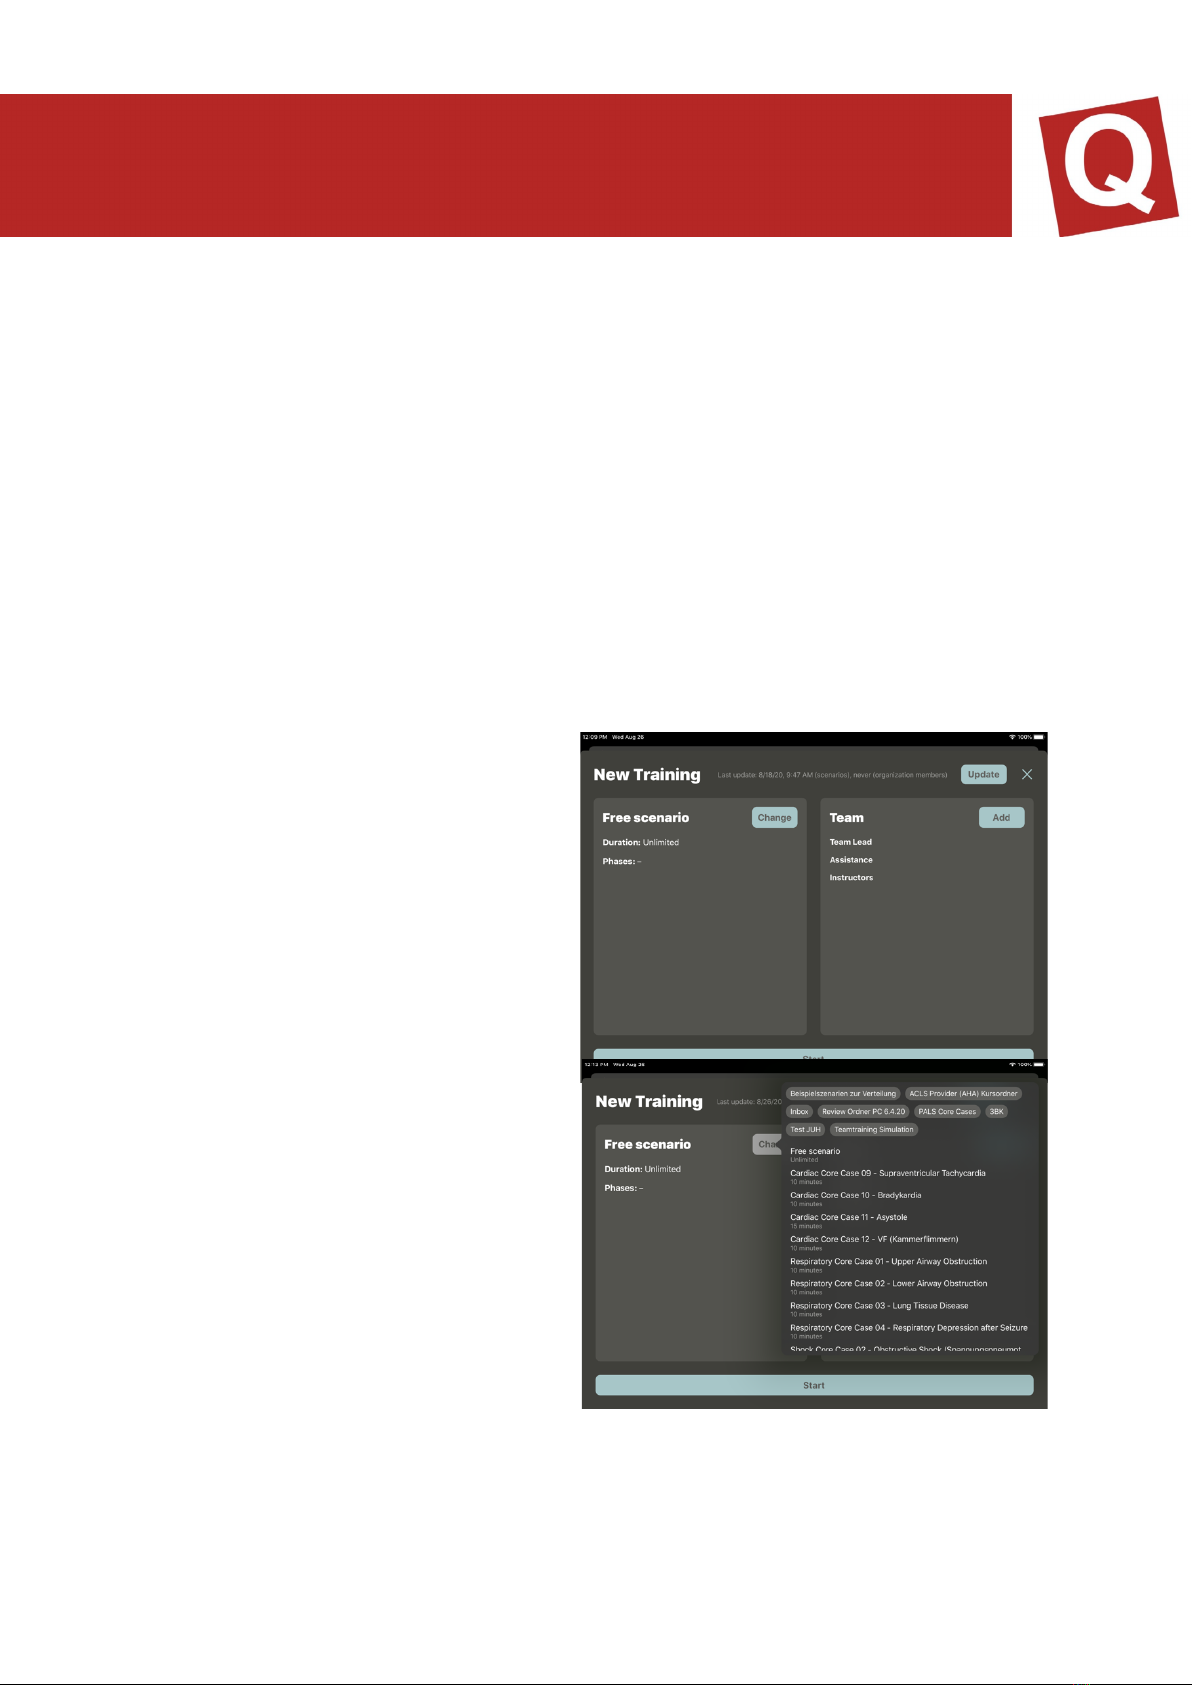
SCENARIOS
Tap on “Select scenario” to use the
scenarios from your cloud. The
Scenario menu (13, figure) will appear.
Here, you can update the scenarios and
users by tapping on Update. The
timeliness will be notified to you by
means of a time stamp. If all data is up-
to-date, you can select a scenario by
tapping on “Select”. An overview with all
approved scenarios appears. (14,
figure) Select the desired scenario and
tap on it. It is then loaded into the
overview. Subsequently, you can invite
participants to the scenario.
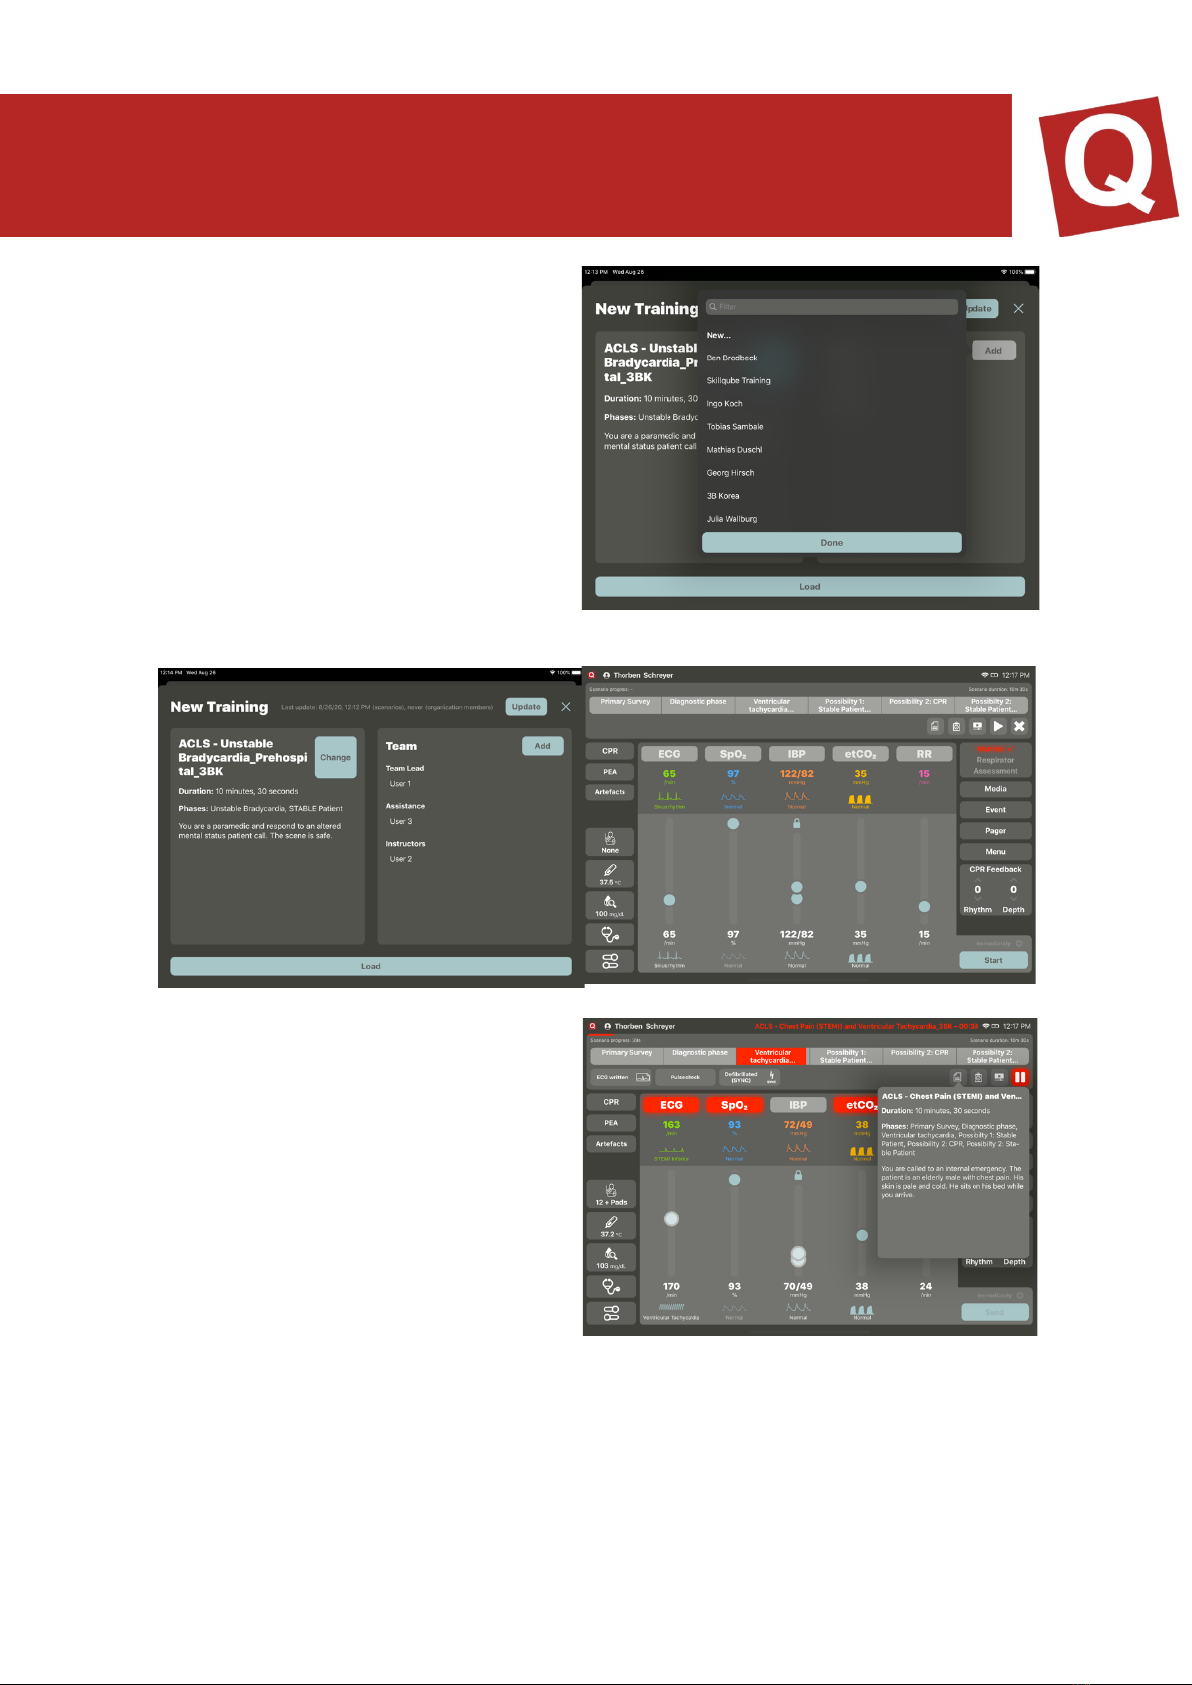
These are either established in your
cloud or can be added manually (figure
15).
After having selected all participants
and the scenario, you can load the scenario (figure 16 & 17)
SCENARIO DESCRIPTION
In the scenario description, the
instructor can gather all relevant
information on the scenario. The
description is written in the cloud.
CHECKLISTS
Checklists are cross-phase and can be
opened, displayed and marked as
implemented at any time. Implemented
tasks are displayed with a checkmark
after the scenario, while the outstanding
scenarios are displayed with a X in the
logbook.
MEDIA
All previously uploaded media intended for
the scenario are displayed here. The
media can be transferred to the
assessment app and displayed there.
STARTING OR CHANGING A SCENARIO
By tapping onto the “Play” button, the scenario is started. The scenario can be changed
by tapping on “X” and selecting a new one.
PAUSING OR TERMINATING THE SCENARIO
Once the scenario has been started, it can be paused or terminated by tapping on the
“Pause” button. The pause can be terminated again and the scenario is continued with
a 3-seconds countdown.
If the scenario is terminated, the logbook can be viewed afterwards.
CONTROLLING THE SCENARIO
To ensure that the instructor can concentrate on the participants during the scenario,
the controller has been designed in a way that the instructor can confirm measures,
and the phases are then implemented automatically.
PHASES
The phases are determined in the qubeCloud. Here, it is also defined whether a
duration or trend time is stored as well.
If a trend time is stored, the red bar appears above the set trend time. A “duration” can
also be stored for a phase; in this case, the red bar is then reduced in size. Once the
“duration” has expired, the phase is changed automatically.
Phase changes are offered once all defined measures have been done, or they are
implemented automatically if a defibrillation has been carried out or the duration of a
phase (if set) has been expired. There is also an option of changing a phase by tapping
on it. With every change, the stored parameter is taken over and set correspondingly.
The scenario must aim at ensuring that the instructor spends less time with controlling
the controller and is thus able to focus on the measures of the participants.
MEASURES
Each phase may contain
measures. These are stipulated
in the cloud. Here, it is
differentiated between phases
which are detected by the
system and measures which are
to be confirmed by the instructor
themselves. Measures which are
detected automatically have an
icon, while measures which are
to be confirmed by the instructor
do not.
Once all measures of a phase
have been implemented, the
automatic change is offered. The latter can be confirmed or cancelled.
Measures are displayed as implemented or not implemented in the end of the logbook.
WRITTEN LOGBOOKS
Logbooks can be accessed via the menu at any time and can be opened and
distributed

IMPRINT
SKILLQUBE GmbH
Schafäckerweg 24, 69168 Wiesloch, Germany
Amtsgericht [district court] – Registergericht [court of registration] – Mannheim HRB
716968 [commercial register]
Headquarters: Wiesloch – CEO: Julia Wallburg, Prokuristen [company officers with
statutory authority under German law]: Georg Hirsch, Thorben Schreyer
Email: [email protected]
Website: www.skillqube.com
Phone: +49 (0) 6222 / 38 62 65
Fax: +49 (0) 6222 / 38 63 65
VAT identification no.: DE 289937847
You can view our General Terms and Conditions at any time under
skillqube.com/impressum.
Table of contents
Other SKILLQUBE Medical Equipment manuals


Popular Medical Equipment manuals by other brands


Medirol
Medirol CONTERO M126 user manual

Lowenstein Medical
Lowenstein Medical JOYCEeasy X Instructions for use

Plinth 2000
Plinth 2000 BARI1 Service manual

Reison
Reison 10-370 quick start guide

Aquolab
Aquolab Aquolab Professional manual

Mid America Motorworks
Mid America Motorworks CP Relief WandCP 1000 Operation manual