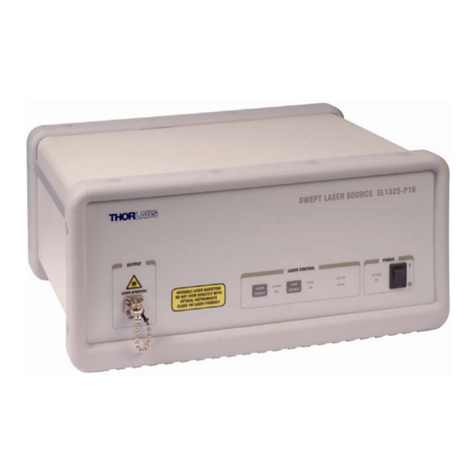
Spectral Domain OCT System
GANYMEDE-II-HR Page 4 www.thorlabs.com
Table of Figures
Figure 1 FBC1 Extended Mode............................................................................................................ 9
Figure 2 Cleaning Fiber Bulkheads...................................................................................................... 9
Figure 3 Cleaning Fiber Connectors .................................................................................................. 10
Figure 4 Schematic Diagram of the SD-OCT System ....................................................................... 11
Figure 5 A-scan Data Set.................................................................................................................... 12
Figure 6 B-scan Data Set.................................................................................................................... 12
Figure 7 Rendered Volumetric Data Set ............................................................................................ 13
Figure 8 En-Face View or C-scan...................................................................................................... 13
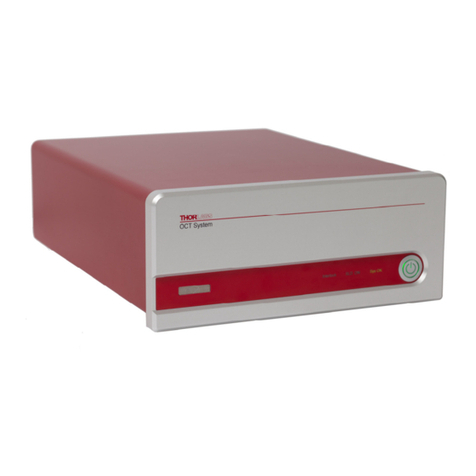
Figure 9 Base Unit.............................................................................................................................. 16
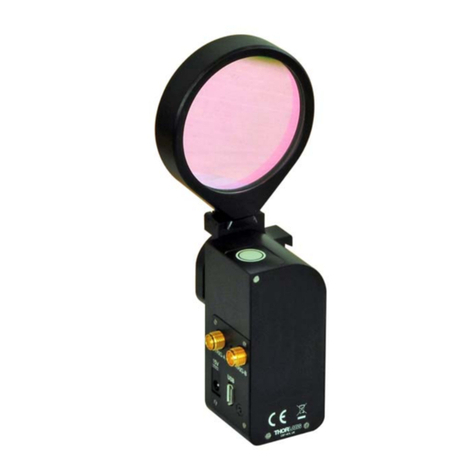
Figure 10 Imaging Probe (Front View)................................................................................................ 17
Figure 11 Imaging Probe (Rear View)................................................................................................. 17
Figure 12 Optical Layout of Imaging Probe ........................................................................................ 18
Figure 13 Reference Intensity Adjustment........................................................................................... 18
Figure 14 Reference Length Adjustment ............................................................................................. 19
Figure 15 Probe Stand with Imaging Probe ......................................................................................... 20
Figure 16 OCT Stand Coarse Adjustment and Cable Clip(rear view)................................................. 21
Figure 17 OCT Stand Adjusters and Dove Tail Slide.......................................................................... 21
Figure 18 OCT Stand Sample Station.................................................................................................. 22
Figure 19 Laser Emission Warning Labels.......................................................................................... 24
Figure 20 Base Unit Warning Labels................................................................................................... 24
Figure 21 Imaging Probe Warning Label............................................................................................. 24
Figure 22 Rear View of Base Unit....................................................................................................... 25
Figure 23 Interconnections of the Imaging Probe................................................................................ 26
Figure 24 Connections of the CameraLink Frame Grabber Card ........................................................ 26
Figure 25 Mounting the Imaging Probe into the Dove Tail Slide of the OCT Stand .......................... 27
Figure 26 CameraLink Frame Grabber Card inside the PC................................................................. 28
Figure 27 Trigger and CameraLink Cable attached to the PC ............................................................. 28
Figure 28 Attaching Trigger Cable to Base Unit ................................................................................. 28
Figure 29 CameraLink Cable Base Unit Attached to Base Unit.......................................................... 29
Figure 30 Power Supply Plug Connected to the Base Unit.................................................................. 29
Figure 31 Plugging the Probe Connector into the Imaging Probe ....................................................... 30
Figure 32 Installation of the Fiber at the Probe Fiber Connector......................................................... 31
Figure 33 Installing the Probe Connection at the Base Unit................................................................ 32
Figure 34 Installation of the fiber at the base unit Connector.............................................................. 33
Figure 35 Fiber Loop at the Base Unit................................................................................................. 34
Figure 36 Protection Cap Removal...................................................................................................... 34
Figure 37 Basic Focus Adjustment ...................................................................................................... 35
Figure 38 Different states of reference intensity adjustments.............................................................. 36
Figure 39 B-scan of an IR Viewing Card............................................................................................. 37
Figure 40 B-scan of a Nailfold, imaged at 28kHz A-scan Rate........................................................... 38
Figure 41 B-scan of a Finger Tip, imaged at 28kHz A-scan rate......................................................... 38
Figure 42 B-scan of a semi-transparent molded Plastic Cap................................................................ 39
Figure 43 B-scan of a laminated IR Card (not included) ..................................................................... 39
Figure 44 B-scan of a Section of a Grape ............................................................................................ 39
Figure 45 High Surface Reflection Causing Saturation and Nonlinear Response............................... 40
