TMI Products PGX+ User manual

T
Th
he
e
P
PG
GX
X+
+
M
Me
ea
as
su
ur
ri
in
ng
g
H
He
ea
ad
d
User’s Manual
Program version 4.0
2

3
1. Unpacking your instrument
2. Technical requirements
3. Installing the PGX+software
4. Calibration and Validation
4.1 Calibration Procedure
4.2 Validation Procedures
5. Setting up the PGX+instrument
5.1 Preparing a specimen
5.2 Special specimens
5.3 The Pump Dispenser
6. Miscellaneous
6.1 Sample preparation
6.2 Setting up a test
6.3 Instrument storage
6.4 Transportation
7. Test modes
7.1 Drop application Static Mode
7.2 Automatic testing in Static Mode
7.3 Drop application in Dynamic Mode
7.4 Automatic testing in Dynamic Mode
7.5 Automatic testing in Advancing Mode
8. Reports
9. Software functions
9.1 The Image Control Panel
9.2 Main Program
9.3 Static Mode
9.4 Dynamic Mode
9.5 Manual testing in Static/Dynamic Mode
9.6 Advancing Mode
9.7 SuperLow contact angles
9.8 View Mode
9.9 Surface Tension
9.10 Surface “free” Energy (SFE)
9.11 Options Screen
9.12 Enhance Mode
9.13 Baseline & Curtain settings
9.14 Camera Gain & Threshold
9.15 Field of View limitations
9.16 Use of other test liquids (SFE)
9.17 Translation of the User Interface
9.18 System parameters (Options)
10. Remote Control functions
11. Spare Parts and Consumables
12. Trouble Shooting
Appendices
A.1 Recommended droplet sizes
A.2 Detection of droplet in Dynamic Mode
B.1 Experienced problems
C.1 Surface Energy Conversion Chart
D.1 Replacement of Pump Tubing
D.2 Adjustment of Pump Volume
D.3 Small droplets below 0.5 µl
List of Contents
Technical Specifications
Image Capture Rate: 80 frames/second
Droplet size: 0,1 –10 µL
Drop application: Synchronized
Drop Application Modes: Touch Down / Impact / Manual
Field of View: 6,4 x 4,8 mm
Sensor Resolution: 640 x 480 pixels
Pixel resolution: 10 µm
Communication USB2.0
4
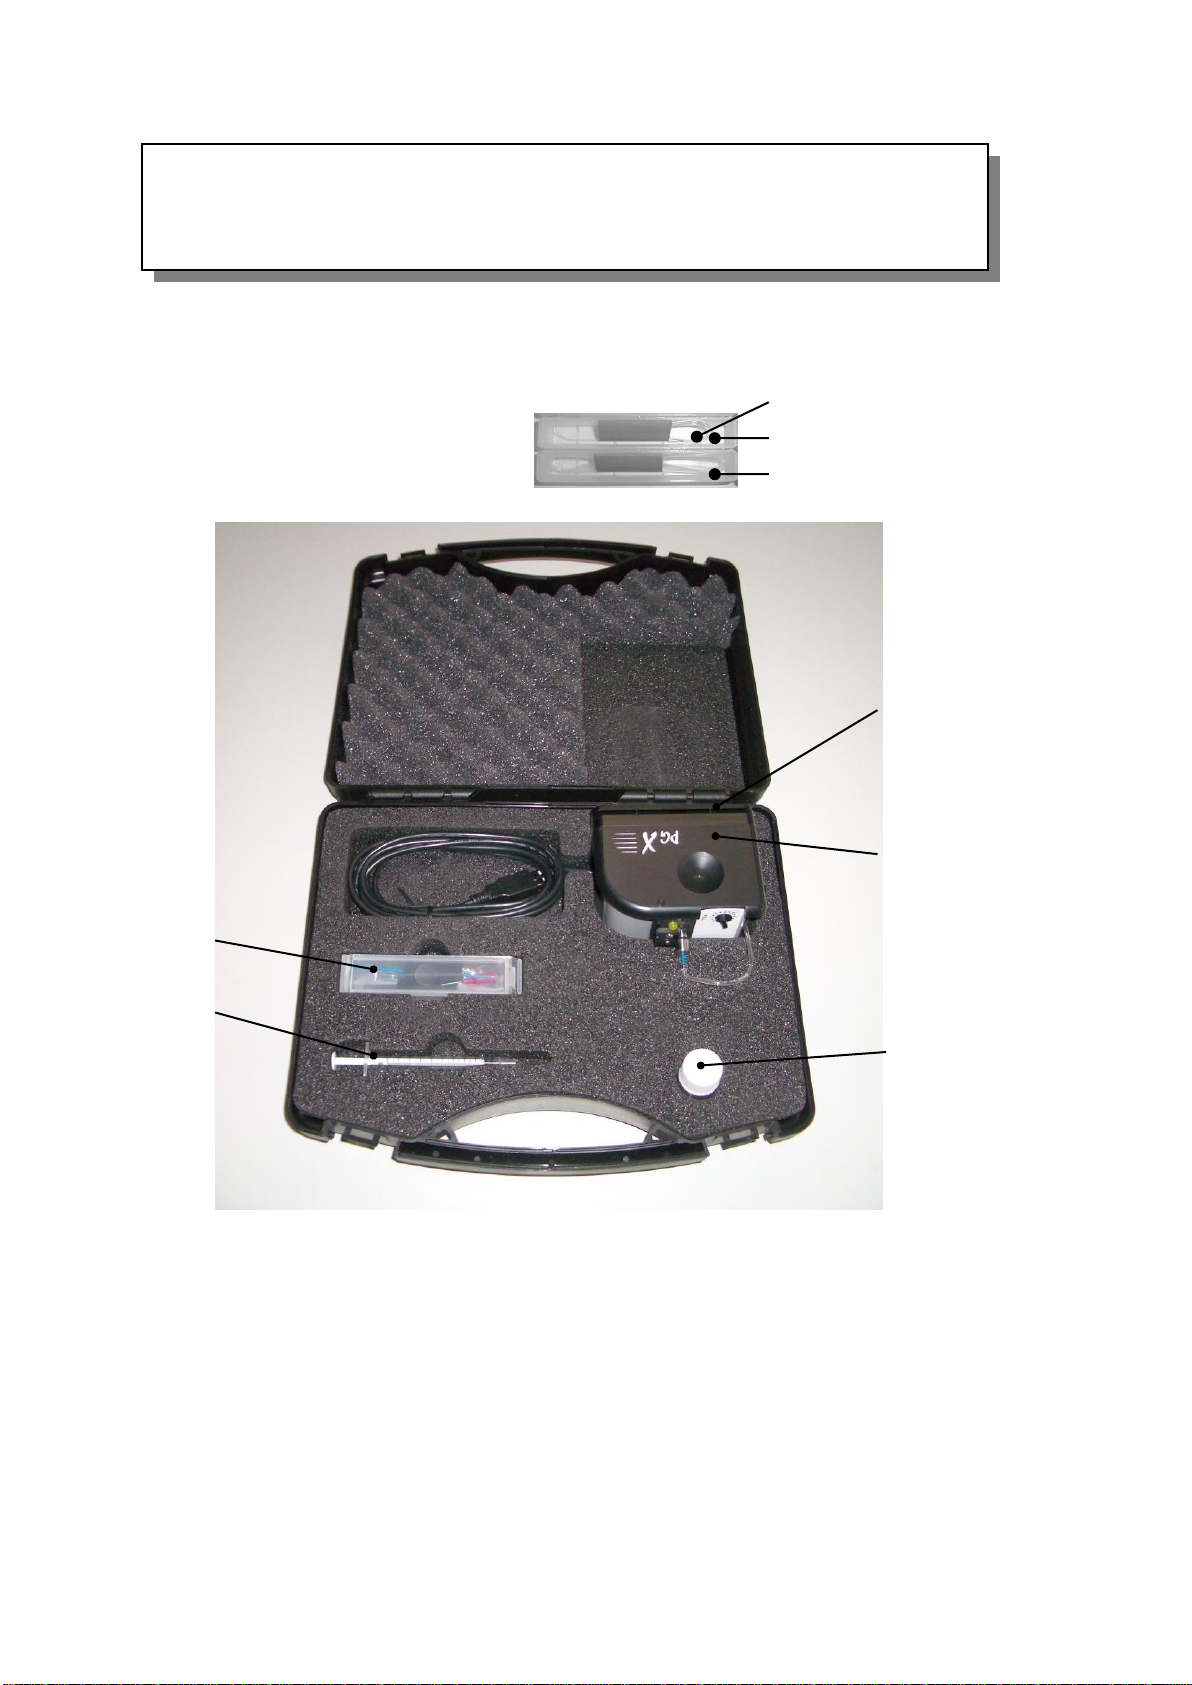
Fig. 1.2 PGX+ Accessory Kit
Syringe Tip (P/N 1100250)
Pump Tubing (P/N 860341)
Applicator Tubing (P/N 860314)
1. Unpacking your instrument
Your PGX+instrument is delivered in a carrying case including
-the PGX+software on a CD
-a one millilitre syringe
-a calibration plate
-a glass bottle
-a PGX+Accessory kit
2. Technical requirements
This version of the PGX+software can be installed under the following operating systems:
Windows 10
Windows 8
Windows 7 (32/64-bit)
Windows XP
Vista 32/64
Please note the PGX+ instrument cannot be installed under Windows NT, as this
operating system does not support the use of USB ports.
PGX Instrument
Calibration plate
Syringe
Accessory Kit
Fig.1.3 PGX+ Instrument Case
Glass bottle
This User’s Manual supports all models of the PGX+ Measuring Head
in combination with the PG program version 4.0
5
3. Installing the PGX+software
Your software is delivered on a CD located under the instrument padding inside the case.
DO NOT download new camera drivers from Internet even when Windows may suggest this as
program performance might then become unreliable!
DO NOT connect the PGX+instrument to the USB port until requested by the program!
Otherwise Windows will attempt to search for other drivers and the result is unpredictable.
a) Insert the CD to start the installation and follow the displayed instructions.
b) The application software is then installed automatically and a message
” Software has been successfully installed” should appear on the screen.
c) Finally a message may appear ”This system must be restarted to complete the installation”
Press [OK] to continue.
d) Connect the PGX+ instrument to the USB port you wish to use.
e) Start the application from the PGX+ icon on the Desktop or from C:\fibro\bin\PGPlus .EXE.
Successful installations will recognise the camera inside the PGX+ instrument and an image
should appear in the Live Image Screen.
IMPORTANT NOTICE
Use the UserID and password supplied with your instrument to register your purchase at
www.pocketgoniometer.com. Here you can download free, future versions of the PGX software, new
User’s Manuals and domestic language files as they become available. If you do not have this login
information, please send your details (name, company name and instrument serial number) to
info@pocketgoniometer.com and we will assist you.
6
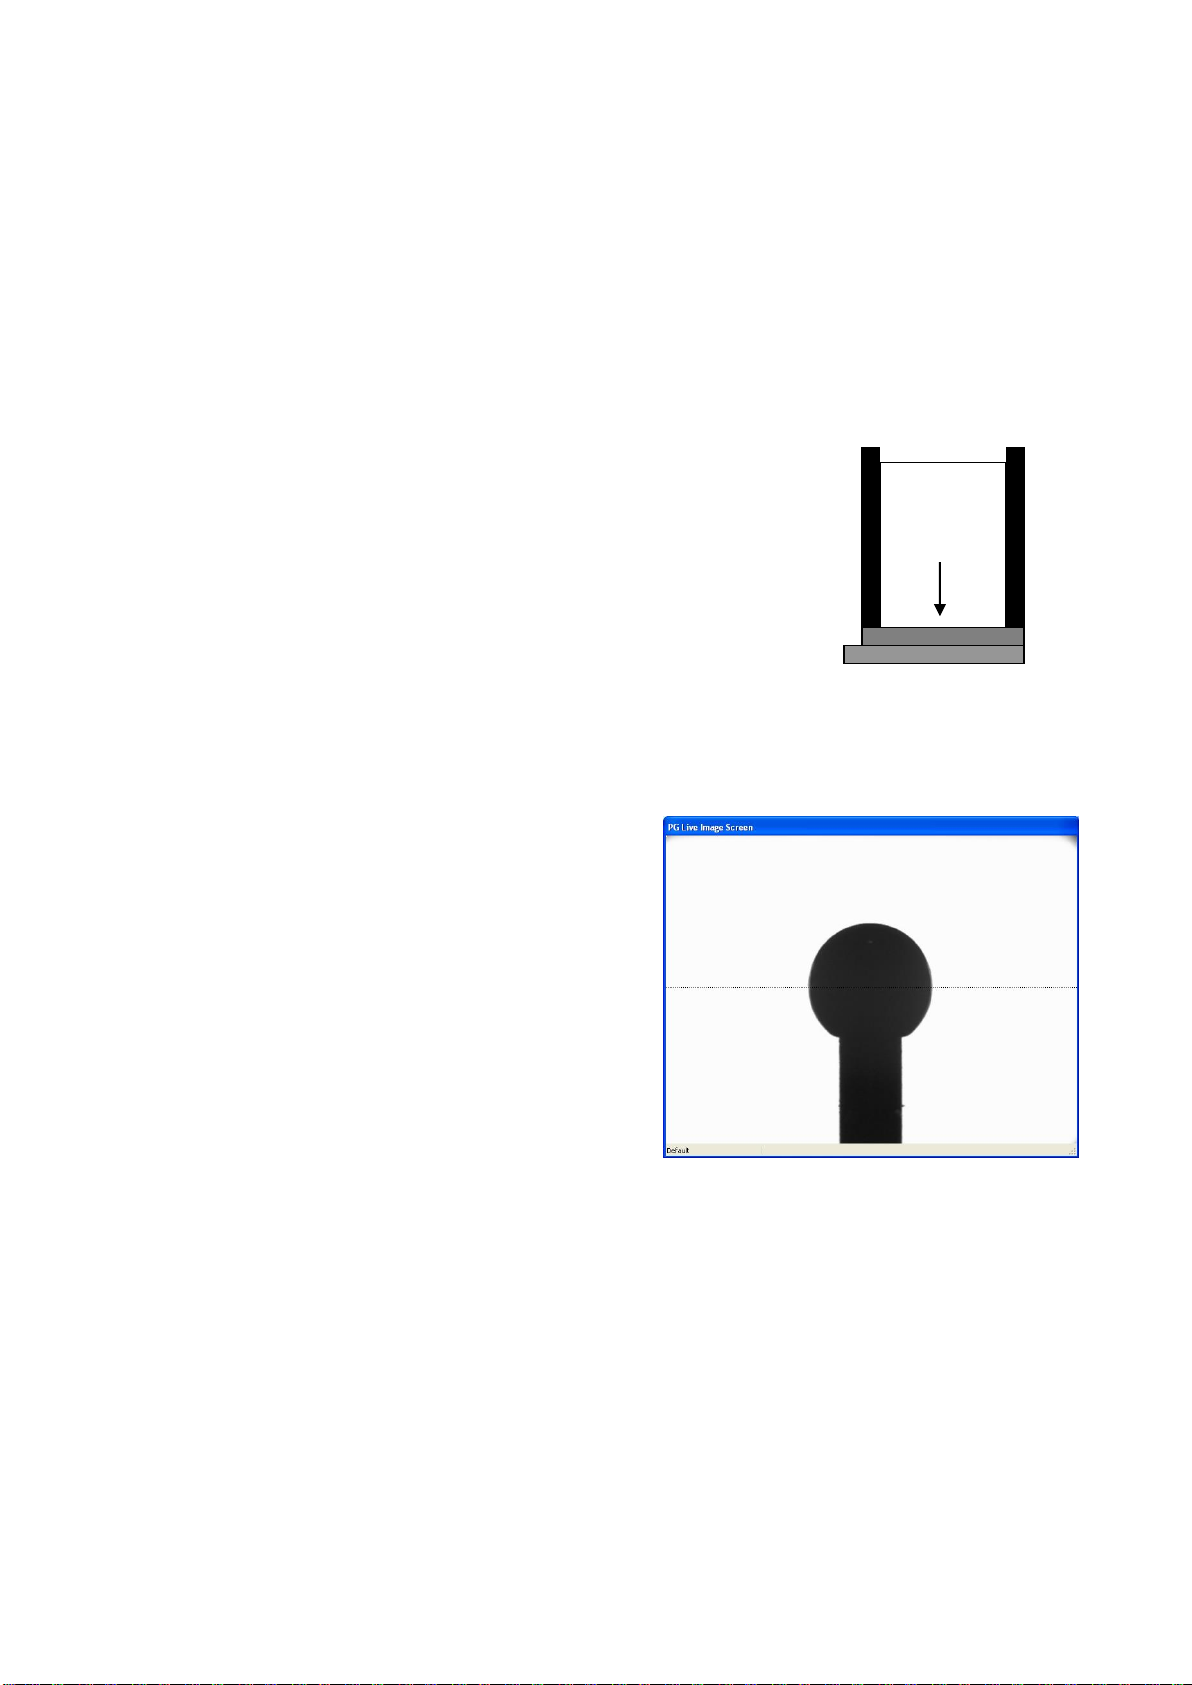
Fig 4.1 PGX Reference mark
Fig 4.2 Calibration plate with a steel ball
4. Calibration and Validation
Your PGX+instrument has been carefully assembled and checked during production.
It should not be necessary to do any further adjustments. For a correct performance, however, the
instrument must be calibrated according to the procedure below. Without a correct calibration the
instrument readings will be incorrect.
Before calibration, your instrument should be connected to the
USB port for 30-60 minutes in room conditions. Make sure the drop applicator is installed to avoid
stray light shining into the instrument as this may have an impact on the calibration.
4.1 Calibration Procedure (Perspex plate)
a) The steel ball must have its top 2.6-3.0 mm above the Perspex surface.
With a steel ball outside these dimensions calibration might fail.
b) Select “Calibrate” from the Image Control Panel.
c) Locate the reference mark at the edge of the instrument sole.
The calibration plate has a similar mark indicating the”full sphere”.
Place the PGX+instrument on top of the calibration plate with its
reference mark positioned above the dot as indicated in Figure 4.2.
Push gently on top of the instrument to make sure the instrument
rests firmly against the calibration plate surface.
d) Click on the [Start] button to find the optimum Threshold setting.
e) Next the automatic scale factors are determined from
the image. This is a high precision operation, which
requires a clean sphere. If defects are detected an
error message ”Unable to find sphere” will appear. If
debris is found at the sphere contour, remove the
instrument from the calibration plate and clean the
steel ball with a cotton swab dipped in Isopropanol.
Select “Camera” and “Calibrate” to restart the
calibration routine.
f) When the calibration routine has terminated, the
results are displayed for the semi-sphere above the
diameter with the following target numbers:
- Height (c-top) = 1,00 ± 0.02 mm
- Diameter = 2.00 ± 0.04 mm
- Volume = 2.09 ± 0.4 µl
- Contact Angle = 90.0 ± 1°
Accepted values will appear in green.
g) Click on [Save] to store the calibration data.

7
4.2 Validation Procedures
To verify a correct instrument reading it is much faster to “validate” the instrument using one of the
two validation procedures described below. It is recommended to validate the instrument readings at
regular intervals.
Standard Calibration plates (Perspex)
Select “Calibrate” from the Image Control Panel and place the PGX+ instrument on top of the full
sphere and push the instrument gently against the calibration plate surface. This “artificial droplet” is
now measured continuously. If the data are inside the tolerances, all numbers will be displayed in
green. If one or more numbers are displayed in red, the instrument must be re-calibrated (Section 4.1).
An optional way to validate the instrument is to place the instrument on top of the calibration
plate and perform a measurement in Static Mode. If these values are regularly stored, this information
can be used for monitoring of the calibration/validations.
ISO Calibration plates (metal)
Select “Calibrate” from the Image Control Panel and place the PGX+ instrument on top of the semi-
sphere and push the instrument gently against the calibration plate surface. This “artificial droplet” is
now measured continuously. Enter the height of the reference found on the calibration plate. If the data
are inside the tolerances, all numbers will be displayed in green. If one or more numbers are displayed
in red, the instrument must be re-calibrated (Section 4.1).
8
5. Setting up the PGX+ instrument
Insert the Pump Dispensing Unit into the centre of the Applicator Tube.
The dispensing tip should now appear at the top of the live video image
5.1 Preparing a specimen
a) Prepare a specimen as described in Section 6.1.
b) Place the PGX+ instrument on top of the specimen.
c) Check to make sure the test surface appears horizontally in the image.
Soft and warping materials should be placed on a proper backing to hold it flat.
A good backing is flat, stiff and coated with a soft-sticky surface, which does not pull lint from the
specimen surface when removed.
5.2 Special specimens
In certain applications, the test might require special arrangements like a fixture, into which the test
specimen can be inserted. One example is a metal can or a round glass bottle where it will be
necessary to position the droplet at the highest point of the curved surface.
Please note the groove at the centre of the instrument sole!
If the instrument is placed perpendicular across a test object with small radius (Figure 5.1) the test
surface will appear higher in the image than normal. The instrument can then be placed in the direction
of the object axis (Figure 5.2).
We can also provide special PGX+ accessories for testing on electronic circuit boards and tablets.
Contact your instrument supplier for additional information.
Fig. 5.1 Testing curved surfaces perpendicular
to the object axis
Fig. 5.2 Testing curved surfaces in the direction
of the object’s axis
9
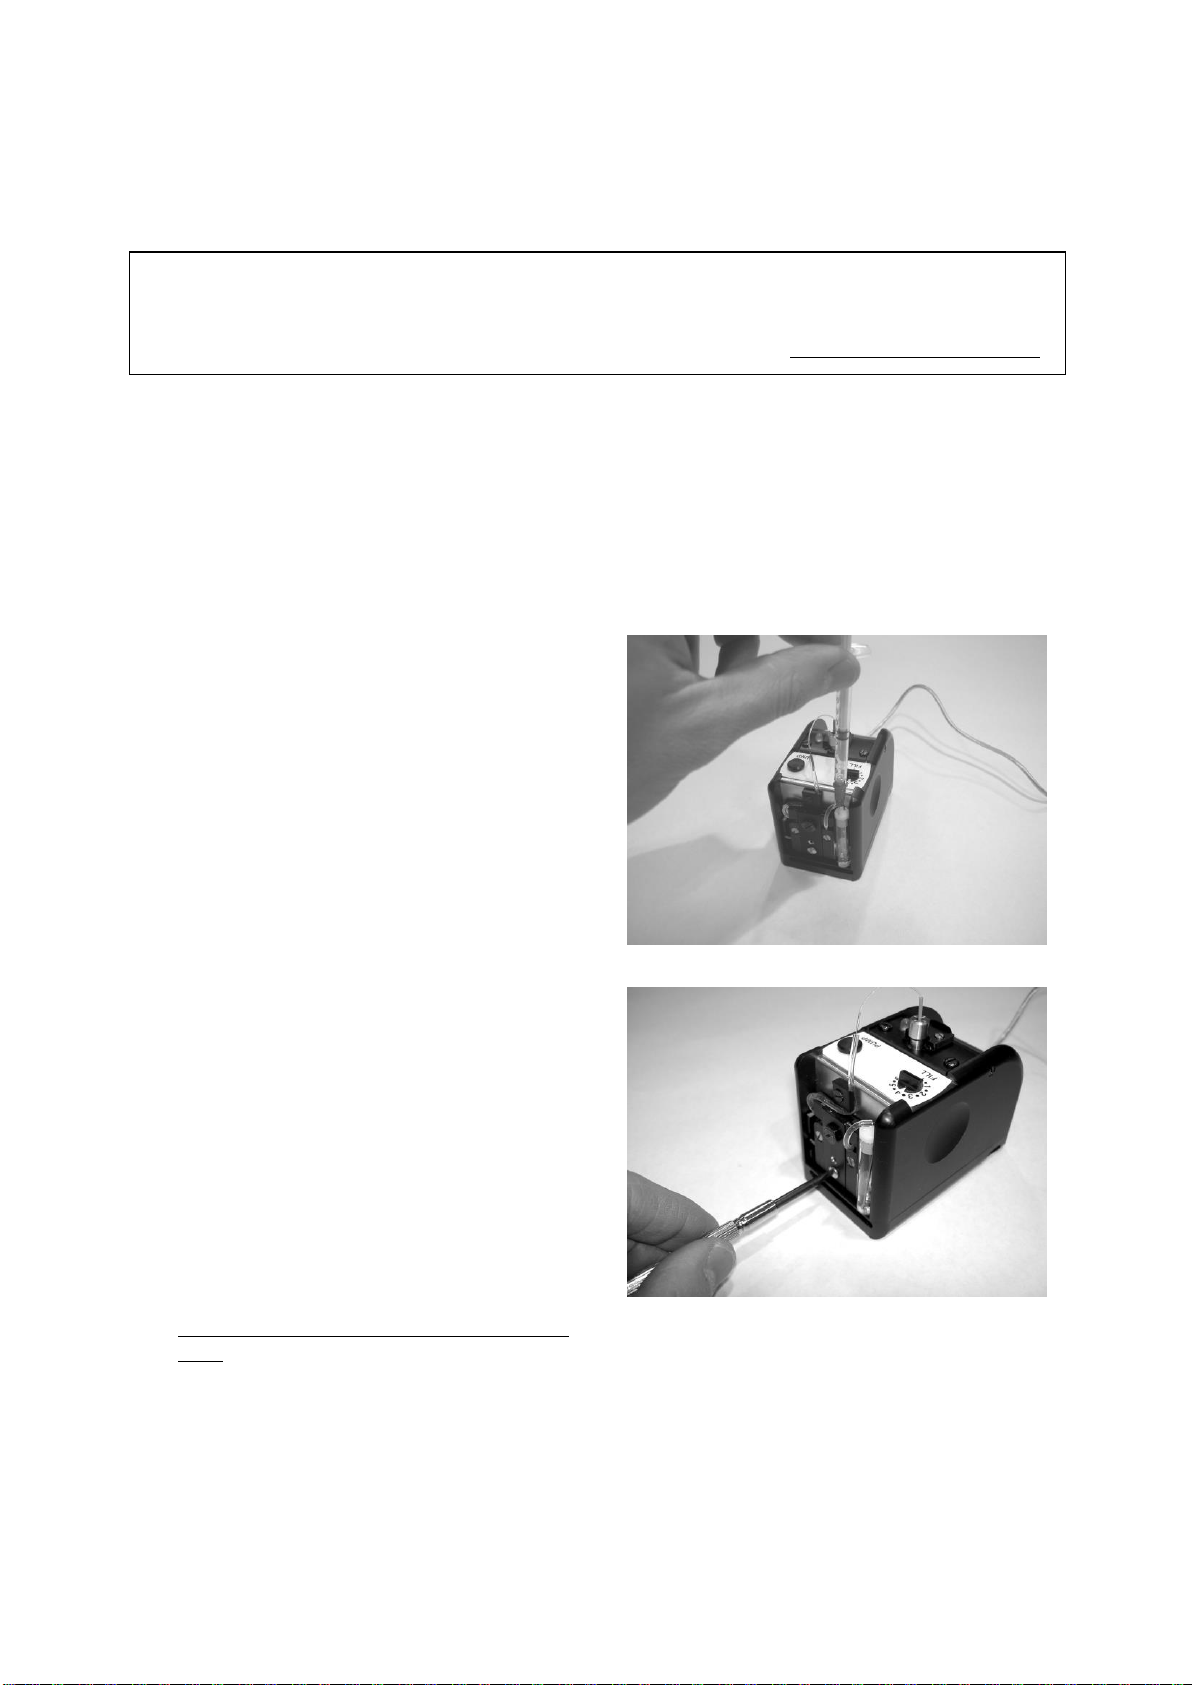
5.3 The Pump Dispenser
The test liquid is applied from the built-in micro-pump via the pump applicator unit. It is suggested the
pump system is used for a single standard test liquid (e.g. water or fountain solution).
The integrated micro pump is designed for a standard liquid (e.g. water) where the droplet size can be
set in steps of 0,5 µL. Press the PUMP button to pump out a new droplet.
- If PUMP is pressed until the LED is lit, the droplet is slowly lowered towards the test surface, which
is recommended for measurements in Static Mode;
- If PUMP is pressed momentarily, the LED will blink while the droplet is pumped out. It is then lifted
a short distance from which it is dropped towards the surface. This approach is recommended for
Dynamic Mode measurements.
- Press PUMP a second time during the pump sequence to inhibit application of the droplet.
The liquid system is filled in the following way:
a) Place the instrument on top of a flat surface
b) Locate the tiny air hole on top of the white
container lid. Use the attached one millilitre
syringe with the RED tip to fill the container
with distilled water.
DO NOT use tap water, as this will leave
residuals inside the liquid system!
c) Insert the RED dispensing tip into the air hole to
fill the container. Check top of liquid container
to see when liquid container is full (Figure 5.3).
d) Check the pump lid screw is tightened.
e) Fill the pump tubing like this:
- Set the volume selector to position FILL.
- Press PUMP and the pump will be activated
to give 50 pump strokes before it stops.
This volume (25 µL) may produce a small
droplet at the dispensing tip. If not, press once
more on the PUMP button to restart pump.
When all air is removed and a droplet appears at
the dispensing tip:
press and hold the PUMP button until pump
stops.
f) Set the volume selector to “4,0 µL”, which is the default droplet size for testing (see Appendix A).
g) The instrument is now ready for a test (see Section “7. Test modes”).
Use different tubing for each test liquid to avoid contamination!
To pump liquids of higher viscosity, or to determine the “wetting hysteresis” (advancing/receding
contact angles), it will be necessary to use the optional PG Dosing Unit (www.pocketgoniometer.com)
Fig. 5.4 Tighten the pump lid screw
Fig. 5.3 Filling the Liquid Container

10
6 Miscellaneous
6.1 Sample preparation
a) Determine and mark the machine direction of each sample where applicable.
Be careful not to touch the areas to be tested, or contaminate them in any other way.
b) Determine and mark the “top” and “back” sides of each sample based on the side relevant for the
application. The test areas must be free of folds, wrinkles, blemishes, watermarks and other
defects not normally inherent in the sample.
If the PGX+ instrument is used in the MD direction and then the CD direction, the ratio between
BaseCD to BaseMD at an agreed time (e.g one second) can be used to determine the anisotropy of a
surface. For testing of anisotropic surfaces (e.g. newsprint) the PGX+ instrument should be oriented
at a 45° angle to the machine direction when it is not necessary to determine the degree of anisotropic
response.
Soft materials (e.g. tissues, textile, film) or warping materials (e.g. newsprint, cigarette tipping
paper) should be mounted on top of a flat backing material using a soft-sticky adhesive material.
6.2 Setting up a test
a) Check the liquid container in the pump is not empty
b) Check your PGX+ instrument is connected to the USB port
c) Start the PGX+ program
A live video image should now appear in the Live Image Screen
d) Prepare a specimen as described in section 6.1
e) Select the requested droplet size.
f) Press PUMP to pump out a droplet, which is then automatically applied as follows:
- in Static Mode, keep PUMP pressed until the LED is lit and the droplet will be slowly lowered
towards the test surface;
- in Dynamic Mode, press PUMP momentarily and the LED will blink while the droplet is
pumped out and then lifted a short distance from which it is dropped.
Press PUMP a second time while pumping to inhibit drop application
g) Slide the instrument sideways to a new test position.
h) Pump out a new droplet at the dispensing tip and apply the droplet for a Static or Dynamic test as
described in Section “7. Test modes”.

11
6.3 Instrument storage
The liquid system (dispenser, tubing and liquid container) should never be left with a liquid for a long
time as this may clog the system. The procedures below are recommended when your PGX+ is to be
stored for some time or shipped to another location.
When using the PGX+ with liquids other than water (e.g. solvents, inks) it is necessary to clean the
liquid system after the test has been finished. If the instrument will be stored for some time it is also
recommended to empty the liquid system in the following way:
a) Release the pump lid screw to access the pump tubing
b) Lift out the liquid container, remove the plug and the empty container
c) Blow liquid container dry with air
d) Connect syringe with the RED tip to the dispensing tip and pump air through the tubing until dry
e) Push the plug back into liquid container top and re-install the container
f) Put the pump tubing in position
g) Re-install the pump lid and secure the pump lid screw gently
DO NOT tighten the pump lid screw completely when stored!
6.4 Transportation
Before shipping, the instrument should be prepared as described in section 6.3 above.
Please note it is important to empty even a water-based system completely if shipping might include
airfreight at high altitude as this might cause freezing damages.
Always ship the instrument in a complete case with all instrument accessories.
Make sure the case is shipped in sufficient padding to avoid damaging the instrument case and its
contents.

12
7. Test modes
The PGX+ software measures contact angles on solid surfaces in Static and Dynamic mode
as described below.
7.1 Drop application in Static Mode
a) Place the PGX+instrument on top of the test surface.
b) Select the requested droplet size and press the PUMP button until the LED is lit.
The droplet is now pumped out and then slowly lowered towards the test surface.
To inhibit automatic drop application, press PUMP a second time while pumping is in progress.
The droplet can then be applied manually by pressing on top of the applicator.
After droplet has been applied, three different
situations may occur, which can be described as
-A “pendant” droplet hanging at the
dispensing tip (Fig 7.2). To transfer droplet,
apply a slightly bigger droplet or move the
dispensing tip closer to the test surface.
-A “released” droplet, (Fig 7.3)
which is immediately transferred to the
specimen upon contact with the surface.
-A “trapped” droplet, (Fig 7.4)
which is in contact with the specimen surface
but has not released from the dispensing tip.
Move instrument to a new test position and try
using a smaller droplet size or increase distance
between dispensing tip and specimen surface.
The principle for contact angle measurements in static mode at “equilibrium” is only valid for
substrates where the test liquid does not penetrate into or reacts chemically with the specimen surface.
The substrate should also be smooth and non-porous.
It might be necessary to wait until “equilibrium” is obtained before a measurement is done.
Fig 7.1 PGX instrument on a flat test surface
Fig 7.3 Released droplet
Fig 7.4 Trapped droplet
Fig 7.2 Pendant droplet

13
7.2 Automatic testing in Static Mode (Section 9.3)
This test gives a single measurement of contact angle, volume and droplet base width after the droplet
has reached its “equilibrium” condition. Static contact angle is applicable to solid materials into which
the test liquid does not penetrate. A test surface is usually characterised from an average of 6-10 test
droplets and one or more additional surfaces can be tested in the same test run for comparison in the
same diagram. Static contact angle is primarily used to determine the wetting characteristics of a
substrate to check surface treatment, cleanliness and/or contamination effects. The purpose of this test
is to determine the highest possible contact angle at “equilibrium”.
a) Select the “Static” function in the program.
b) Select the requested droplet size.
c) Press the PUMP button until the LED is lit. A droplet is now pumped out and then slowly lowered
towards the test surface.
d) Wait until the droplet has reached the “equilibrium” condition, which may take several seconds.
e) Click on “Measure” to get a reading and a new data set will appear in the Results window.
Right-click on “Measure” to activate the AutoRepeat function capturing an image sequence.
f) A single result can be erased if the result line is selected and the Delete button is pressed.
g) Slide the instrument sideways to a new position.
h) Select “Save” to store results when the batch is finished.
Always slide the PGX+ instrument sideways to prevent the liquid droplet from reaching
the lens and the mirror!
To test for ‘equilibrium’ condition, click on” Measure” repeatedly a few times or activate the
AutoRepeat function while to capture an image sequence while the droplet rests on the surface. At
‘equilibrium’, the test result should remain stable.
A single droplet applied on the surface can be studied as a function time if multiple images are
captured at a fixed time interval. Click on “Measure” with the right hand mouse button to activate the
“AutoRepeat” function (Section 9.3).
7.3 Drop application in Dynamic Mode
In Dynamic Mode the droplet cannot be applied “slowly onto the surface” as in Static Mode.
Such a slow application would make the initial interaction during the first second impossible to
measure. Instead the droplet is gently transferred to the surface from a very short “free-fall” distance.
a) Place the PGX+ instrument on top of the test surface.
b) Select the requested droplet size and press the PUMP button momentarily.
The LED will now blink and the droplet is slowly raised to a preset height from which it will fall
towards the surface. The falling droplet will trigger the image capturing.

14
Three different situations may occur, which can be described as
-A “pendant” droplet hanging at the dispensing tip (Fig 7.5).
To transfer droplet, apply a slightly bigger droplet to overcome the adhesion between the droplet
and the dispensing tip or reduce the distance between the droplet and the surface. As the droplet
was not applied on the surface, the image capture is not triggered.
-A “released” droplet, (Fig 7.6), which will automatically trigger the image capture as the droplet
contacts the surface. In this case, a measurement is performed and the test will run until the
requested test time has elapsed or the droplet has disappeared from the surface.
-A “trapped” droplet, (Fig 7.7), which is in contact with the specimen surface but
has not initially released from the dispensing tip. An image capture is triggered
upon contact but all images will be displayed as “zero results”. Move the
instrument to a new test position and try a smaller droplet size or increase the
distance between the dispensing tip and the specimen surface.
The principle for contact angle measurements in dynamic mode is to capture the interaction
between a liquid and a substrate as a function of time, while the liquid droplet penetrates into or
spreads across the surface.
7.4 Automatic testing in Dynamic Mode (Section 9.4)
In this test mode a sequence of images is automatically captured as soon as the falling droplet arrives
on the specimen surface. Each recorded image is analysed and the result is presented as a curve
showing the dynamic change in contact angle (wetting), volume (absorption) and spreading as a
function of time. This test is particularly useful for troubleshooting problems related to dynamic
processes such as printing, gluing and coating applications.
a) Select the “Dynamic” function in the program.
b) Adjust the distance between dispensing tip and test surface to allow for a pendant droplet of the
selected size.
c) Select a suitable Drop Timeout.
d) Press the PUMP button twice to pump out a droplet and inhibit application of the droplet.
Check the droplet is not too close to the surface to risk a contact.
Then push gently on top of drop applicator to remove droplet from the dispensing tip.
e) Slide the PGX+ instrument sideways to a new test position.
f) Press PUMP momentarily to pump out a new droplet (LED is now blinking).
Fig 7.6 Released droplet
Fig 7.7 Trapped droplet
Fig 7.5 Pendant droplet

15
g) Immediately click on the Measure button to request a new measurement.
As the droplet falls towards the surface a test sequence is automatically triggered.
Please note the droplet must fall within 30 seconds after you have clicked on Measure.
h) The camera captures up to 80 images during the first second of contact. After the first second,
images will be captured at a lower rate until the droplet has vanished from the surface or the
selected test time has elapsed. A dynamic curve is then displayed in the Diagram Window together
with a list of all data.
i) A single data point can be erased if a result line is selected and the Delete button is pressed.
It is also possible to select a data point by clicking in the diagram.
j) Repeat steps (e)-(i) above for 6-10 test positions.
k) A solid line in the Diagram Window represents the average result.
Browse through the different drop results to detect possible “outliers” far away from the average.
Click on the associated check box to exclude outliers from the average batch result.
l) Select “Save” to store results.
As an option, all images in a sequence can be stored.
To store single images, double-click on the result line to bring up a particular image.
This image can then be saved or analysed manually (see Section 9.5).
Always slide the PGX+ instrument sideways to prevent the liquid droplet from reaching
the lens and the mirror!
7.5 Automatic determination of the Advancing / Receding contact angles (Section 9.6)
In some applications it is of interest to characterise the “wetting hysteresis” of a surface.
The purpose is to determine the “highest” contact angle as the liquid spreads across the dry surface
and the “lowest” contact angle as the liquid retracts from the wet area on the surface. These two
contact angles, referred to as the advancing/receding contact angles describe the “wetting hysteresis”.
See Section 9.6 for details on how to run this test.
8. Reports (Section 9.8)
To generate a report from a previously saved measurement, select the “View” option.

16
9. The PocketGoniometer program
Apart from the main program screen, there are two additional screens; the Image Control Panel and
the Live Image Screen. The Live Image Screen will always reside on top of the other screens, but its
size is adjustable to not interfere with other windows. Double-click on the image to switch the live
image between greyscale and binary (black/white) mode.
9.1 The Image Control Panel
The control panel functions are divided into four
areas to modify the camera settings, define a
region of interest in the captured image, to define
a target range for determined data and to calibrate
the system. When a new set of test parameters has
been defined the test conditions can be assigned to
a test button which is named by the operator. This
way a previously defined test can be restored at a
later time.
The active button is indicated by a green light.
When the setting of a button is modified, this
indicator turns orange. To assign new test
parameters to a button, click it with the right-hand
mouse button and click SAVE when finished.
PLEASE NOTE the button NORMAL is
default and cannot be assigned new values.
Camera –Gain offset
This feature modifies the live camera image in real time. This way the full dynamic range is always
available even when the test substrate appears ”too dark” or ”too bright” due to variations in light
reflectance.
Enhance - This feature brings out the droplet image even in situations where the droplet base is
partially hidden on a dark, light-absorbing surface (see Section 9.12 for more details).
Region - With these controls a selected region of interest can be defined to exclude shadows and other
artefacts in the image that may disturb the image analysis. The horizontal bottom line and the top line
are absolute limitations as no analysis is done outside these limits. The vertical limitations are used to
create a ”path” through which the top of the droplet can be detected. Once the droplet’s top is found
the contour will be traced down to the bottom line even if the contour is located partially outside the
vertical limits for the region.
Fig. 9.1 Image Control Panel & Camera controls
Fig. 9.2 Live Image Screen with Regions
Fig. 9.3 Image Control Panel & Region controls

17
Target limits
When a test result is expected to fall within a
specific range, the corresponding min and max
values can be entered into these fields. When a test
result falls outside the specified range, this value
will appear in red.
Calibrate
The automatic calibration is used to determine the
correct light settings and the exact size of an
artificial droplet placed in front of the camera.
For a detailed description of the calibration
procedure, see Section 4.1.
9.2 The Main program
This section describes the functions available in the main program screen.
Static Mode is designed to capture a single reading of the static contact angle at ”equilibrium”.
This value can be measured on smooth, non-porous surfaces not penetrated by the
test liquid. Typical examples are water droplets on hydrophobic release papers and
polymer barriers (e.g. liquid container board).
Dynamic Mode captures a video sequence during the interaction between the liquid and the surface.
Here the dynamic wetting (contact angle), liquid penetration (volume) and
spreading are measured as a function of time.
Advancing Mode is designed to characterise the “wetting hysteresis” as a liquid droplet advances
across a dry surface and then retracts from a wet surface. This measurement
requires a reversible pump flow, which is not possible to do with the micro pump
built into the PGX+Measuring Head.
SuperLow Mode is designed for measurement of very low static contact angles below 10 degrees
related to super clean surfaces.
View Mode produces a report from previously saved data.
Surface Tension enables testing of the purity of the test liquid.
A sufficiently big pendant droplet is pumped out at the dispensing tip and the
surface tension is determined from the droplet shape.
Surface Energy must be determined from calculations using contact angles. Different models exist
for these calculations using one, two or more liquids in specific combinations.
Options opens a window with the current configuration settings and additional help text.
This screen is also used for diagnostics and selection of different languages.
Fig. 9.4 Image Control Panel with Targets

18
9.3 Static Mode
This mode captures single readings of the static contact angle at ”equilibrium” each time the Measure
button is pressed. Please note static contact angle measurements are only valid on smooth, non-porous
surfaces not penetrated by the test liquid. Typical examples are water droplets on hydrophobic release
papers and polymer barriers (e.g. liquid container board).
When a test liquid of higher viscosity is used, the reading must not be taken until the droplet has
stopped spreading on the substrate surface. If repetitive readings are taken while the droplet spreads,
the equilibrium condition has occurred when the contact angle does not decrease any further.
The Diagram window at the top of the screen is updated after each measurement with a new data
point showing the contact angle, drop volume, droplet base or droplet height.
The Results window is updated with a new data set after each measurement.
How to remove a single data point
Click on a line in the Results window to highlight it and press Delete.
How to correct a “zero result” or make a manual reading
A “zero result” usually indicates the test is incorrectly set for a very dark or bright test surface. This is
easily corrected by changing the camera settings in the Image Control Panel. In addition these new
settings can be given its own test button, which makes it easy to set up different tests for very dark or
shiny test surfaces. Alternatively an occasional “zero result” can be rescued using the manual
approach described in Section 9.5 of this User’s Manual.
Fig. 9.5 Main Program screen in Static Mode

19
AutoRepeat function
Normally a single image is captured each time Measure is activated. Right-click with the mouse on
this button to open the AutoRepeat option where a number of images can be captured at user defined
intervals. Right-click the button again to restore its original function.
Remote Control function
This option offers selection of droplet size and different drop application modes directly from the PC
keyboard without accessing the PGX+ instrument (see section 10 for details).
Control Buttons
_Measure _Captures a single image for analysis.
_AutoRepeat Captures a single image for analysis.
_Display Opens a large format instrument panel to display the results.
New _Prompts the user to save existing data and opens a new batch.
_Open _ A previous batch of data is re-opened and new tests can be appended to it.
Save _ Stores the batch results under a filename (*.PGS) selected by the operator.
The file extension PGS will be different if one of the pre-defined test liquids
has been selected (e.g. Water will give the extension WGS).
Exit _ Prompts the operator to store pending data before the program is terminated
For automatic calculation of SFE (Surface Free Energy) the operator can select a liquid from the
following options:
Water
DIM (Synonyms:Diiodomethane; Methane; Methylene)
Formamide (Synonyms: Methanamide; Carbamaldehyde)
Other
Depending on this selection, the result file will get an extension of wgs, dgs or fgs used as a liquid tag.
When the option ‘Other’ is selected, the default file extension pgs will be used.
For corona treated polymers water can be used as the single liquid to determine SFE in
accordance with ASTM D5946-0. The SFE result is then presented directly in the Static window when
the ASTM parameter is set to “ON” in the Options Page.
To use the contact angle results for subsequent determination of SFE, all related result files must
have the same filename for automatic location of associated files (e.g. 45901.wgs and 45901.dgs).
See Section 9.10 for more details.

20
9.4 Dynamic Mode
This mode captures a video sequence showing the dynamic interaction between the liquid and the
surface. Here the dynamic wetting (contact angle), liquid penetration (volume) and spreading is
measured as a function of time. After a droplet has been pumped out at the dispensing tip, a new test is
started when the Measure button is pressed. The droplet must then be applied on the specimen surface
within 30 seconds (see Section 7.4 for details).
The Diagram window at the top of the screen is updated after each measurement with a new set of
data points showing the dynamic change in contact angle, drop volume, droplet base or droplet height
as a function of time. When two or more droplets have been tested, the average response for the
droplets in a batch is displayed as a continuous line.
PLEASE NOTE: A drop result is excluded from the batch result if the tick box is left unchecked.
The Results window is updated with a new data set as soon as a new measurement is done. Each line
corresponds to a specific image captured at the indicated time. Click on a data set to the left of the
diagram to highlight it and the corresponding data will appear in the Results Window.
How to delete a droplet result
Uncheck the tick box in front of the data set to exclude it from the batch data.
You can also click on a data set to highlight it and then use the ReDo function to replace the existing
data with a new measurement.
Fig. 9.6 Main Program screen in Dynamic Mode
Table of contents
Other TMI Products Test Equipment manuals


