Valeport Hyperion 0901001 User manual

HYPERION OPTICAL SENSORS
OPERATING MANUAL
Document No:
MANUAL-360093108-14 | issue: 2.1
Date:
March 2023
This document was prepared by Valeport Limited, the Company, and is the property of the
Company, which also owns the copyright therein. All rights conferred by the law of the copyright
and by virtue of international copyright conventions are reserved to the Company. This document
must not be copied, reprinted or reproduced in any material form, either wholly or in part, and the
contents of this document, and any method or technique available there from, must not be
disclosed to any other person whatsoever without the prior written consent of the Company.
Valeport Ltd
St Peter's Quay
Totnes, Devon TQ9 5EW
United Kingdom
Phone:
email:
Web:
As part of our policy of continuous development, we reserve the right to alter, without prior notice,
all specifications, designs, prices and conditions of supply for all our equipment

Table of Contents
©2023 –Valeport Ltd
Page | 2
Table of Contents
1 Introduction - Hyperion Optical Sensor ........................................................................................... 3
1.1 Fluorophore & Nomenclature .............................................................................................................. 3
1.2 PCB Update........................................................................................................................................... 3
1.3 Calibration Update ................................................................................................................................ 3
2 Sensors................................................................................................................................................ 4
2.1 Fluorometers ......................................................................................................................................... 4
2.1.1 Chlorophyll a ......................................................................................................................................................4
2.1.2 Fluorescein (Uranine).......................................................................................................................................4
2.1.3 Phycocyanin.......................................................................................................................................................5
2.1.4 Rhodamine WT ..................................................................................................................................................5
2.1.5 Sulforhodamine B .............................................................................................................................................5
2.1.6 Safety Statement...............................................................................................................................................6
2.2 Linear Observation Range.................................................................................................................... 6
2.3 Quenching ............................................................................................................................................. 7
2.4 Turbidity ................................................................................................................................................. 8
2.4.1 Turbidity Units....................................................................................................................................................8
2.4.2 Safety Statement...............................................................................................................................................8
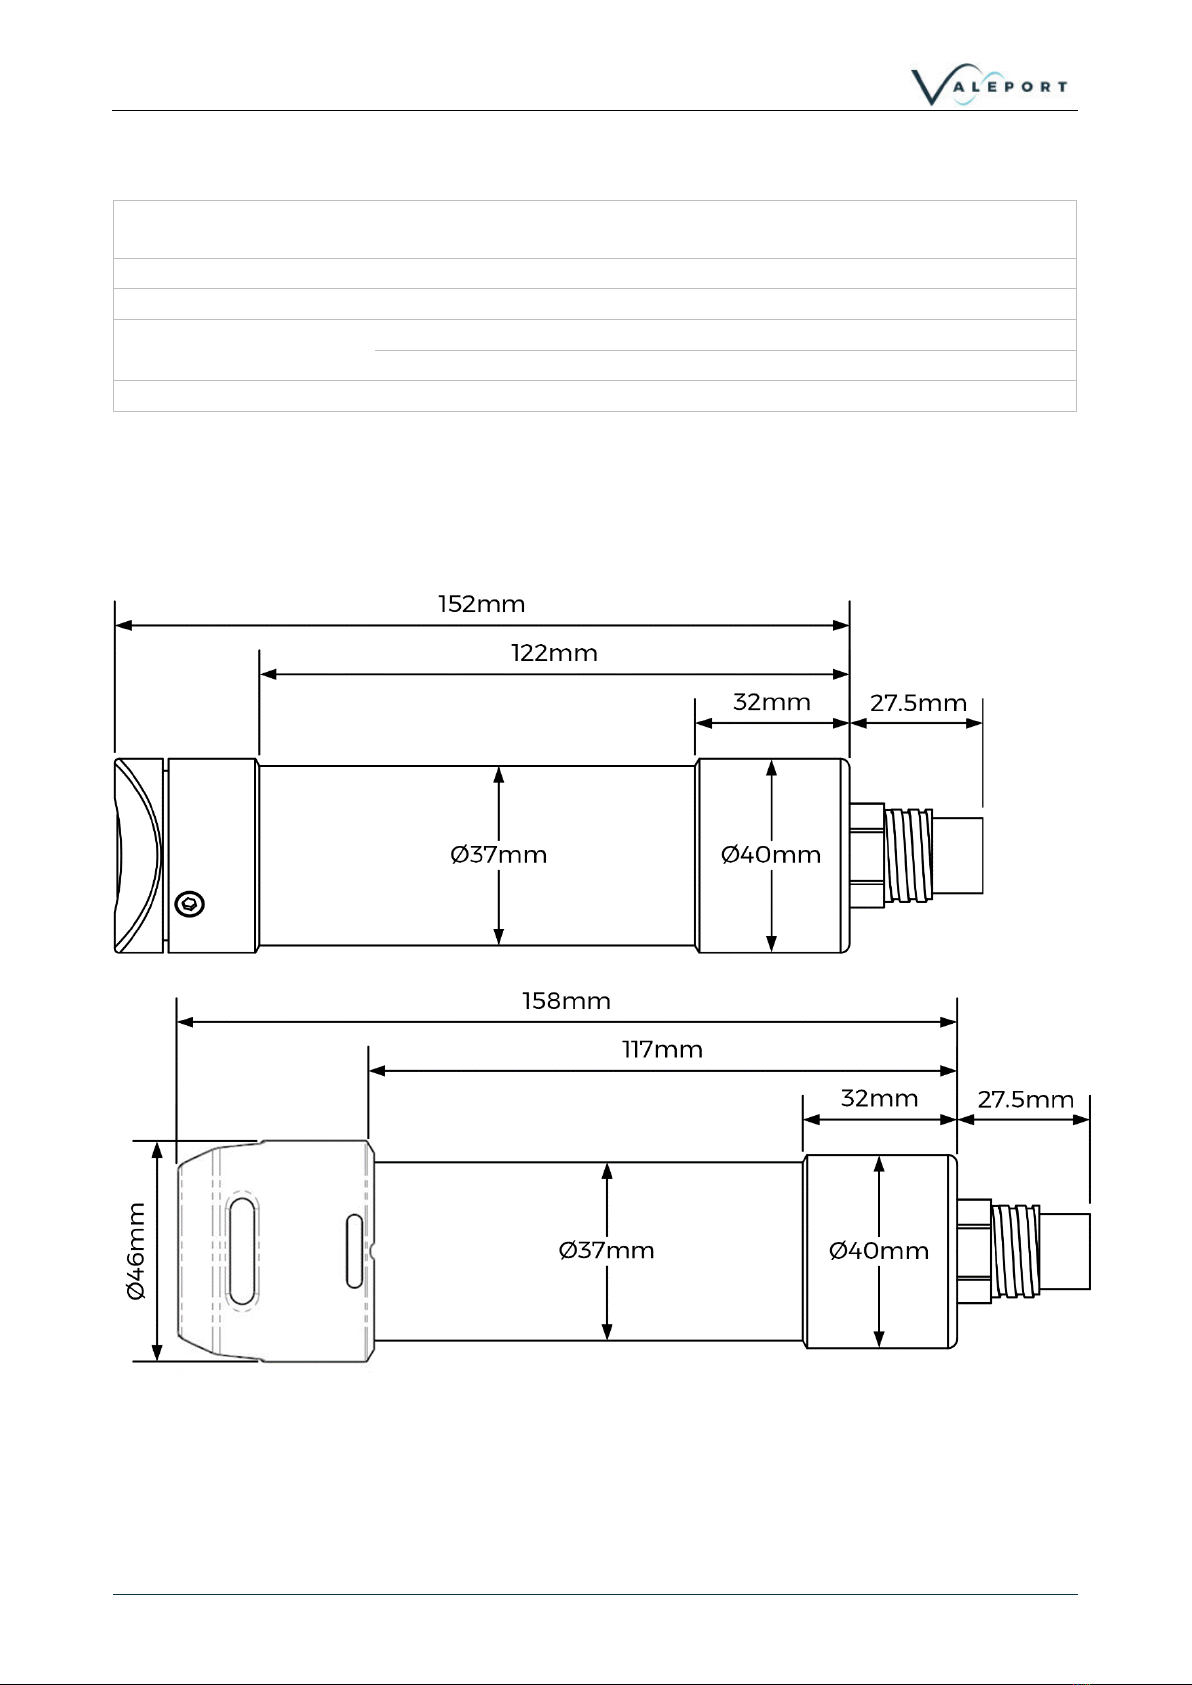
2.5 Physical Characteristics ....................................................................................................................... 9
2.5.1 Dimensions.........................................................................................................................................................9
3 Data Acquisition................................................................................................................................ 10
3.1 Output Rate.......................................................................................................................................... 10
3.2 Operating Modes ................................................................................................................................ 10
3.2.1 Mode C - Continuous .....................................................................................................................................11
3.2.2 Mode M - Continuous Measurement...........................................................................................................11
3.2.3 S Mode..............................................................................................................................................................11
4 Functional Check.............................................................................................................................. 12
4.1 User Calibration Factor and Offset .................................................................................................... 12
5 Operation with Multiple Dye Types ................................................................................................ 14
6 Operation with 400 Series Instruments ......................................................................................... 15
7 Communications............................................................................................................................... 16
7.1 Data Output Format $PVHYP (Pre November 2020)....................................................................... 16
7.2 Data Output Format $PVHY2 (Post November 2020) ..................................................................... 17
7.3 Hash (#) Codes ................................................................................................................................... 18
7.4 Modbus Operation .............................................................................................................................. 20
7.4.1 Modbus Register Lookup Table ...................................................................................................................22
8 Electrical ............................................................................................................................................ 25
8.1 Interface Cable –0901EA2 ................................................................................................................ 25
8.2 0400 Series Interface Cable............................................................................................................... 25
9 Care and Maintenance..................................................................................................................... 26
9.1 Fitting a Sensor Guard........................................................................................................................ 26
10 Software............................................................................................................................................. 27
10.1 Valeport Configure App...................................................................................................................... 27
10.1.1 Interface to the Hyperion...............................................................................................................................28
10.1.2 Configure the Instrument...............................................................................................................................30
10.1.3 Configure with Operation as Part of an EnviroLog System.....................................................................33
10.1.4 Sampling Scenario..........................................................................................................................................34
10.1.5 Calibration ........................................................................................................................................................35
11 Setting the Gain (Units with a Serial Number earlier than 75100).............................................. 36
12 Ordering and Part Numbers............................................................................................................ 38
12.1 Fluorometer ......................................................................................................................................... 38
12.2 Turbidity ............................................................................................................................................... 38
12.3 Accessories ......................................................................................................................................... 38
13 Declarations of Conformity.............................................................................................................. 39
13.1 UK Declaration of Conformity - UKCA Marking................................................................................ 39
13.2 EU Declaration of Conformity - CE Marking ..................................................................................... 40

Hyperion Optical Sensors - Operating Manual:
MANUAL-360093108-14 | issue: 2.1
Page | 3
©2023 –Valeport Ltd
1Introduction - Hyperion Optical Sensor
Valeport’s range of Hyperion optical instruments delivers high performance optical measurements
for the following fluorometers parameters:
•Chlorophyll a
•Fluorescein (Uranine)
•Phycocyanin
•Rhodamine WT
•Sulforhodamine B
and
•Turbidity
in a compact & robust package ideal as a standalone sensor, for ROV and AUV integration or used
as part of a multi-sensor array with a data logger.
Offered as standard in a 6000m depth rated, Titanium housing the Hyperion mini type Optical
Instrument has a wide range (9 - 28V DC) isolated power supply, data output up to 16Hz and
RS232, RS 485 and Modbus RT communication protocols.
The Hyperion sensors can also be integrated into Valeport's SWiFT, rapidPro CTD and fastCTD
profilers and interfaced to MIDAS CTD+ (400 series) type instruments.
The Hyperion has an accurate single channel detector that can be used for many different
fluorophores. It is designed for integration into systems providing electrical power and delivers a
signal that has been correlated to a known concentration of fluorophore.
1.1 Fluorophore & Nomenclature
“C”
Chlorophyll a
“F”
Fluorescein (Uranine)
"PC"
Phycocyanin
"R"
Rhodamine WT
“SRB”
Sulforhodamine B
More Fluorophores will become available in the Hyperion family of products - please check with
Valeport for availability.
Other optical, non-fluorescent technology:
"TU”
Turbidity
1.2 PCB Update
From November 2020 (serial numbers > 75100) a new PCB was introduced to the Hyperion
Fluorometer. The new MK2 PCB offers the same performance as the MK1 but no longer requires
the gain to be adjusted to achieve the full sensing range performance.
1.3 Calibration Update
From firmware version 903707A22 a new 2nd order calibration fit was introduced to improve
linearity at higher concentrations to counter some of the effects of quenching.

Section 2 | Sensors
©2023 –Valeport Ltd
Page | 4
2Sensors
An optical sensor must be kept clean to operate correctly. Ensure that the unit is powered down
before cleaning the sensor.
•Use warm soapy water with a soft bristled brush to remove any light fouling
•For heavy fouling use a solvent (e.g Isopropyl alcohol) and a soft bristled brush
•Always rinse thoroughly after every use in clean, fresh water.
2.1 Fluorometers
2.1.1 Chlorophyll a
Performance
Excitation:
470 nm
Detection:
696 nm
Dynamic Range:
0-800 µg/l
(pre SN 75100: 2 gain settings: 0-40 and 0-800 (software controlled))
Instrument Detection limit:
0.025 µg/l*
Actual Detection limit:
0.025 µg /l**
Linearity:
0.99 R2
Response Time:
0.03 to 2 sec
* 3x SD in RO water
** calibrated against Chlorophyll a in acetone solution
2.1.2 Fluorescein (Uranine)
Performance
Excitation:
470 nm
Detection:
545 nm
Dynamic Range:
0-500 ppb
(pre SN 75100: 2 gain settings: 0-25 and 0-500 (software controlled))
Instrument Detection limit:
<0.01 ppb*
Actual Detection limit:
0.03 ppb**
Linearity:
0.99 R2
Response Time:
0.03 to 2 sec
* 3x SD in RO water
** Calibrated against Fluorescein solution

Hyperion Optical Sensors - Operating Manual:
MANUAL-360093108-14 | issue: 2.1
Page | 5
©2023 –Valeport Ltd
2.1.3 Phycocyanin
Performance
Excitation:
590 nm
Detection:
650 nm
Dynamic Range:
0-9 000 ppb
(Pre SN 75100: 2 gain settings, 0-45, 0-9000 (software controlled))
Instrument Detection limit:
<2 ppb*
Actual Detection limit:
2.08 ppb**
Linearity:
0.99 R2
Response Time:
0.03 to 2 s
* 3x SD in RO water
** Calibrated against Phycocyanin in water\Phosphate buffer solution
2.1.4 Rhodamine WT
Performance
Excitation:
520 nm
Detection:
650 nm
Dynamic Range:
0-1000 ppb
(pre SN 75100: 2 gain settings, 0-50, 0-1000 (software controlled))
Instrument Detection limit:
<0.01 ppb*
Actual Detection limit:
0.06 ppb**
Linearity:
0.99 R2
Response Time:
0.03 to 2 s
* 3x SD in RO water
** Calibrated against Rhodamine WT solution
2.1.5 Sulforhodamine B
Performance
Excitation:
520 nm
Detection:
650 nm
Dynamic Range:
0-1000 ppb
Instrument Detection limit:
<0.03 ppb*
Actual Detection limit:
<1 ppb**
Linearity:
0.99 R2
Response Time:
0.03 to 2 s
* 3x SD in RO water
** Calibrated against Sulforhodamine B solution

Section 2 | Sensors
©2023 –Valeport Ltd
Page | 6
2.1.6 Safety Statement
A Hyperion Fluorometer is classified as Risk Group 1 under standard 62471. As the type is
classified as Risk Group 1 solely due to radiation in the visible band a hazard label is not required.
However,
The LED used is in excess of the Exempt Group and that the viewer- related risk is dependent upon
how the user installs and operates the equipment.
The exposure hazard value (EHV) for a Hyperion Fluorometer in terms of distance is 320mm
Never look directly into the optical aperture
2.2 Linear Observation Range
The linear range is the concentration range for which the fluorometer signal is directly proportional
to the concentration of the fluorophore. The linear range starts at the minimum detection limit
(MDL) and extends to the upper limit of the instrument (dependent on fluorophore properties,
optical filters, LED power, sample volume and optical path length).
Prior to November 2020 (Serial No: 75100) Hyperion Fluorometers had a calibrated linear
response for 2 gain settings (e.g. the ranges 0-40 µg/l (G5) and 0-800 µg/l (G1) for chlorophyll a).
Post November 2020, a single gain setting for full scale was introduced. At higher concentrations,
unlike analogue devices which generally flat-line at full-scale deflection (e.g. FSD 5V) the Hyperion
will continue to output a signal which increases with concentration (i.e. meaningful data), though
which is no longer guaranteed to be linear.
At very high fluorophore concentrations, signal quenching can occur, whereby the instrument
output does not increase linearly with fluorophore concentration (roll-off) and may decrease at
even higher levels.
To perform a quick linearity check, dilute the sample 1:1 with RO water. If the reading decreases by
50%, the sample is in the linear range. If the reading decreases by less than 50% or even
increases, the sample is above the linear range.

Hyperion Optical Sensors - Operating Manual:
MANUAL-360093108-14 | issue: 2.1
Page | 7
©2023 –Valeport Ltd
2.3 Quenching
Quenching refers to the reduction in fluorescence of a fluorophore. Several processes can result in
quenching:
Chloride is known to quench quinine sulphate and Fluorescein. It is, therefore, advisable to prepare
any fluorophore solutions with water prepared by Reverse Osmosis or De-Ionised water.
Temperature quenching - as the temperature of the sample increases, the fluorescence decreases,
that is, fluorescence is sensitive to temperature. In order to improve accuracy, measure the
sample at different temperatures and derive corrections for changes in temperature.
Photo-bleaching (or fading) is the (permanent) degradation of a fluorophore molecule by light
resulting in lower signal levels. Photo-bleaching is dependent on exposure (intensity of light and
duration) and wavelength (UV is more damaging than longer wavelengths). Use of more robust
fluorophores is recommended to avoid photo-bleaching.

Section 2 | Sensors
©2023 –Valeport Ltd
Page | 8
2.4 Turbidity
Valeport's Turbidity technology is essentially two sensors in one. The first is a “classic”
Nephelometer, using a 90˚beam angle for turbidity levels between 0 and 2000 NTU. The second
sensor uses optical backscatter - OBS (~120˚beam angle) for turbidity levels beyond 10 000 NTU.
Both sensors output data simultaneously, at a programmable rate, so there is no need to switch
ranges as conditions vary. Intelligent sampling and the use of a 24 bit ADC eliminates the need to
switch gain. The optical head is very compact, measuring just 20mm diameter and is rated to full
ocean depth.
Excitation\Detection:
850nm
Linear Range:
Nephelometer 0 to 1 000 NTU - linear response
Optical Backscatter: 0 to 4 000 NTU - linear response
(>4000 NTU has a non-linear monotonic response that allows derivation of
higher values using look-up tables)
Minimum Detection Level
0.03 NTU
2.4.1 Turbidity Units
Turbidity is traditionally measured in NTU - Nephelometric Turbidity Units. These are the units that
the Hyperion Turbidity sensor is calibrated to. The Nephelometric sensor data is labelled NTU
while the Backscatter sensor data is labelled as BTU - Backscatter Turbidity Units. This is done
purely to clarify the difference is sensor technology. BTU is not an industry recognised unit but can
be considered to be equivalent to the NTU because both sensors are calibrated with the same
standard solutions source. Please contact Valeport for further clarification if required.
2.4.2 Safety Statement
Valeport's turbidity sensor uses a near Infra-Red (NIR) LED operating at 850 nm with a reflector
producing a fairly narrow output beam. As the photo-response of the eye is low at 850 nm the blink
reflex and iris contraction reflex are not activated. NIR LEDs generally produce very low levels of
radiation and pose no threat to the human eye. A photometric test report was commissioned by
Valeport in accordance with BS EN 62471. For this the LED was set to 25 times the operational
power and the sensor was classified as exempt. However, it is best practice to avoid extended
exposure to the LED and it is recommended not to look directly into the sensor windows.
The Turbidity sensor is classified EXEMPT under the standard 62471
As a Hyperion Turbidity instrument is classified as EXEMPT a hazard label in not required
Never look directly into the optical aperture

Hyperion Optical Sensors - Operating Manual:
MANUAL-360093108-14 | issue: 2.1
Page | 9
©2023 –Valeport Ltd
2.5 Physical Characteristics
Materials:
Titanium with sapphire \ glass window
Polymer optical fibre
Depth Rating:
6000m
Dimensions:
40mmØ x 179.5mm (including connector)
Weight
0.50 kg (in air)
0.26 kg (in water)
Operating Temperature:
60°C max (without damaging the optical sensor)
2.5.1 Dimensions
As part of a mini type instrument
An optional sensor guard is shown on the second drawing.

Section 3 | Data Acquisition
©2023 –Valeport Ltd
Page | 10
3Data Acquisition
Hyperion optical sensors are designed for both static monitoring and profiling operations either as
a standalone instrument or as part of a profiling multi sensor instrument.
The optical sensor should be mounted with the window on the front face of the instrument and
therefore, the beam of excitation light directed into the water body to be analysed. During the
synchronised observation period ambient light is measured while the Hyperion LED is off and again
when the LED is on in order to cancel out the ambient light effects.
If very high ambient light levels are encountered, e.g. bright sunlight, in shallow water where there
is a light coloured \ reflective bottom, the receiver may become saturated and return negative
number results. If this happens some form of shading will be required and the sensor not mounted
so it points directly at the bottom.
Valeport can provide an Ambient Light Shield (0901SA7). Please contact Valeport for details.
3.1 Output Rate
The signal output can be configured between 0.5 Hz and 16 Hz (free running) using software
control.
The unit is factory pre-set to the maximum synchronous averaging period (0.5 Hz or 2 secs) in
order to be able to resolve the minimum detection limit.
Fast data rates should only be used w here good signal levels are encountered, otherwise features
may be lost in the background noise. In very low signal conditions, signal:noise ratio issues will,
therefore, limit the maximum vertical speed and resolution when running profiles.
3.2 Operating Modes
Hyperion can operate in a number of modes.
The set-up of these modes uses a macro like format where a command C02 or M16 will set the unit
into a particular mode and configure multiple filter settings appropriately for that mode and update
period.
Other operational modes and filter settings are available - please contact Valeport with your
specific requirements.

Hyperion Optical Sensors - Operating Manual:
MANUAL-360093108-14 | issue: 2.1
Page | 11
©2023 –Valeport Ltd
3.2.1 Mode C - Continuous
Mode C is the default setting for Hyperion.
Command example: #039;C02
In this mode the instrument will be set into a continuous output cycle of appropriately averaged and
filtered data.
Mode C02: (C zero 2) will output a reading every 2 seconds. This is the maximum synchronous
observation measurement period.
Mode C04: (C zero 4) will output a reading every 4 seconds but that will be a mean of 2, 2 second
synchronous observation measurement periods.
Setting
Measurement period (sec)
Synchronous sample interval (secs)
Number of samples
C01
1
1
1
C02
2
2
1
C04
4
2
2
C06
6
2
3
Cxx
xx
2
xx/2
3.2.2 Mode M - Continuous Measurement
Mode M will perform a measurement and data output at the rate specified up to 16Hz.
Command example: #039;M8
Filter settings are appropriately set for the update rate.
M1: performs continuous measurements at 1Hz
M2: performs continuous measurements at 2Hz
...
M16: performs continuous measurements at 16Hz
Setting
Measurement period (sec)
Synchronous sample interval (secs)
Number of samples
M1
1
1
1
M2
0.5
0.5
1
M4
0.25
0.25
1
M8
0.125
0.125
1
M16
0.0625
0.0625
1
3.2.3 S Mode
Single observation on run command (#028)
Command example: #039;S2
Setting
Measurement period (sec)
Synchronous sample interval (secs)
Number of samples
S1
1
1
1
S2
2
2
1
S4
4
2
2
S6
6
2
3
Sxx
xx
2
xx/2

Section 4 | Functional Check
©2023 –Valeport Ltd
Page | 12
4Functional Check
To perform a functional test connect the Hyperion to both power and PC using the supplied Y lead.
Run up the Configure App and check that data is being received in the Terminal window. The data
display will be in the selected output format, at the rate selected in the sampling option:
Now check the following:
The LEDs are on and light is being emitted from the fibres.
The magnitude of the data received increases when the supplied fluorescent target is held at 45° to
the sensor window:
By altering the angle of the target, the magnitude of the reading should change thereby showing
the correct operation of the sensor.
If the test target is missing then a piece of good quality white paper can be used.
4.1 User Calibration Factor and Offset

Hyperion Optical Sensors - Operating Manual:
MANUAL-360093108-14 | issue: 2.1
Page | 13
©2023 –Valeport Ltd
From firmware version 903707A15 a new feature became available –User Calibration factors. A
combined command consisting of a separate Gain factor (a multiplication factor) and an Offset
value (this value is added). Parameters of 1;0 will cause no effect to the Valeport calibrated value.
It is recommended that this function is switched off when not in operation using command #086;0
or setting the factor to OFF using the Configure App.
On updating firmware insure that all parameters are correctly configured –with special attention
given to the User Calibration factor and offset that should be re-entered manually:
Channel 1 write: #094;gain;offset
#094;1;0<CR>
Channel 2 write: #096;gain;offset
#096;1;0<CR>
User Cal status OFF
#086;0<CR>
Then reset from scratch.

Section 5 | Operation with Multiple Dye Types
©2023 –Valeport Ltd
Page | 14
5Operation with Multiple Dye Types
If your survey calls for dye tracing with more than one dye in the same water body, at the same
time please contact Valeport for the compatibility of those dyes operating together.
For example see below, using Rhodamine and Fluorescence together. It is possible that the
Fluorescein fluorometer will give a false positive to the Rhodamine dye:

Hyperion Optical Sensors - Operating Manual:
MANUAL-360093108-14 | issue: 2.1
Page | 15
©2023 –Valeport Ltd
6Operation with 400 Series Instruments
If the Hyperion Instrument is used with a 400 series Instrument e.g. MIDAS CTD+ it should be
configured using Configure software as follows:
Baud Rate:
38400 (#059 38400)
Mode:
Continuous
•The 400 series Instrument must be configured using DataLog Pro ver 04007125F1 or later
•Ensure the 400 unit internal Power source (from 0400550) for the Hyperion is connected as
per cable form 0400C321.
•Ensure the latest version of Hyperion interface code (04007181) is installed in the
Quartzonix Board (0400513)

Section 7 | Communications
©2023 –Valeport Ltd
Page | 16
7Communications
The instrument will operate in real time, with setup performed by direct communications with PC
before and after deployment.
Both RS232 and RS485 (including Modbus) outputs are available, selected by command code.
RS232 data may be taken directly into a PC over cables up to 200m.
RS485 is suitable for longer cables, up to 500m, and allows for multiple addressed units on a single
cable.
Baud Rate
2400 - 115200
Protocol
8 data bits, 1 stop bit, No parity,
No flow control
7.1 Data Output Format $PVHYP (Pre November 2020)
The Hyperion outputs a single NMEA style data string –Fluorometers pre SN 75100
Example: $PVHYP,01,01,1234.45, 1.2345, 01, C02,*7F
Where:
Field
Number
Description
Type
Description
1
NMEA Header
String
Valeport HYPerion
2
Instrument ID
Integer
3
Parameter ID
Integer
1 = Chlorophyll a
2 = Fluorescein (Uranine)
3 = Rhodamine
4 = Crude Oil
7 = Phycocyanin (freshwater Blue Green Algae)
8 = Turbidity
9 = Sulforhodamine B
4
Parameter Mean
Float
5
Parameter SD
Float
6
Parameter Units
Units
ug/l for Chlorophyll a
ppb for Fluorescein
7
Operating Mode
String
C02 (default)
8
Check Sum
An exclusive OR sum between all characters
between the '$' and the '*'of the string

Hyperion Optical Sensors - Operating Manual:
MANUAL-360093108-14 | issue: 2.1
Page | 17
©2023 –Valeport Ltd
7.2 Data Output Format $PVHY2 (Post November 2020)
The Hyperion outputs a single NMEA style data string –post November 2020 (Serial No: 75100)
this will be a $PVHY2 format string.
Example - Turbidity: $PVHY2,01,8,0.48705,0.012,NTU,141.65588,0.023,NTU,M1,*6D
Example –Fluorometer: $PVHY2,01,1,0.816,0.012,ug/l,,,,C02,*24
Please note that fields with no data e.g. 2nd parameter data in a fluorometer will be empty but
delimited, as above.
Where:
Field
Number
Description
Type
Description
1
NMEA Header
String
Valeport HYperion2
2
Instrument Address
Integer
Identifies the instrument
3
Parameter ID
Integer
1 = Chlorophyll a
2 = Fluorescein (Uranine)
3 = Rhodamine
4 = Crude Oil
7 = Phycocyanin (freshwater Blue Green Algae)
8 = Turbidity
9 = Sulforhodamine B
4
1st Parameter Mean
Float
5
1st Parameter SD
Float
6
1st Parameter Units
String
ug/l for Chlorophyll a
NTU for turbidity nephelometer
4
2nd Parameter Mean
Float
5
2nd Parameter SD
Float
6
2nd Parameter Units
String
NTU for turbidity backscatter
7
Operating Mode
String
C02 (default)
8
Check Sum
Char
An exclusive OR sum between all characters
between the '$' and the '*'of the string
If the sampling that has been setup such that only one measurement is used to produce a reading
then no Standard Deviation is generated and the output becomes:
Turbidity - $PVHY2,01,8,0.48705,,NTU,1.65588,,NTU,M1,*6D
Fluorometer - $PVHY2,01,1,0.816,,ug/l,,,,C02,*24
Otherwise:
Turbidity - $PVHY2,01,8,0.48705,0.012,NTU,141.65588,0.023,NTU,M1,*6D
Fluorometer - $PVHY2,01,1,0.816,0.012,ug/l,,,,C02,*24

Section 7 | Communications
©2023 –Valeport Ltd
Page | 18
7.3 Hash (#) Codes
Hash codes are used to configure the instrument. They can be applied using a Terminal program
or Configure software. This list is correct for firmware version: 0903707A15.
# Code
followed by
Description
#001
;address_485<CR><LF>
Set the address value for addressed system
This is also the Modbus address for the instrument
#002
<CR><LF>
Reads the address value for addressed system
#005
;address_mode<CR><LF>
Turns on or off address mode 0 = OFF 1 = ON
#006
<CR><LF>
Reads address mode ON or OFF
#015
<CR><LF>
Request last measurement –MK1 PCB
#022
<CR><LF>
Reads ASCII string of the last calibration date: Format –
day;month;year
#028
<CR><LF>
Place unit into run mode
#030
<CR><LF>
Report the latest data in the output format set by Output
mode
#032
<CR><LF>
Reads the firmware version and date installed in the
instrument
#034
<CR><LF>
Reads the serial number of the instrument
#037
;site_info<CR><LF>
Enter site information
#038
<CR><LF>
Read the site information
#039
;sampling mode
<CR><LF>
Set the last sampling mode set without running
#040
<CR><LF>
Read last sampling mode set
#059
;baud_rate<CR><LF>
Baud rate. 2400,4800,9600,19200,115200 or 230400
#060
<CR><LF>
Read Baud rate
#082
;rs_485_selected<CR><LF>
Selects if in RS485 mode.
Usually done with control line (MK1 PCB only)
#083
<CR><LF>
Read status
#086
;secondary_calibration_enabled
<CR><LF>
Secondary calibration status 0 = disabled, 1 = enabled.
#087
<CR><LF>
Read Secondary calibration 0 = disabled, 1 = enabled.
#094
;gain;offset<CR><LF>
Set offset and gain coefficient for a user secondary
calibration - optics channel 1
#095
<CR><LF>
Read offset and gain coefficient
#096
;gain;offset<CR><LF>
Set offset and gain coefficient for a user secondary
calibration optics channel 2 (when used)
#097
<CR><LF>
Read offset and gain coefficient
#098
;modbus_allow_hash_command
<CR><LF>
Set to 1 if a # command is detected by the Modbus
system and setup mode entered
#099
<CR><LF>
Read # recognition status
#102
user_output
Enter output item
#103
<CR><LF>
Read output item
#104
user_format
Enter 'c' style format string
#105
<CR><LF>
Read format string
#126
<CR><LF>
Read optical parameter id
#128
<CR><LF>
Read units

Hyperion Optical Sensors - Operating Manual:
MANUAL-360093108-14 | issue: 2.1
Page | 19
©2023 –Valeport Ltd
# Code
followed by
Description
#134
<CR><LF>
Read Serial number of the optical head assembly
#222
;averaging_constant<CR><LF>
Set the number of samples to average
#223
<CR><LF>
Read the averaging length
#400
;fluoro_gain<CR><LF>
Set fluorometer gain –MK1 PCB
Redundant for Hyperions purchased after Nov 2020
(serial numbers below 75100)
#401
<CR><LF>
Read Fluorometer gain –MK1 PCB
#433
<CR><LF>
Read Background light intensity warning level.
Light level that can cause loss of accuracy/quality
#437
<CR><LF>
Read Time for LED stabilisation (inhibits output)
#700
;modbus_enabled<CR><LF>
Set Modbus communication mode and parity, Modbus
mode
0;0 = disabled
1;0 = enabled –No Parity
1;1 = enabled –Even Parity
#701
<CR><LF>
Read Modbus communication mode and parity
#702
;uart_parity<CR><LF>
Set 0 for No Parity and 1 for Even parity in all Uart com-
munication (ascii and Modbus)
#703
<CR><LF>
Read Parity for all UART communication (ascii and Mod-
bus)

Section 7 | Communications
©2023 –Valeport Ltd
Page | 20
7.4 Modbus Operation
The Modbus implementation in Hyperion is as follows:
•Half duplex
•The holding registers are Modbus RTU compliant - 16 bit
•Byte order is high byte and high word first
•Read with function code 3
The address and number formats for each of the different available registers can be found in the
Modbus Register Lookup Table below.
In order to operate using Modbus protocols, with a logger that will power the Hyperion on for the
duration of an observation and then power down again, the following settings should be sent to the
Hyperion. This can be achieved using the “Configure for EnviroLog” button in Configure:
#098;1,
#005;0,
#059;19200,
#200;21;3;9;15;1;25;11,
#204;2,
#091;2,
#222;4,
#031;1,
#700;1;1
Configure’s tool ribbon when set up for Hyperion:
EnviroLog is Valeport’s name for a number of loggers and telemetry systems that use Modbus
configuration. This particular configuration is designed for a scenario where the instrument is
powered up, observation taken and then powered down again. This scenario is discussed in more
detail below.
Instrument addresses of 1-99 (note: 35 is hidden and protected) are supported.
If there is a particular requirement please contact Valeport for more advice.
Scenario: Power Up →Observe →Report →Power Down
As set above, on being powered the Hyperion will start to make an observation, suitably timed and
filtered. The Control\Logging system should wait for the stabilisation period followed by the
observation period, after which the data will be available in the designated register. If Modbus is
enabled and a logger requests a reading before the first measure is available the Hyperion will
reply with a standard Modbus error packet.
Start-up stabilisation.
Each type of optical sensor has a characteristic ‘warm-up’ phase before stabilising after initially
power up. This is set at build time in seconds, read: #437.
Warm-up period for a Fluorometer = 8 seconds
Warm-up period for Turbidity = 4 seconds
As set up above there will be an observation period of 4 seconds –2 observations of 2 seconds
and averaged.
The instrument should then be powered down until the next observation as scheduled.
This manual suits for next models
2
Table of contents
Other Valeport Accessories manuals

Valeport
Valeport SWiFT SVP User manual

Valeport
Valeport UV-SVP User manual

Valeport
Valeport miniSVS User manual

Valeport
Valeport miniSVS User manual

Valeport
Valeport Hyperion Chlorophyll a User manual

Valeport
Valeport uvSVX User manual

Valeport
Valeport miniIPS User manual

Valeport
Valeport miniIPS2 User manual

Valeport
Valeport VRS20 User manual