Valeport Hyperion Chlorophyll a User manual

HYPERION OPTICAL SENSORS
OPERATING MANUAL
Document No:
MANUAL-1013637447-3 | issue: 1.6
Date:
January 2022
This document was prepared by Valeport Limited, the Company, and is the property of the
Company, which also owns the copyright therein. All rights conferred by the law of the copyright
and by virtue of international copyright conventions are reserved to the Company. This document
must not be copied, reprinted or reproduced in any material form, either wholly or in part, and the
contents of this document, and any method or technique available there from, must not be
disclosed to any other person whatsoever without the prior written consent of the Company.
Valeport Ltd
St Peter's Quay
Totnes, Devon TQ9 5EW
United Kingdom
Phone:
email:
Web:
As part of our policy of continuous development, we reserve the right to alter, without prior notice,
all specifications, designs, prices and conditions of supply for all our equipment

Table of Contents
©2022 –Valeport Ltd
Page | 2
Table of Contents
1Introduction - Hyperion Optical Sensor.....................................................................3
1.1 Fluorophore & Nomenclature..........................................................................................3
1.2 PCB Update ....................................................................................................................3
2Sensors....................................................................................................................4
2.1 Fluorometers...................................................................................................................4
2.1.1 Chlorophyll a................................................................................................................. 4
2.1.2 Fluorescein (Uranine)................................................................................................... 4
2.1.3 Phycocyanin................................................................................................................. 5
2.1.4 Rhodamine WT............................................................................................................. 5
2.1.5 Sulforhodamine B......................................................................................................... 5
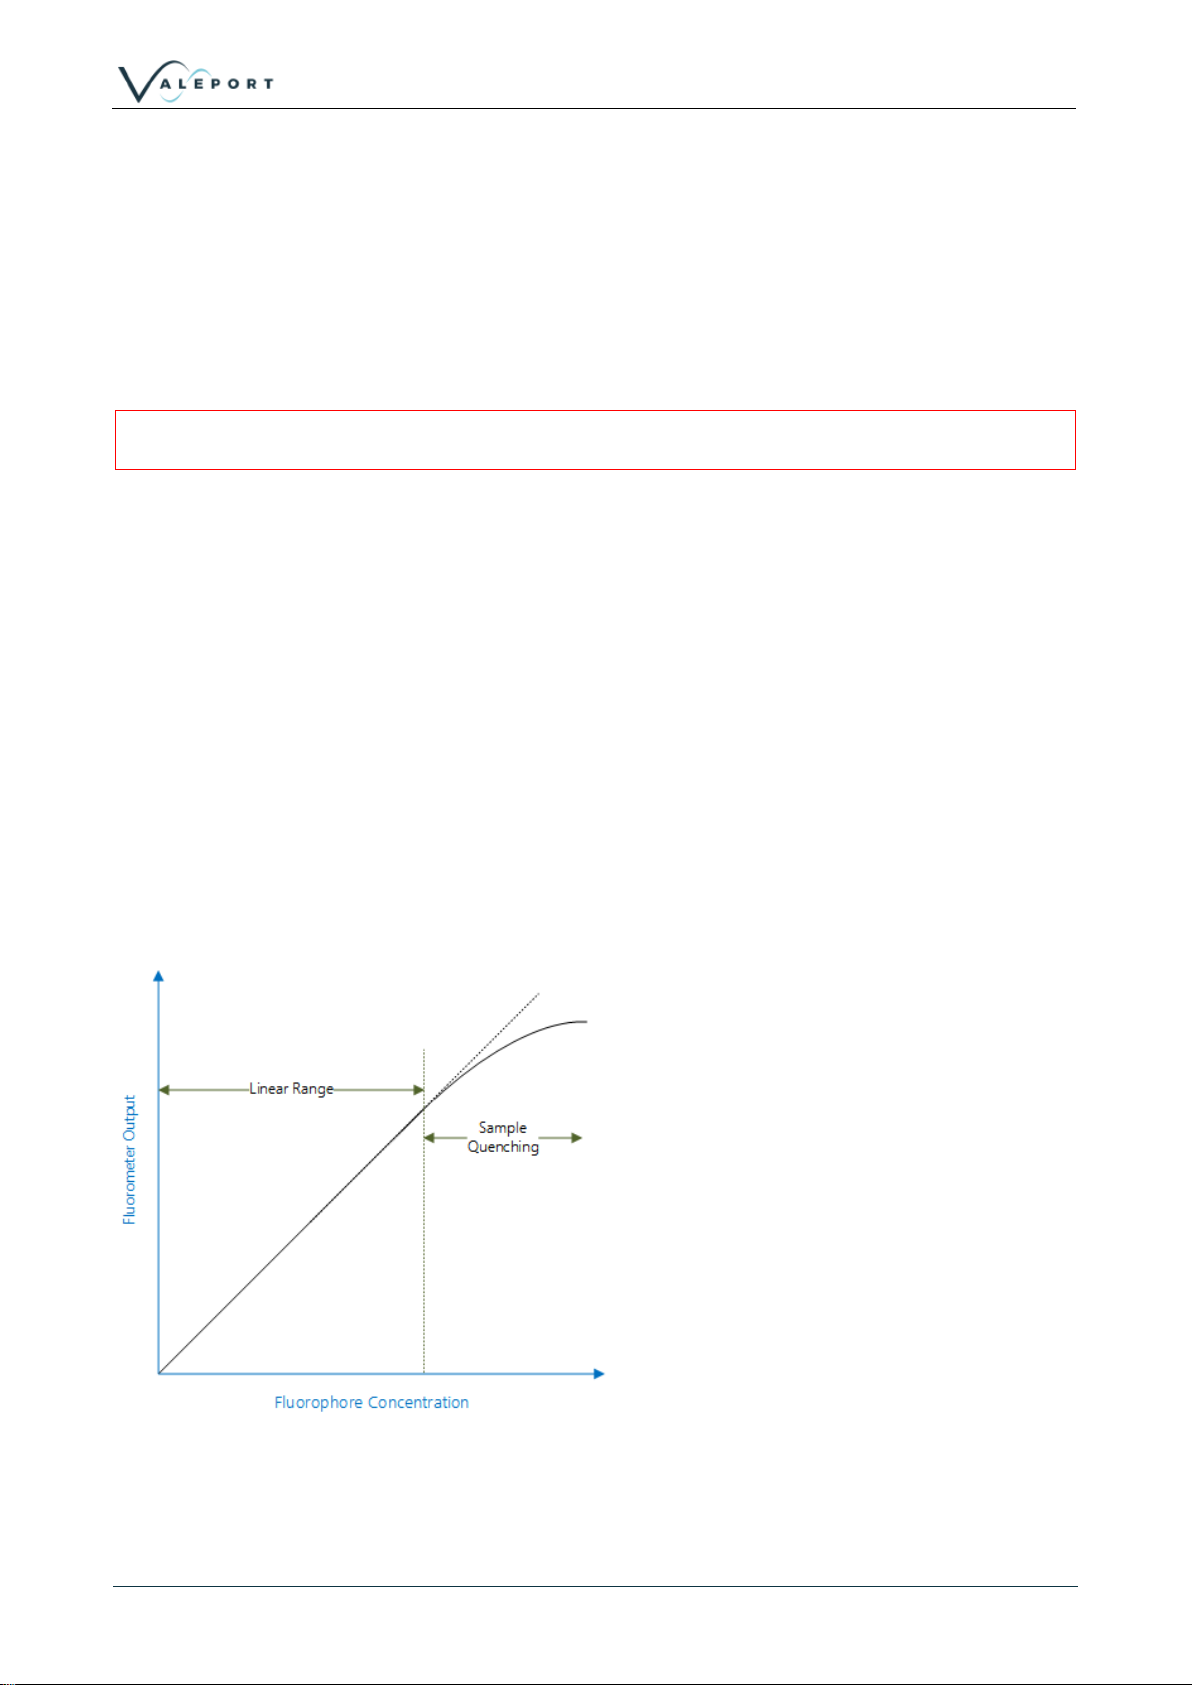
2.2 Linear Observation Range..............................................................................................6
2.3 Quenching.......................................................................................................................7
2.4 Turbidity...........................................................................................................................8
2.4.1 Turbidity Units............................................................................................................... 8
2.4.2 Safety Statement.......................................................................................................... 8
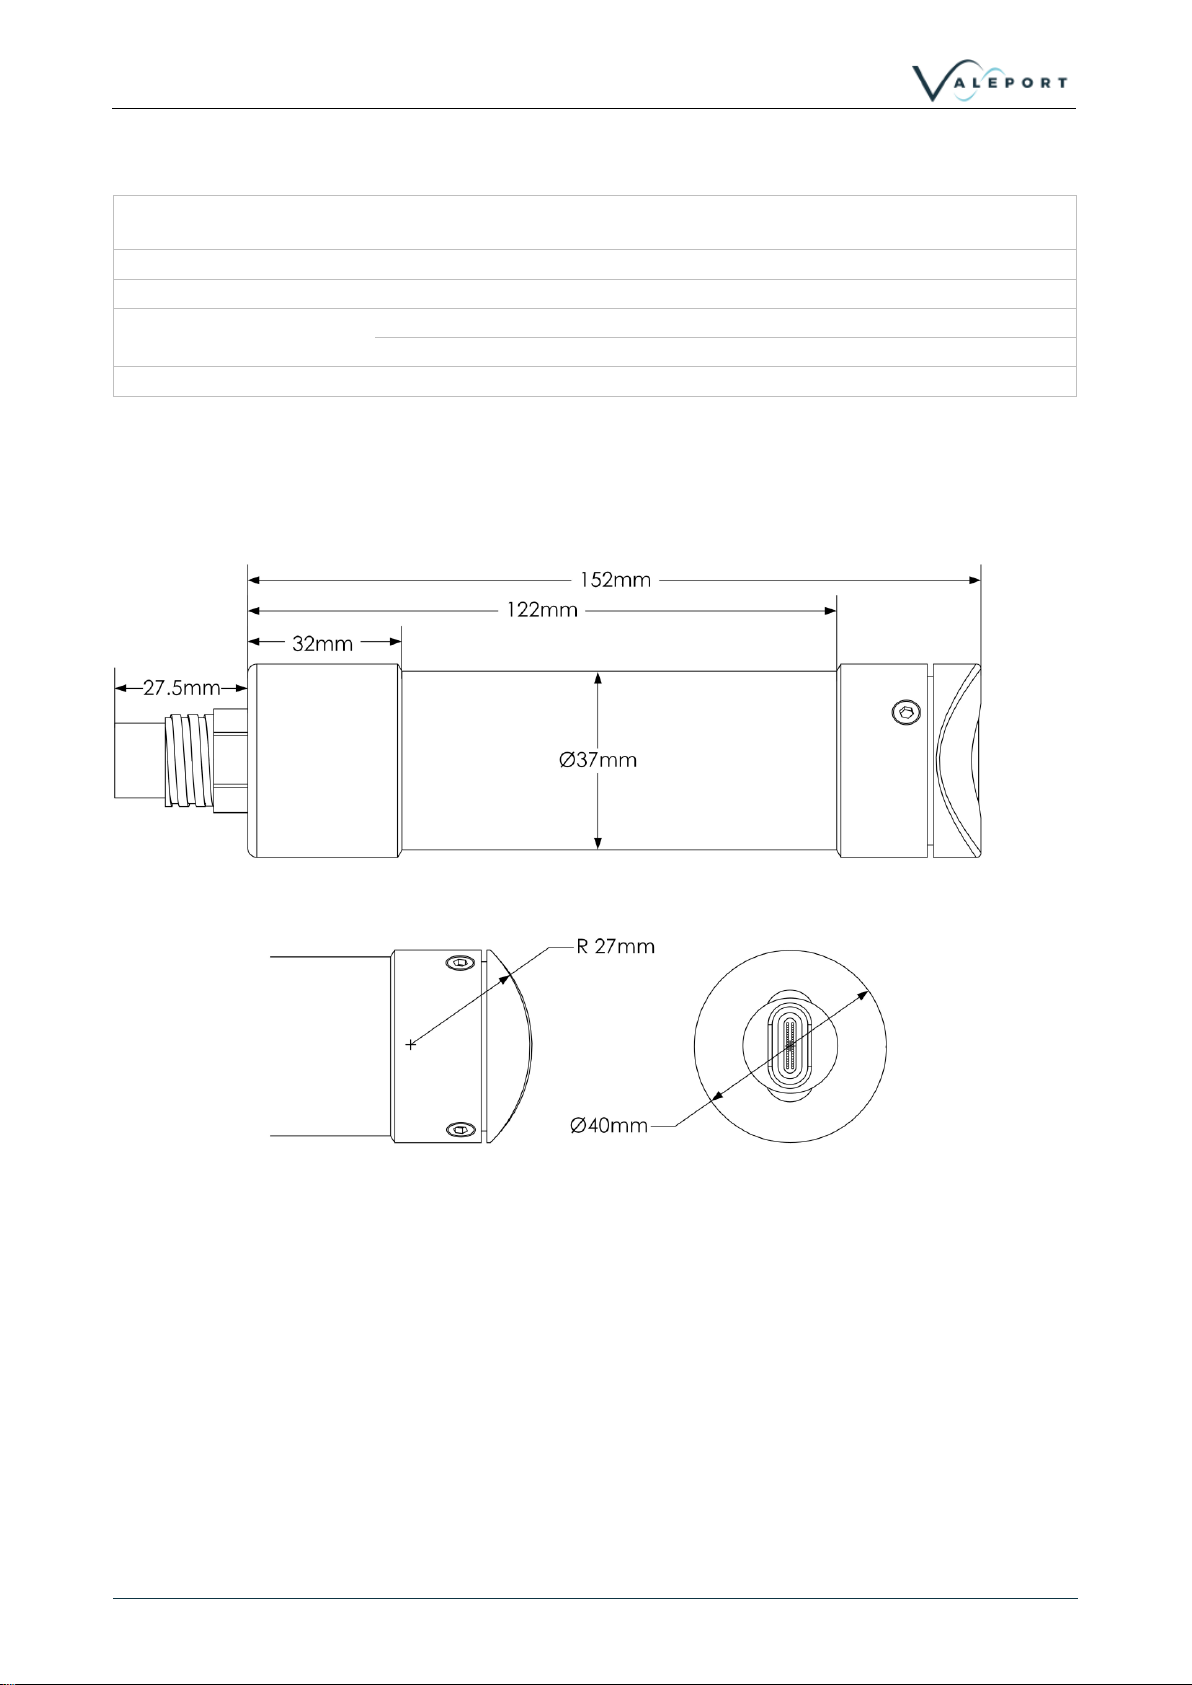
2.5 Physical Characteristics..................................................................................................9
2.5.1 Dimensions................................................................................................................... 9
3Data Acquisition.....................................................................................................10
3.1 Setting the Gain.............................................................................................................10
3.1.1 Turbidity...................................................................................................................... 12
3.2 Output Rate...................................................................................................................12
3.3 Functional Check ..........................................................................................................12
4Operation with 400 Series Instruments...................................................................17
5Electrical ................................................................................................................18
5.1 Connector Pin-Out ........................................................................................................18
5.2 0400 Series Interface Cable .........................................................................................18
6Communications ....................................................................................................19
6.1 Data Output Format $PVHYP (Pre November 2020)...................................................19
6.2 Data Output Format $PVHY2 (Post November 2020) .................................................20
6.3 Operating Modes...........................................................................................................21
6.3.1 Mode C - Continuous.................................................................................................. 21
6.3.2 Mode M - Continuous Measurement .......................................................................... 21
6.4 Hash (#) Codes.............................................................................................................22
7Care and Maintenance...........................................................................................23
8Software.................................................................................................................24
8.1 DataLog x2....................................................................................................................24
8.2 Valeport Configure App.................................................................................................24
8.2.1 Interface to the Hyperion............................................................................................ 25
8.2.2 Configure the Instrument............................................................................................ 26
8.2.3 Configure with Operation as Part of an EnviroLog System......................................... 27
9Ordering and Part Numbers...................................................................................29
9.1 Fluorometer...................................................................................................................29
9.2 Turbidity.........................................................................................................................29
9.3 Accessories...................................................................................................................29
10 Declarations of Conformity.....................................................................................30
10.1 KU Declaration of Conformity - UKCA Marking............................................................30
10.2 EU Declaration of Conformity - CE Marking.................................................................31

Hyperion Optical Sensors - Operating Manual:
MANUAL-1013637447-3 | issue: 1.6
Page | 3
©2022 –Valeport Ltd
1 Introduction - Hyperion Optical Sensor
Valeport’s range of Hyperion optical instruments delivers high performance optical measurements
for the following species:
•Chlorophyll a
•Fluorescein (Uranine)
•Phycocyanin
•Rhodamine
•Sulforhodamine B
and
•Turbidity
in a compact & robust package ideal as a standalone sensor, for ROV and AUV integration or used
as part of a multi-sensor array and data logger.
Offered as standard in a 6000m depth rated, Titanium housing the Hyperion mini type Optical
Instrument has a wide range (9-28V DC) isolated power supply, data output up to 16Hz and
RS232, 485 and Modbus communication protocols.
The Hyperion sensors can also be integrated into Valeport's SWiFT, rapidPro CTD and fastCTD
profilers and interfaced to MIDAS CTD+ type instruments.
The Hyperion has an accurate single channel detector which can be used for many different
fluorophores. It is designed for integration into systems providing electrical power and delivers a
signal that has been correlated to a known concentration of fluorophore.
1.1 Fluorophore & Nomenclature
“C”
Chlorophyll a
“F”
Fluorescein (Uranine)
"PC"
Phycocyanin
"R"
Rhodamine WT
“SRB”
Sulforhodamine B
More Fluorophores will become available in the Hyperion family of products - please check with
Valeport for availability.
Other optical, non-fluorescent technology:
"TU”
Turbidity
1.2 PCB Update
From November 2020 (serial numbers higher than 75100) a new PCB was introduced to the
Hyperion Fluorometer. The new MK2 PCB offers the same performance as the MK1 but no longer
requires the gain to be adjusted to achieve the full range performance.

Section 2 | Sensors
©2022 –Valeport Ltd
Page | 4
2 Sensors
An optical sensor must be kept clean to operate correctly. Ensure that the SWiFT is power down
before cleaning the sensor.
Use warm soapy water with a soft bristled brush to remove any light fouling
For heavy fouling use a solvent (e.g Isopropyl alcohol) and a soft bristled brush
Always rinse thoroughly after every use in clean, fresh water.
2.1 Fluorometers
2.1.1 Chlorophyll a
Performance
Excitation:
470 nm
Detection:
696 nm
Dynamic Range:
0-800 µg/l
(pre SN 75100: 2 gain settings: 0-40 and 0-800 (software controlled))
Instrument Detection limit:
0.025 µg/l*
Actual Detection limit:
0.025 µg /l**
Linearity:
0.99 R2
Response Time:
0.03 to 2 sec
* 3x SD in RO water
** calibrated against Chlorophyll a in acetone solution
2.1.2 Fluorescein (Uranine)
Performance
Excitation:
470 nm
Detection:
545 nm
Dynamic Range:
0-500 ppb
(pre SN 75100: 2 gain settings: 0-25 and 0-500 (software controlled))
Instrument Detection limit:
<0.01 ppb*
Actual Detection limit:
0.03 ppb**
Linearity:
0.99 R2
Response Time:
0.03 to 2 sec
* 3x SD in RO water
** Calibrated against Fluorescein solution

Hyperion Optical Sensors - Operating Manual:
MANUAL-1013637447-3 | issue: 1.6
Page | 5
©2022 –Valeport Ltd
2.1.3 Phycocyanin
Performance
Excitation:
590 nm
Detection:
650 nm
Dynamic Range:
0-9 000 ppb
(Pre SN 75100: 2 gain settings, 0-45, 0-9000 (software controlled))
Instrument Detection limit:
<2 ppb*
Actual Detection limit:
2.08 ppb**
Linearity:
0.99 R2
Response Time:
0.03 to 2 s
* 3x SD in RO water
** Calibrated against Phycocyanin in water\Phosphate buffer solution
2.1.4 Rhodamine WT
Performance
Excitation:
520 nm
Detection:
650 nm
Dynamic Range:
0-1000 ppb
(pre SN 75100: 2 gain settings, 0-50, 0-1000 (software controlled))
Instrument Detection limit:
<0.01 ppb*
Actual Detection limit:
0.06 ppb**
Linearity:
0.99 R2
Response Time:
0.03 to 2 s
* 3x SD in RO water
** Calibrated against Rhodamine WT solution
2.1.5 Sulforhodamine B
Performance
Excitation:
520 nm
Detection:
650 nm
Dynamic Range:
0-1000 ppb
Instrument Detection limit:
<0.03 ppb*
Actual Detection limit:
<1 ppb**
Linearity:
0.99 R2
Response Time:
0.03 to 2 s
* 3x SD in RO water
** Calibrated against Sulforhodamine B solution

Section 2 | Sensors
©2022 –Valeport Ltd
Page | 6
2.1.5.1 Safety Statement
A Hyperion Fluorometer is classified as Risk Group 1 under standard 62471. As the type is
classified as Risk Group 1 solely due to radiation in the visible band a hazard label is not required.
However,
The LED used is in excess of the Exempt Group and that the viewer- related risk is dependent
upon how the user installs and operates the equipment.
The exposure hazard value (EHV) for a Hyperion Fluorometer in terms of distance is 320mm
Never look directly into the optical aperture
2.2 Linear Observation Range
The linear range is the concentration range for which the fluorometer signal is directly proportional
to the concentration of the fluorophore. The linear range starts at the minimum detection limit
(MDL) and extends to the upper limit of the instrument (dependent on fluorophore properties,
optical filters, LED power, sample volume and optical path length).
Prior to November 2020 (Serial No: 75100) Hyperion Fluorometers had a calibrated linear
response for 2 gain settings (e.g. the ranges 0-40 µg/l (G5) and 0-800 µg/l (G1) for chlorophyll a).
Post November 2020, a single gain setting for full scale was introduced. At higher concentrations,
unlike analogue devices which generally flat-line at full-scale deflection (e.g. FSD 5V) the Hyperion
will continue to output a signal which increases with concentration (i.e. meaningful data), though
which is no longer guaranteed to be linear.
At very high fluorophore concentrations, signal quenching can occur, whereby the instrument
output does not increase linearly with fluorophore concentration (roll-off) and may decrease at
even higher levels.
To perform a quick linearity check, dilute the sample 1:1 with RO water. If the reading decreases
by 50%, the sample is in the linear range. If the reading decreases by less than 50% or even
increases, the sample is above the linear range.

Hyperion Optical Sensors - Operating Manual:
MANUAL-1013637447-3 | issue: 1.6
Page | 7
©2022 –Valeport Ltd
2.3 Quenching
Quenching refers to the reduction in fluorescence of a fluorophore. Several processes can result in
quenching:
Chloride is known to quench quinine sulphate and Fluorescein. It is, therefore, advisable to prepare
any fluorophore solutions with RO* or DI** water.
Temperature quenching - as the temperature of the sample increases, the fluorescence decreases,
that is, fluorescence is sensitive to temperature. In order to improve accuracy, measure the
sample at different temperatures and derive corrections for changes in temperature.
Photo-bleaching (or fading) is the (permanent) degradation of a fluorophore molecule by light
resulting in lower signal levels. Photo-bleaching is dependent on exposure (intensity of light and
duration) and wavelength (UV is more damaging than longer wavelengths). Use of more robust
fluorophores is recommended to avoid photo-bleaching.
* Reverse Osmosis
** De-Ionised

Section 2 | Sensors
©2022 –Valeport Ltd
Page | 8
2.4 Turbidity
Valeport's Turbidity technology is essentially two sensors in one. The first is a “classic”
Nephelometer, using a 90˚ beam angle for turbidity levels between 0 and 2000 NTU. The second
sensor uses optical backscatter - OBS (~120˚ beam angle) for turbidity levels beyond 10 000 NTU.
Both sensors output data simultaneously, at a programmable rate, so there is no need to switch
ranges as conditions vary. Intelligent sampling and the use of a 24 bit ADC eliminates the need to
switch gain. The optical head is very compact, measuring just 20mm diameter and is rated to full
ocean depth.
Excitation\Detection:
850nm
Linear Range:
Nephelometer 0 to 1 000 NTU - linear response
Optical Backscatter: 0 to 4 000 NTU - linear response
(>4,000 NTU has a non-linear monotonic response that allows derivation of
higher values using look-up tables)
Minimum Detection Level
0.03 NTU
2.4.1 Turbidity Units
Turbidity is traditionally measured in NTU - Nephelometric Turbidity Units. These are the units that
the Hyperion Turbidity sensor is calibrated to. The Nephelometric sensor data is labelled NTU
while the Backscatter sensor data is labelled as BTU - Backscatter Turbidity Units. This is done
purely to clarify the difference is sensor technology. BTU is not an industry recognised unit but can
be considered to be equivalent to the NTU because both sensors are calibrated with the same
standard solutions source. Please contact Valeport for further clarification if required.
2.4.2 Safety Statement
Valeport's turbidity sensor uses a near Infra-Red (NIR) LED operating at 850 nm with a reflector
producing a fairly narrow output beam. As the photo-response of the eye is low at 850 nm the blink
reflex and iris contraction reflex are not activated. NIR LEDs generally produce very low levels of
radiation and pose no threat to the human eye. A photometric test report was commissioned by
Valeport in accordance with BS EN 62471. For this the LED was set to 25 times the operational
power and the sensor was classified as exempt. However, it is best practice to avoid extended
exposure to the LED and it is recommended not to look directly into the sensor windows.
The Turbidity sensor is classified EXEMPT under the standard 62471
As a Hyperion Turbidity instrument is classified as EXEMPT a hazard label in not required
Never look directly into the optical aperture

Hyperion Optical Sensors - Operating Manual:
MANUAL-1013637447-3 | issue: 1.6
Page | 9
©2022 –Valeport Ltd
2.5 Physical Characteristics
Materials:
Titanium with sapphire \ glass window
Polymer optical fibre
Depth Rating:
6000m
Dimensions:
40mmØ x 179.5mm (including connector)
Weight
0.50 kg (in air)
0.26 kg (in water)
Operating Temperature:
60°C max (without damaging the optical sensor)
2.5.1 Dimensions
As part of a miniTYPE instrument

Section 3 | Data Acquisition
©2022 –Valeport Ltd
Page | 10
3 Data Acquisition
Hyperion optical sensors are designed for both static monitoring and profiling operations either as
a standalone instrument or as part of a profiling multi sensor instrument.
The optical sensor should be mounted with the window on the front face of the instrument and
therefore, the beam of excitation light directed into the water body to be analysed. During the
synchronised observation period ambient light is measured while the Hyperion LED is off and
again when the LED is on in order to cancel out the ambient light effects.
If very high ambient light levels are encountered, e.g. bright sunlight, in shallow water where there
is a light coloured \ reflective bottom, the receiver may become saturated and return negative
number results. If this happens some form of shading will be required and the sensor not mounted
so it points directly at the bottom.
Valeport can provide an Ambient Light Shield (0901SA7). Please contact Valeport for details.
3.1 Setting the Gain
Prior to November 2020 (Serial No: 75100) a Hyperion was set to the default range, for its specific
analyte, before leaving Valeport. After November 2020 MK2 PCBs were installed in all Hyperions
and that removed the need to set the gain. If you have bought your Hyperion after November 2020
you can ignore this section.
The default range for any analyte will be its low range and, therefore, the instrument will be set to
maximum sensitively and gain. This will allow the measurement of low concentrations of the
analyte. Within this range there will be a linear response over 3 orders of magnitude
For Example:
in the case of Chlorophyll, the default range is: 0.025 µg/l (MDL) to 25.0 µg/l (FSD)
In the case of Fluorescein, the default range is: 0.01 ppb (MDL) to 25 ppb (FSD)
If high fluorophore concentrations are encountered, the range should be set to the non-default
setting to allow a linear response over a far wider range.
The gain can be set as part of the set-up wizard in DataLog x2:

Hyperion Optical Sensors - Operating Manual:
MANUAL-1013637447-3 | issue: 1.6
Page | 11
©2022 –Valeport Ltd
For dye tracing applications, we recommend using the
Hyperion at the default range, that is, high
gain\sensitivity to reduce the quantity of dye required
and, therefore, the visibility / load on the environment
and or disposal costs.
This setting has no effect on Hyperion Fluorometers with
MK2 PCBs. All Hyperions supplied after November
2020 (Serial No: 75100) have MK2 PCBs. If you get an
error concerning #400 commands simply ignore it.
using DataLog x2 it will look like this:
>#034
0
>#022
1;1;19
>#002
1
>#126
8
>#128
NTU
>#040
M1
>#032
0903705A9 hyperion Nov 2 2020 14:03
>#038
Valeport tests
>#401
ERROR PROTECTED
>#401
ERROR PROTECTED
>#401
ERROR PROTECTED
>#401
ERROR PROTECTED
>#401
ERROR PROTECTED
>#401
ERROR PROTECTED
>#401
ERROR PROTECTED
>#
ERROR
>#
ERROR
>#400;5
ERROR PROTECTED

Section 3 | Data Acquisition
©2022 –Valeport Ltd
Page | 12
3.1.1 Turbidity
There is no gain setting for Turbidity.
Both Nephelometer and OBS data are available in the data output string. Beyond 1000 NTU the
OBS sensor data should be used.
3.2 Output Rate
The signal output can be configured between 0.5 Hz and 16 Hz (free running) using software
control.
The unit is factory pre-set to the maximum synchronous averaging period (0.5 Hz or 2 secs) in
order to be able to resolve the minimum detection limit.
Fast data rates should only be used w here good signal levels are encountered, otherwise features
may be lost in the background noise. In very low signal conditions, signal:noise ratio issues will,
therefore, limit the maximum vertical speed and resolution when running profiles.
3.3 Functional Check
To perform a functional test connect the Hyperion to both power and PC using the supplied Y lead.
Run DataLog x2, available from the Valeport Website as a free download - valeport.download
Connect the Hyperion to DataLog x2 or Terminal x2 using the connect wizard:
Once connected, use the Configure wizard to set the instrument up:
Select your Comm Port, then select Next:

Hyperion Optical Sensors - Operating Manual:
MANUAL-1013637447-3 | issue: 1.6
Page | 13
©2022 –Valeport Ltd
Leave this dialogue in its default settings, then select Next:

Section 3 | Data Acquisition
©2022 –Valeport Ltd
Page | 14
DataLog x2 will now interrogate the instrument and get the settings and display them, then select
Next:
Set your operational mode and Instrument Range setting, then select Next:
Hyperion Fluorometers supplied after November 2020 (Serial No: 75100) do not require the range
to be set. Ignore this setting, if you get an error concerning #400 commands simply ignore it, see
above. Select Next

Hyperion Optical Sensors - Operating Manual:
MANUAL-1013637447-3 | issue: 1.6
Page | 15
©2022 –Valeport Ltd
If there are any new settings to be up loaded to the instrument pressing Finish will send them:
Check that data is being received (field 4) see Data Output Format

Section 3 | Data Acquisition
©2022 –Valeport Ltd
Page | 16
Now check the following:
The LEDs are on and light is being emitted from the fibres.
The magnitude of the data received increases when the supplied fluorescent target is held at 45°
to the sensor window:
By altering the angle of the target, the magnitude of the reading should change thereby showing
the correct operation of the sensor.
If the test target is missing then a piece of good quality white paper can be used.

Hyperion Optical Sensors - Operating Manual:
MANUAL-1013637447-3 | issue: 1.6
Page | 17
©2022 –Valeport Ltd
4 Operation with 400 Series Instruments
If the Hyperion Instrument is used with a 400 series Instrument e.g. MIDAS CTD+ it should be
configured using DataLog x2 software as follows:
Baud Rate:
38400 (#059 38400)
Mode:
Continuous
•The 400 series Instrument must be configured using DataLog Pro ver 04007125F1 or later
•Ensure the 400 unit internal Power source (from 0400550) for the Hyperion is connected as
per cable form 0400C321.
•Ensure the latest version of Hyperion interface code (04007181) is installed in the
Quartzonix Board (0400513)

Section 5 | Electrical
©2022 –Valeport Ltd
Page | 18
5 Electrical
Voltage:
9 - 28V DC isolated
Power:
40mA @ 12V DC
5.1 Connector Pin-Out
Pin
Function
1
RS232 GND
2
Tx 232 out from SVS (485A)
3
Rx 232 in to IPS (485B)
4
+V(8-20 V)
5
/Enable 485
6
-V
Note: to enable RS485 comms, link pins 1 and 5.
5.2 0400 Series Interface Cable
END 1:
Hyperion SUBCON
MCBH6F
END 2: 0400513
(Quartzonix Interface PCB)
END 3:
0400550 (PSU
Switching PCB)
FUNCTION
PIN
CONNECTOR
PIN
CONNECTOR
1
J3, 6 WAY FCI
2
RS232 GND
2
3
RS232 RX (in to logger)
3
1
RS232 TX (out of logger)
4
J2, 2 way FCI
Hyperion Power +’ve
5
NO CONNECTION
(Blank off to prevent
shorting)
6
J2, 2 way FCI
Hyperion Power –‘ve

Hyperion Optical Sensors - Operating Manual:
MANUAL-1013637447-3 | issue: 1.6
Page | 19
©2022 –Valeport Ltd
6 Communications
The instrument will operate in real time, with setup performed by direct communications with PC
before and after deployment.
Both RS232 and RS485 (including Modbus) outputs are available, selected by command code.
RS232 data may be taken directly into a PC over cables up to 200m
RS485 is suitable for longer cables, up to 1000m, and allows for multiple addressed units on a
single cable.
Baud Rate
2400 - 115200
Protocol
8 data bits, 1 stop bit, No parity,
No flow control
6.1 Data Output Format $PVHYP (Pre November 2020)
The Hyperion outputs a single NMEA style data string –Fluorometers pre SN 75100
Example: $PVHYP,01,01,1234.45, 1.2345, 01, C02,*7F
Where:
Field
Number
Description
Type
Description
1
NMEA Header
String
Valeport HYPerion
2
Instrument ID
Integer
3
Parameter ID
Integer
1 = Chlorophyll a
2 = Fluorescein (Uranine)
3 = Rhodamine\Sulforhodamine B
4 = Crude Oil
7 = Phycocyanin (freshwater Blue Green Algae)
8 = Turbidity
4
Parameter Mean
Float
5
Parameter SD
Float
6
Parameter Units
Units
ug/l for Chlorophyll a
ppb for Fluorescein
7
Operating Mode
String
C02 (default)
8
Check Sum
An exclusive OR sum between all characters
between the '$' and the '*'of the string

Section 6 | Communications
©2022 –Valeport Ltd
Page | 20
6.2 Data Output Format $PVHY2 (Post November 2020)
The Hyperion outputs a single NMEA style data string –post November 2020 (Serial No: 75100)
this will be a $PVHY2 format string.
Example - Turbidity: $PVHY2,01,8,0.48705,0.012,NTU,141.65588,0.023,NTU,M1,*6D
Example –Fluorometer: $PVHY2,01,1,0.816,0.012,ug/l,,,,C02,*24
Please note that fields with no data e.g. 2nd parameter data in a fluorometer will be empty but
delimited, as above.
Where:
Field
Number
Description
Type
Description
1
NMEA Header
String
Valeport HYperion2
2
Instrument ID
Integer
Identifies the instrument
3
Parameter ID
Integer
1 = Chlorophyll a
2 = Fluorescein (Uranine)
3 = Rhodamine\Sulforhodamine B
4 = Crude Oil
7 = Phycocyanin (freshwater Blue Green Algae)
8 = Turbidity
4
1st Parameter Mean
Float
5
1st Parameter SD
Float
6
1st Parameter Units
String
ug/l for Chlorophyll a
NTU for turbidity nephelometer
4
2nd Parameter Mean
Float
5
2nd Parameter SD
Float
6
2nd Parameter Units
String
NTU for turbidity backscatter
7
Operating Mode
String
C02 (default)
8
Check Sum
Char
An exclusive OR sum between all characters
between the '$' and the '*'of the string
If the sampling that has been setup such that only one measurement is used to produce a reading
then no Standard Deviation is generated and the output becomes:
Turbidity - $PVHY2,01,8,0.48705,,NTU,1.65588,,NTU,M1,*6D
Fluorometer - $PVHY2,01,1,0.816,,ug/l,,,,C02,*24
Otherwise:
Turbidity - $PVHY2,01,8,0.48705,0.012,NTU,141.65588,0.023,NTU,M1,*6D
Fluorometer - $PVHY2,01,1,0.816,0.012,ug/l,,,,C02,*24
Table of contents
Other Valeport Accessories manuals

Valeport
Valeport miniIPS2 User manual

Valeport
Valeport miniSVS User manual

Valeport
Valeport SWiFT SVP User manual

Valeport
Valeport uvSVX User manual

Valeport
Valeport VRS20 User manual

Valeport
Valeport Hyperion 0901001 User manual

Valeport
Valeport UV-SVP User manual

Valeport
Valeport miniSVS User manual

Valeport
Valeport miniIPS User manual