Accuris SmartDrop L NS1000 User manual

Operation Manual
V1.0
NS1000


Thank you for purchasing the SmartDrop™ L Nano Spectrophotometer. This user
manual details the instrument’s features, specifications, as well as complete
operating instructions; please read it carefully before operation. Keep this user
manual for later use.
Important:
Please keep the box and packaging material for this instrument. If service is
required, the box will be needed to ship the instrument to our Service
Department.
Initial Inspection
Please inspect the instrument as well as all included accessories when you first
open the packaging. If you find anything damaged or missing, please contact
Benchmark Scientific or your local distributor immediately.
BENCHMARK SCIENTIFIC / ACCURIS
INSTRUMENTS
PO Box 709
Edison, NJ 08818
USA
Phone: 908-769-5555
Website: www.benchmarkscientific.com
/ www.accuris-usa.com

Safety Warnings and Guidelines
1. Important information for safe use
Users should understand how to use this instrument before operating.
Please read this manual carefully prior to operation.
Any improper operation may cause injury. Please read this
manual carefully and operate safely according to the guidelines.
2. Operation and Maintenance
The operation and maintenance of the instrument should comply with the basic
guidelines and warnings below. Incorrect operation or maintenance will have
detrimental effects on the life, performance, and safety features of the instrument.
The instrument is a normal indoor instrument which conforms to
classⅠof the GB 4793.1 standard.
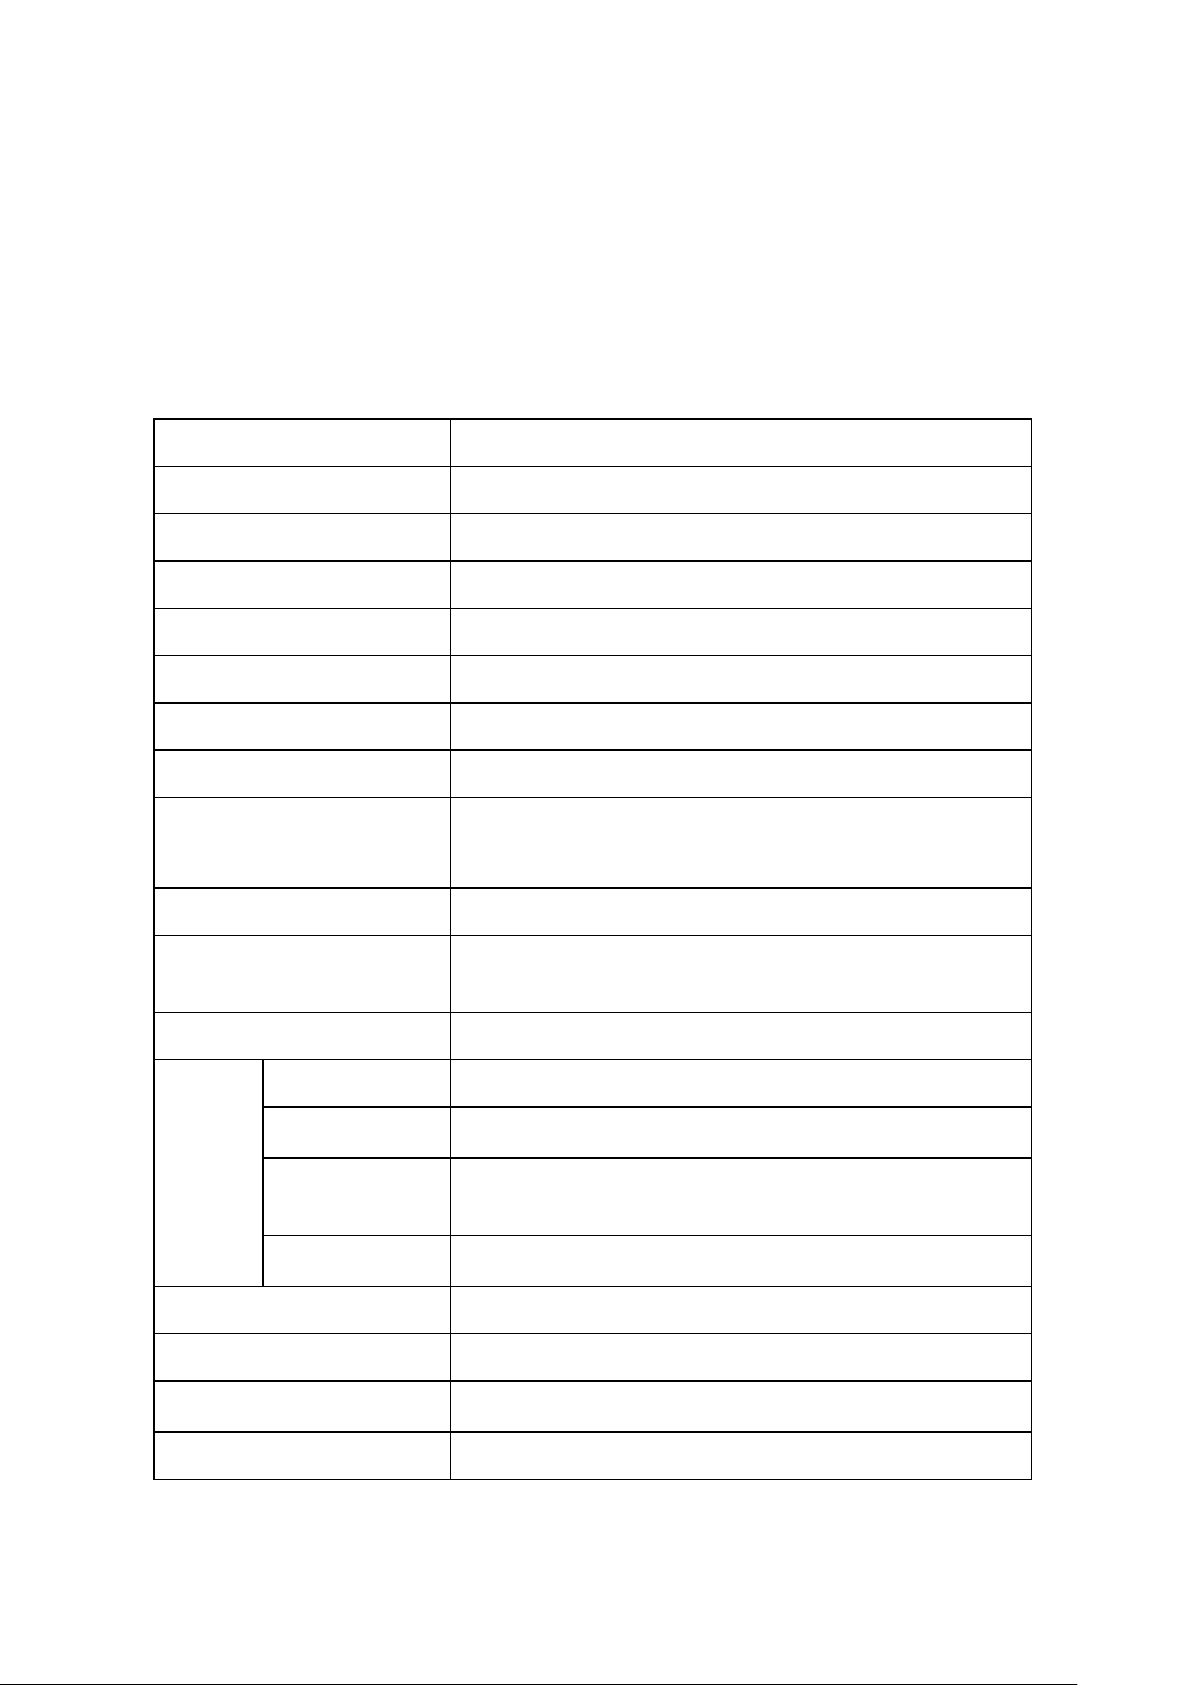
This instrument is designed for use in a laboratory
environment. The device must be operated by skilled
laboratory personnel with appropriate training.
To prevent injury or voiding the warranty, the operator should not
attempt to repair the instrument without explicit guidance from
Accuris Instruments. If service is required, please contact Accuris
Instruments or your local distributor for repair.
Before powering on, confirm that the voltage used meets the
electrical requirements of the instrument as stated on the rating
plate. If the electric cord is damaged, replace it with the same type
of cord. Hold the socket firmly before pulling the plug from an outlet.
Do not pull the electric cord.
The instrument should be installed in an environment of standard
room temperature, low dust, low humidity, and away from direct
sunlight, electromagnetic interference, and heat sources. Do not
block the vents on the instrument.

Always power off the instrument when you are finished using it.
Unplug the power cord and cover the instrument with a cloth or
plastic sheet to prevent excessive dust from entering the housing.
Pull the connector plug from the electrical outlet immediately and
contact the vendor in the event of:
•Liquid entering the housing.
•Abnormal operation: such as any abnormal sound or
smell.
•The instrument is dropped or there is any damage to the
housing.
•Any malfunction.
3. Maintenance
The pedestal should be cleaned regularly using a soft cloth dampened with
deionized water. The instrument housing should be cleaned regularly using a soft
cloth dampened with a small amount of alcohol.

Table of Contents
Chapter 1 Introduction ....................................................................................... 1
1.Key Features ............................................................................................... 1
Chapter 2 Specifications .................................................................................... 2
1.Required Installation Environment ............................................................... 2
2.Specifications............................................................................................... 2
Chapter 3 Instrument Overview ......................................................................... 3
1.Structure ...................................................................................................... 3
2.Sample Size Requirements ......................................................................... 4
3.Dispensing Samples onto The Lower Pedestal ........................................... 4
4.OD600 Measurement .................................................................................. 5
Chapter 4 Programming & Operation................................................................ 6
1.Start-up Interface ......................................................................................... 6
2.Main Menu Interface .................................................................................... 6
3.Nucleic Acids Interface ................................................................................ 7
4.Protein A280 Interface ................................................................................11
7.OD600 Interface ........................................................................................ 13
8.System Settings Interface.......................................................................... 15
Chapter 5 Troubleshooting .............................................................................. 17

1
Chapter 1 Introduction
The SmartDrop™ L nano spectrophotometer measures 1.0µL – 2.0µL samples with
high accuracy and reproducibility and employs surface tension to position the sample
for measurement. The system includes a cuvette slot for OD600 readings & a built-in
printer for printing results. The SmartDrop L can measure highly concentrated samples
without dilution (100X concentration of samples measured by a standard cuvette
spectrophotometer).
1. Key Features
➢User-Friendly Input & Operation – Touch screen for programming and operation (a
mouse can also be connected).
➢Multifunctional software for Nucleic Acids, Protein A280, & OD600 measurements.
➢dsDNA detection range from 10ng/µL – 2500ng/µL.
➢Fast & accurate measurements (< 6 seconds).
➢2 cuvettes included (optical glass) for OD600 measurements.

2
Chapter 2 Specifications
1. Required Installation Environment
Environmental Temperature: 5°C~35°C
Relative Humidity: ≤ 70%
Input Voltage: DC 24V, 2A ( Adapter CSA, UL, CE marked)
2. Specifications
Model
SmartDrop™ L (NS1000)
Minimum Sample Size
1.0μL – 2.0μL
Path Length
0.5mm
Light Source / Life
UV LED / 8000h
Detector Type
UV Silicon Photocell
Wavelength Range
260, 280, 600nm
Wavelength Accuracy
± 1 nm
Absorbance Precision
0.005Abs
Conc. Accuracy
±5ng [10,500)
±2% [500,2000)
±3% [2000,2500]
Absorbance Range
0.2-50 (10mm equivalent)
Detection
Concentration Range
10ng/μL dsDNA ~ 2,500ng/μL dsDNA
Detection Time
< 6 seconds
OD600
Abs range
0~4.000 Abs
Abs stability
[0,3)≤0.5% [3,4)≤2%
Abs
repeatability
[0,3)≤0.5%, [3,4)≤2%
Abs Precision
[0,2)≤0.005A, [2,3)≤1%, [3,4)≤2%
Voltage input
DC 24V, 2A
Power
25W
Dimensions(W×D×H)
20.8cm × 28.0cm ×18.6cm / 8.2in x 11.0in x 7.3in
Weight
3.6 kg / 7.9 lbs

3
Chapter 3 Instrument Overview
1. Structure
Front
Fig. 1 Front
Back
Fig. 2 Back
USB ports
Switch
Power Socket
Lower pedestal
Upper pedestal
Display
Cuvette slot
Built-in printer

4
2. Sample Size Requirements
Surface tension is a critical factor in the formation of the sample column for
measurement. The hydrophobic interactions between water molecules in a sample
solution is key in creating & maintaining surface tension. The presence of solutes
(proteins, DNA, RNA, salt ions, detergent molecules) significantly reduces surface
tension and hinders the formation of the sample column. For most samples, a 1μL
sample size is enough; however, to ensure accurate and precise measurements, a 2μL
sample size is recommended to allow the formation of the sample column for
measurement.
To ensure precise and accurate measurements, it is essential that a complete liquid
column forms between the upper pedestal and lower pedestal. It is recommended that
a precision pipettor (0-2μL) be used to dispense samples.
3. Dispensing Samples onto The Lower Pedestal
Lift the upper pedestal and pipette the sample (1.0µL –2.0μL) onto the lower
pedestal (Fig. 3).
Fig. 3 Dispense Sample Fig. 4 Sample Drop
Lower the upper pedestal onto the sample to form the sample column (Fig. 5).
Fig. 5 Sample Column
Note: Please exercise caution when lowering the upper pedestal onto the sample.

5
To prevent sample carryover, use a soft laboratory wipe and deionized water to clean
both pedestals in between sample measurements (Fig. 6).
Fig. 6 Clean & Wipe Pedestal
4. OD600 Measurement
The SmartDrop L includes a cuvette slot for OD600 measurements. Lift the upper
pedestal to expose the cuvette slot. Select the OD600 interface on the touch screen.
Set a “blank” as required for the experiment (blank = air, empty cuvette, or buffer in
cuvette). Then add 2~3mL of sample into the cuvette. Place the cuvette into the slot
and start the measurement (Fig. 7).
Fig. 7 Cuvette Port
Note:The direction of the light path is shown by the red arrow in the figure above.
Please ensure the cuvette is loaded with the correct orientation.
Cuvette slot
Transparent
surface
Frosted surface

6
Chapter 4 Programming & Operation
1. Start-up Interface
Upon powering on the instrument, it will perform a self-check, and the start-up screen
will be displayed (Fig. 8)
2. Main Menu Interface
After start-up, the main menu interface will be displayed. There are 4 options: Nucleic
Acids, Protein A280, OD600, & System Settings
Fig. 8 Start-up Interface
Fig. 9 Main Menu Interface

7
3. Nucleic Acids Interface
Beer-Lambert’s Law for DNA/RNA quantitation
The following “Beer-Lambert” equation is used to calculate the concentration of
nucleic acids:
𝐶 = 𝐴∗𝜀
𝑏
C=Sample DNA concentration, unit : ng/μL
A=Sample absorbance, unit : A
ε=extinction coefficient, unit: ng-cm/μL
b=Path Length, unit: cm
Standard DNA/RNA extinction coefficients :
dsDNA:50ng-cm/μL
ssDNA:33ng-cm/μL
RNA:40ng-cm/μL
When the sample column is used, highly concentrated nucleic acid samples can be
measured without dilution using a 0.5mm path length. The SmartDrop L will measure
and display sample absorbance values of the 10mm pathlength equivalent of up to
50 A.
The SmartDrop L will accurately measure dsDNA samples up to 2500ng/μL without
dilution.
Select “Nucleic acid” from the main menu to enter the Nucleic Acid Interface:
Fig 10; there are three tabs in the Nucleic Acids Interface: Nucleic Acids, Report, and
Help.
• : The sample ID name has a default value of the current
date and time. Users can rename the sample ID. One sample ID can contain
up to 1000 measurement values.
Fig. 10 Nucleic Acids Interface

8
• : Select the sample type: DNA-50 for dsDNA, RNA-40 for RNA,
ssDNA-33 for ssDNA. For a different nucleic acid type, select “others” and enter
the extinction coefficient.
• : Perform a blank reading. This step is essential before
measurement. Blank absorbance values are typically in the range of 0.004-0.03
Abs and are valid for up to 30 minutes. The instrument will automatically remind
the user to perform another blank reading after 30 minutes.
• : Spectrum normalization; The baseline is automatically set to
the absorbance of the sample at 365nm and can be modified. This feature can
remove spectroscopic signals from sample measurements by subtracting the
measured absorbance at a specified baseline correction wavelength from the
absorbance values at all wavelengths of a measured sample.
oNote: If baseline calibration is not performed, the spectroscopic signals
will not be separated from interference/background effects and will lead
to inaccurate results.
•The icon appears in the upper right corner to indicate an error in reading
blank/sample volumes. Please clean and wipe the pedestal and perform
another blank reading. If the problem persists, contact Accuris Instruments.
Operation:
1. Set the Sample ID.
2. Clean the upper and lower pedestals with a lint-free wipe, add 2μL buffer
solution to perform a blank reading.
3. Clean the buffer solution on the pedestals with a wipe.
4. Measure a 2μL sample volume and click “Measure” to detect the sample.
Note: A blank reading must be performed prior to sample measurements. The
sample volume must be equivalent to the volume used to set the blank
reading.
5. Clean and dry the pedestal between measurements.

9
Fig. 11 Nucleic Acid Sample Results
The sample concentration and absorbance ratios will display on the left side of the
interface (Fig. 12).
Fig. 12 Sample Concentration & Absorbance Ratios
Conc.:Calculated nucleic acid concentration.
A260: The sample absorbance at 260nm (10mm pathlength equivalent).
A280: The sample absorbance at 280nm (10mm pathlength equivalent).
A260/A280: The ratio of corrected absorbance values at 260nm to corrected
absorbance values at 280nm. An A260/A280 ratio of ~1.8 is generally accepted as
pure for DNA (~2.0 for RNA). Acidic solutions will under-represent the A260/A280
ratio by 0.2 – 0.3 units, whereas basic solutions will over-represent the A260/280
ratio by 0.2 – 0.3 units.
: Begin sample measurement.
: Print the calculated data.
: Return to the main menu interface.

10
Nucleic Acid Report Interface
Fig. 13 Nucleic Acid Report Interface
Select the “Report” tab at the top of the Nucleic Acid Interface (Fig. 13).
Users can select previously saved results by the file name.
: Print the selected data from the built-in printer.
: Export the result to a USB flash drive.
: Delete the selected results.
: Delete the selected files

11
4. Protein A280 Interface
Introduction
The Protein A280 interface can be used to quantify purified proteins that contain amino
acids such as tryptophan, tyrosine, or cys-cys disulfide bonds. These amino acids
exhibit peak absorbance at 280nm. The following sample types can be selected:
“A280”, “BSA”, “IgG”, “Lysozyme”, & “Others”.
This interface does not require the generation of a standard curve. Sample absorbance
values (260nm & 280nm) and A260/A280 ratios can be measured and displayed. A
baseline correction can be used for normalization. Like the Nucleic Acids interface, the
Protein A280 interface automatically displays 10mm pathlength equivalent data.
Protein A280 Interface
Select “Protein A280” from the main menu interface.
Fig. 14 Protein A280 Interface
Fig. 14; There are three options at the top of the screen, Protein A280, Report, and
Help.
• : The sample ID name has a default value of the current
date and time. Users can rename the sample ID. One sample ID can contain
up to 1000 measurement values.
• : Select the sample type: A280, BSA, IgG, Lysozyme. Select
“others” and type in the extinction coefficient.
• : Perform a blank reading. This step is essential before
measurement. Blank absorbance values are typically in the range of 0.004-0.03
Abs and are valid for up to 30 minutes. The instrument will automatically remind
the user to perform another blank reading.

12
•The icon appears in the upper right corner to indicate an error in reading
blank/sample volumes. Please clean and wipe the pedestal and perform
another blank reading. If the problem persists, contact Accuris Instruments.
Operation:
6. Set the Sample ID.
7. Clean the upper and lower pedestals with a wipe, add 2μL buffer solution to
perform a blank reading.
8. Clean the buffer solution on the pedestals with a wipe.
9. Measure a 2μL sample volume and click “Measure” to detect the sample.
Note: A blank reading must be performed prior to sample measurements. The
sample volume must be equivalent to the volume used to set the blank
reading.
10.Clean and dry the pedestal between measurements.
Fig. 15 Protein Sample Results
The sample concentration and absorbance ratios will display on the left side of the
interface (Fig. 16).
Fig. 16 Sample Concentration & Absorbance Ratios
Conc.: Calculated protein concentration.
A260: The sample absorbance under 260nm (10mm pathlength equivalent).
A280: The sample absorbance under 280nm (10mm pathlength equivalent).
A260/A280: The ratio of corrected absorbance values at 260nm to the corrected
absorbance values at 280nm.This ratio can be used as a secondary measure of

13
nucleic acid purity. An A260/A280 ratio within the range of ~1.8 – 2.2 as pure for
nucleic acids. Lower ratio values indicate the presence of contaminants that absorb
strongly at or near 280nm.
Protein A280 Report Interface
Fig. 17 Protein Report Interface
Note: This interface is similar to the Nucleic Acids detection interface (see section 3).
5. OD600 Interface
Introduction
The OD600 function allows for measuring absorbance values at 600nm. It is commonly
used for measuring the growth rate of bacterial cell cultures by measuring absorbance
of the culture in growth media at 600nm. The Beer-Lamber equation is used to
calculate the concentration (see section 3). This interface does not require the
generation of a standard curve.

14
OD600 Measurement
Fig. 18 OD600 Detection Interface
Operation
1. Set the Sample ID.
2. Clean the upper and lower pedestals; add 2μL buffer solution to perform a
blank reading.
3. Clean the buffer solution on the pedestals.
4. Measure a 2μL sample volume and click “Measure” to detect the sample.
Note: A blank reading must be performed prior to sample measurements. The
sample volume must be equivalent to the volume used to set the blank
reading.
5. Clean and dry the pedestal between measurements.
OD600 Report Interface
Fig. 19 OD600 Report Interface
Note: This interface is similar to the Nucleic Acids detection interface (see section 3).
Table of contents
Other Accuris Laboratory Equipment manuals

Accuris
Accuris SmartDoc 2.0 User manual

Accuris
Accuris SmartDoc 2.0 User manual

Accuris
Accuris ASPIRE User manual

Accuris
Accuris isoPURE Mini User manual

Accuris
Accuris AutoMATE 96 User manual

Accuris
Accuris SMARTREADER MULTIMODE User manual

Accuris
Accuris MyGel Mini User manual

Accuris
Accuris Smartdoc 2.0 User manual
Popular Laboratory Equipment manuals by other brands

Beckman Coulter
Beckman Coulter Optima MAX-TL Instructions for use

Panasonic
Panasonic ZIAINO F-JPU70M operating instructions

Ivoclar digital
Ivoclar digital PrograPrint PR5 Short instructions

Shoreline Biome
Shoreline Biome Shoreline Breaker user manual

InnovaPrep
InnovaPrep CP Select user guide

WPI
WPI CLEANRAY-1000 instruction manual