Attonics Systems ATTO3 User manual
ATTO3Manual 1.6
1
ATTO3 Spectrometer
Atto3 Manual 1.6
Jun 2020
Disclaimer:
By using this product, you agree to the terms and conditions of the non-disclosure agreement
(NDA), and further to the lending agreement or to the license agreement or to the general
T&Cs of sales.
Attonics Systems reserves the right to make changes, corrections, modifications or
improvements, to this document, and the products and services described herein at any time,
without notice.
Limit of Liability
Every effort has been made to make this manual as complete and as accurate as possible,
but no warranty or fitness is implied. The information provided is on an “as is” basis. Attonics
Systems assumes no liability whatsoever relating to the use of product by you or third parties.

ATTO3Manual 1.6
2
Table of Contents
TABLE OF CONTENTS ................................................................................................................2
MANUAL REVISION HISTORY ....................................................................................................3
WHAT’S INSIDE THE BOX...........................................................................................................4
BEFORE YOU START ..................................................................................................................4
CAUTION.......................................................................................................................................4
DEVICE FEATURES .....................................................................................................................5
TECHNICAL SPECS .....................................................................................................................6
QUICK STARTUP GUIDE .............................................................................................................7
GENERAL INTRODUCTION.........................................................................................................9
SPECTROSCOPY INTRODUCTION ..........................................................................................11
WHAT IS SPECTROSCOPY? ........................................................................................................11
SOFTWARE DESCRIPTION.......................................................................................................14
ATTOVIEW SOFTWARE MAIN SCREEN ........................................................................................14
SOFTWARE FEATURES ............................................................................................................15
ACQUISITION MODES.................................................................................................................15
SPECTROMETER CONTROLS : ....................................................................................................15
INDICATOR BAR.........................................................................................................................16
SAVING DATA............................................................................................................................17
SPECTRAL PROCESSING.........................................................................................................17
COLLECT DARK,REFERENCE AND BRIGHT SPECTRUM ................................................................17
SPECTRAL VIEW MODES............................................................................................................18
SPECTRAL PROCESSING............................................................................................................18
OTHER FEATURES ....................................................................................................................18
PLOTTING FEATURES ................................................................................................................18
APPLICATIONS...........................................................................................................................19
ILLUMINATION CONTROL ............................................................................................................20
APP 1: COLORIMETRY..............................................................................................................21
STANDARD PROCEDURE ............................................................................................................21
APP 2: TIME SERIES..................................................................................................................23
STANDARD PROCEDURE ............................................................................................................23
APP 3: RECORDING ..................................................................................................................24
STANDARD PROCEDURE ............................................................................................................24
APPENDIX NOTES .....................................................................................................................25
AN1. CHOOSING THE CORRECT WHITE STANDARD FOR COLORIMETRY .........................................25
TROUBLESHOOTING ................................................................................................................26

ATTO3Manual 1.6
3
Manual Revision History
Ver
Release Date
Notes
Affected Sections
1.0
08/07/2019
First Formal Release
1.3
04/11/2019
Updated Software look and
feel and added technical
notes
1.4
04/12/2019
Added new software
features, application notes
1.5
12/03/2020
Added White lid
referencing procedure to
the appendix AN1.
1.6
2/6/2020
Added the section for
App3: Recording

ATTO3Manual 1.6
4
What’s Inside the Box
1
Attonics Spectrometer
2
USB3.0 interface cable
3
Flash drive
Before you start
Hardware Requirements
CPU
Intel Core 2 Duo or higher
RAM
4 GB or higher
Hard Drive
Space
1 GB for the software
USB Port
USB 3.0 port(preferred)
USB 2.0 port compatible
Software Requirements
Operating System
Windows 10
Caution
Mechanical Shock
This product is sensitive to mechanical
shock, improper handling can cause
permanent damage to the product. Do
not handle or expose to shock while
product is in operation. Handle with great
care.
Heat Build-up
It is recommended to disconnect the
device when not in use. The electronic
components inside may cause a heat
build-up inadvertently leading to partial
damage or failure.
Install Software before Connecting
Be sure to install the software BEFORE
connecting the spectrometer to your PC.
The software installs the drivers required
for spectrometer installation. If you do
not install the software first, the computer
will not properly recognize the
spectrometer.
Safety from dirt and liquid
To ensure the optimal performance of
the device, please ensure that no solids
or liquids enter. the spectrometer
through the input port.
Active Illumination based Devices
Beware of the illumination light sources
at the entrance of the spectrometer. The
light sources are very bright for normal
viewing and should not be directly
viewed at any point of time. Bright light
exposure can cause temporary
blindness.
ATTO3Manual 1.6
5
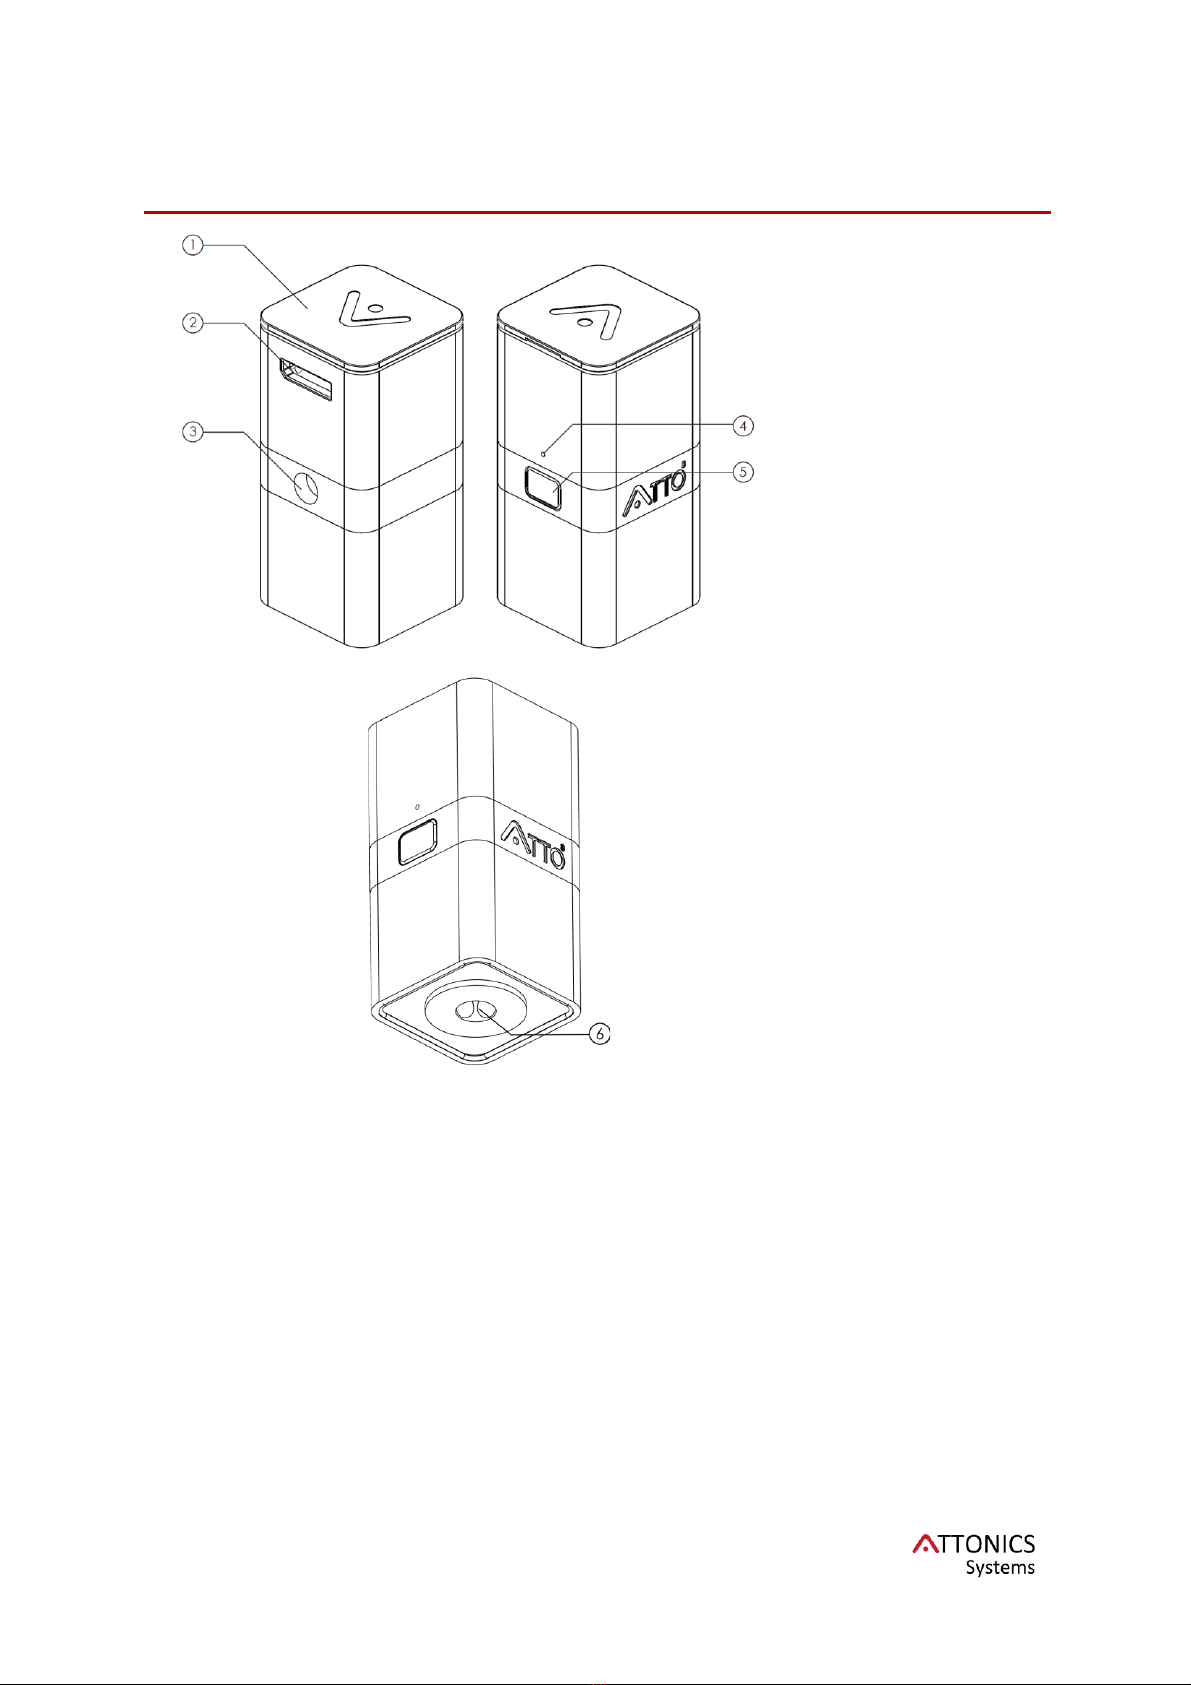
Device Features
Figure 2.
1. Reference
Standard / Safety
Cover
2. Female USB 3.0
Micro B port
3. Tripod Socket
4. LED Indicator
5. Snap Button
6. Spectrometer
Entrance Port

ATTO3Manual 1.6
6
Technical Specs
Wavelength Range
380 nm –1020 nm
Peak Repeatability
< 1 nm
FWHM
12 nm (customisable to 2 nm)
SNR
> 1000:1
Dynamic Range
12 bit
Integration Time
10 µs to 1 s
Numerical Aperture
0.3 *
Measurement Speed
50 frames per sec*
LED*
White High CRI LED
UV LED(398 nm),
Supply Voltage
5 V, USB based connection
Power Consumption
0.4 W (CMOS)
0.1 to 1 W (LEDs) *
Operation Temperature
–30°C to +70°C
Size / Dimensions
32 mm x 32 mm x 64 mm
* based on configuration, customisable
ATTO3Manual 1.6
7
Quick Startup Guide
1
Install the software located inside the flash-drive provided by Attonics.
Run the attonicssetup1.X.X.exe using administrator privileges. Password for the
setup is “atto3”. In case of an error during auto-launch of Attoview.exe, please
ignore and open it manually from the installed location.
Tip: check the check box - place a shortcut on desktop
2
Launch the Attonics software AttoView.
3
Locate the USB cable provided with the spectrometer. Connect the USB type-A end
to the computer and USB type-micro B end to the Attonics spectrometer.
4
The software detects the device as soon as it is connected.
5
Once it is connected, all the features based on the spectrometer are activated.
6
You can capture the spectrum in the following modes:
1. Acquire Live
2. Acquire a Snap
3. Acquire Snap using HW trigger
7
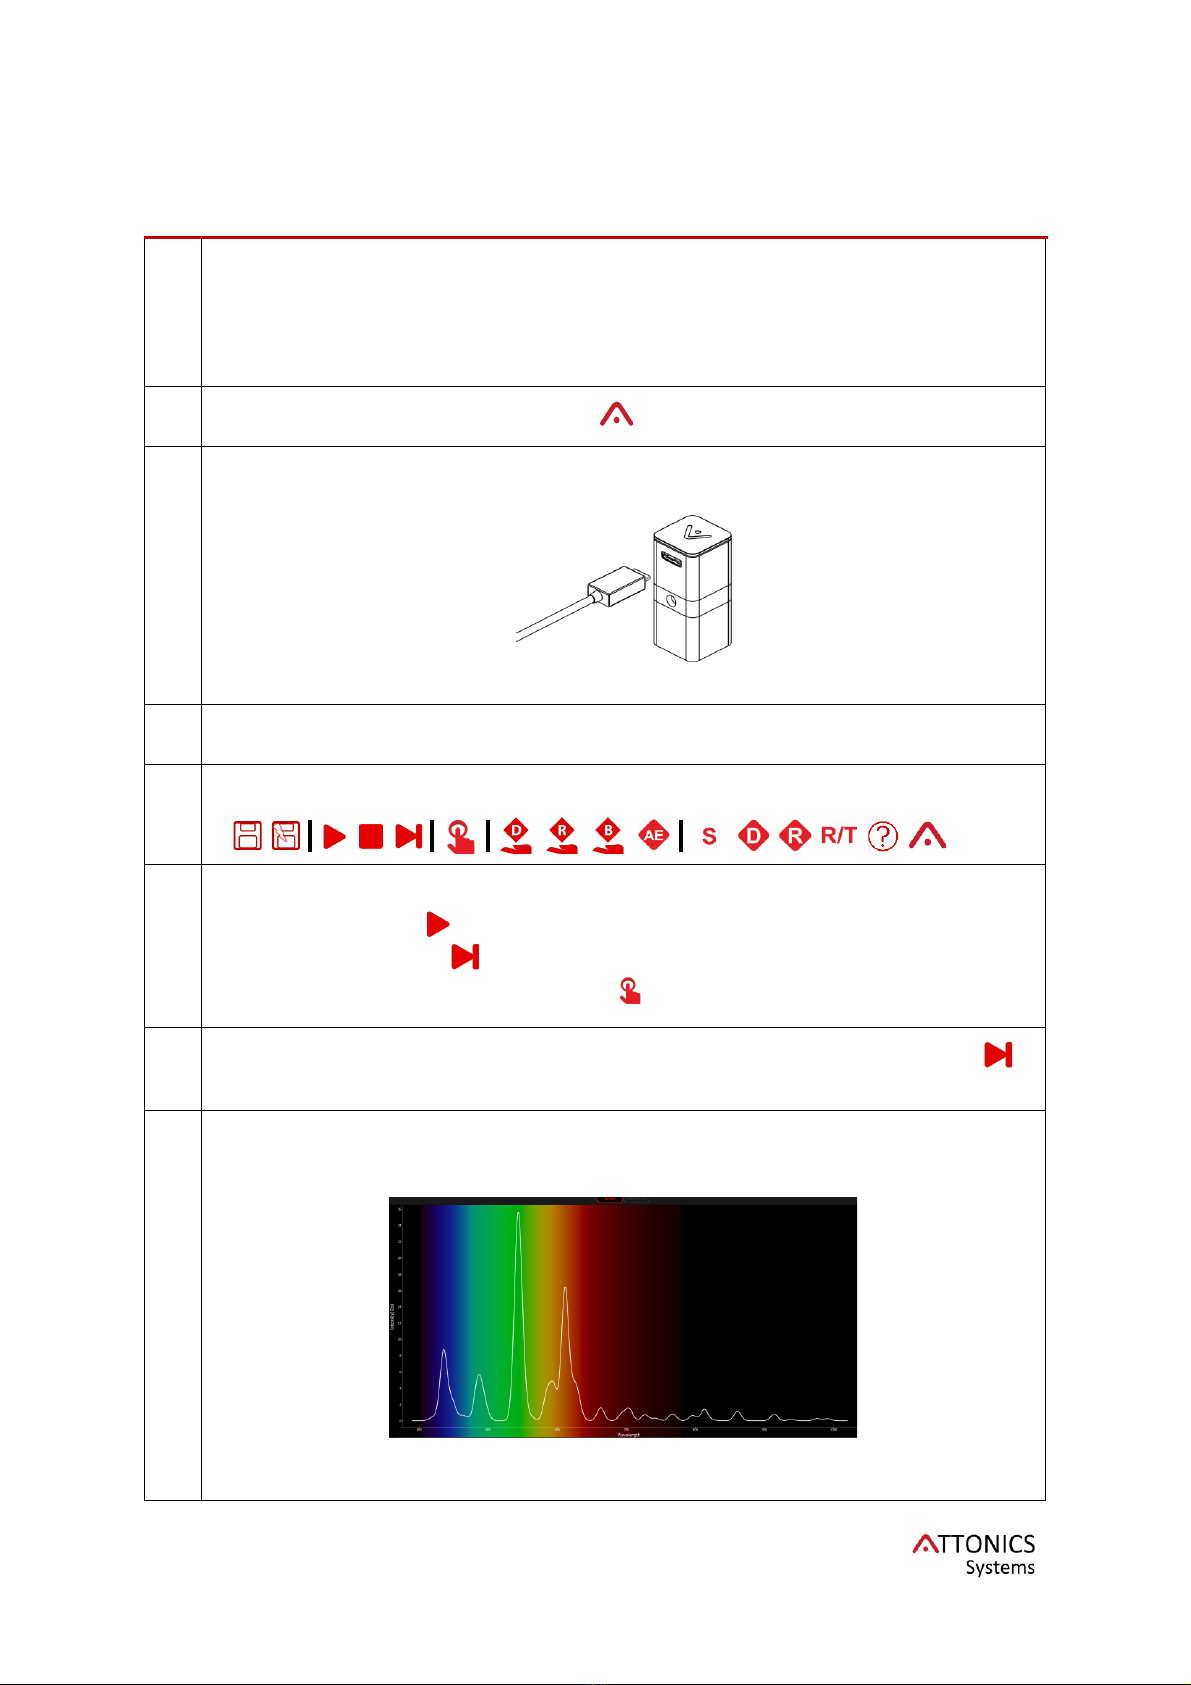
Place your spectrometer bottom side up looking at any ceiling light. Click Snap
icon to get a single shot spectrum of the light source.
8
If you see a spectrum in the spectral window, you have now been initiated into the
black magic of spectroscopy. You are welcome! Go ahead and explore all the
features to make full use of our spectrometer.
Typical spectrum recorded by our spectrometer for a fluorescence lamp

ATTO3Manual 1.6
8

ATTO3Manual 1.6
9
General Introduction
Attonics Systems is disrupting the field of spectroscopy. Our innovative spectrometers are
based on a novel interferometer design that allows the spectrometer to be as compact as
possible yet comparable to a lab grade spectrometer. Our patented manufacturing technique
enables a new platform for spectroscopy based on interferometry instead of conventional
gratings. By realizing a spectrometer conveniently held within your palm and yet have
research grade precision is a revolution. Our compact, rugged spectrometers are easily
adaptable to any existing optical setup for spectral monitoring.
Unique Features
•Compact Size
•Low Cost
•Interferometer based sensor: High resolution, high throughput as opposed to high
resolution low throughput for grating based spectrometers
•Wide range spanning the entire CMOS range (380-1020)
•1 nm repeatability
•12 nm FWHM (customizable down to 2 nm)
Cost effectiveness and compactness
High resolution and lab grade spectrometers and spectrophotometers are expensive with a
price tag in excess of US$ 20k and difficult to maintain. The cost for using spectrometers as
detectors is, therefore, cost-prohibitive and many applications can’t afford precise spectral
monitoring. We overcome the cost disadvantage while providing high spectral resolution for
process monitoring. The dimensions of the active device are 32 x 32 x 66 mm3 making it
ultra-compact and suitable for applications hitherto impossible. Compact size means it can
be easily adapted to any viewport.
(a)
(b)
Fig. 1: a) Schematic of a grating spectrometer dispersing a collimated beam of light
impinging on the grating into its spectral components. A detector downstream the grating
reads the individual wavelengths as a function of angle or location. Spectral separation
depends on collimation, dispersion and distance from the grating. b) Schematic of the
Attonics Systems interferometer. A collimated beam of light transmits through a 3-
dimensionally structured micro/nano textured surface. Light rays interfere and form a unique
fringe pattern on an array detector in proximity. The forming fringe pattern are
mathematically translated into spectral information. Spectral separation depends on the
maximum phase delay generated in the textured surface.

ATTO3Manual 1.6
10
(a)
(b)
Fig. 2: a) Typical interference pattern for oxygen plasma, b) Spectra computed from the
interference pattern. The oxygen plasma is maintained with a 20 SCCM gas flowrate at a
pressure of 150 mTorr and 100 W RF Power. The inset of the figure shows a magnified view
of oxygen emission lines in the spectral band ranging from 750 to 890 nm.
Interference vs Dispersion
Contrary to conventional UV-VIS spectrometers which rely on the dispersion of a collimated
beam of electromagnetic radiation into its spectral elements by a high precision, finely ruled
and costly grating, we utilize a static array of unique interferometer channels producing a
distinctive wavelength dependent interference pattern on a detector array (Fig. 1). Each
interference pattern is unique to a given wavelength and can be mathematically translated
into spectral information. Fig. 2(a) demonstrates a typical interference pattern recorded by
our spectrometer capturing the oxygen plasma emission.
Unlike the dispersion of light e.g. by a grating (requiring a wave to travel comparably long
distances until it separates into spectral components), the interference allows us to
construct extremely compact spectral solutions thereby saving cost and space.
Furthermore, our interferometer array allows large field of views while offering the
multiplexing advantage known for conventional Fourier transform interferometers.
The interferometer chip is placed in front of a CCD or CMOS array detector into a collimated
beam of light coming from the plasma source. In its essence, our interferometer chip
converts a standard monochrome camera into a spectrometer engine. The spectral working
band of the camera thereby determines the spectral bandwidth of the device. Its spectral
resolution is tailored by the design of the chip and mainly governed by the maximum optical
path difference generated in the interference structure of the chip. In the current device, the
peak full-width-half-maximum is 12 nm. Its spectral bandwidth is determined by the
sensitivity curve of the CMOS detector and ranges from 380 nm to 1000 nm whereby our
chip enables a 1 nm wavelength interval throughout. Neither order sorting filters nor long
collimators are required further reducing the complexity of the optical system to a bare
minimum.
400 500 600 700 800 900 1000
Wavelength (nm)
0
10
20
30
40
50
60
Intensity (a.u.)
10-3
750 770 790 810 830 850 870 890
842
776.4
ATTO3Manual 1.6
11
Spectroscopy Introduction
What is spectroscopy?
Spectroscopy in its broadest sense is the study of the interaction between matter
and electromagnetic radiation. Spectroscopy involves separating light into its
constituent wavelengths and reading out the intensity distribution versus
wavelength. Different methodologies of spectroscopy provide information of the
sample based on its interaction with electromagnetic radiation. Measurement of
scattering, reflection of incident radiation from a surface/sample provides its
scattering properties. One can also measure the transmission of electromagnetic
radiation and estimate its absorbance that unravels the molecular fingerprints of the
constituents of the sample be it solid, liquid or gas.
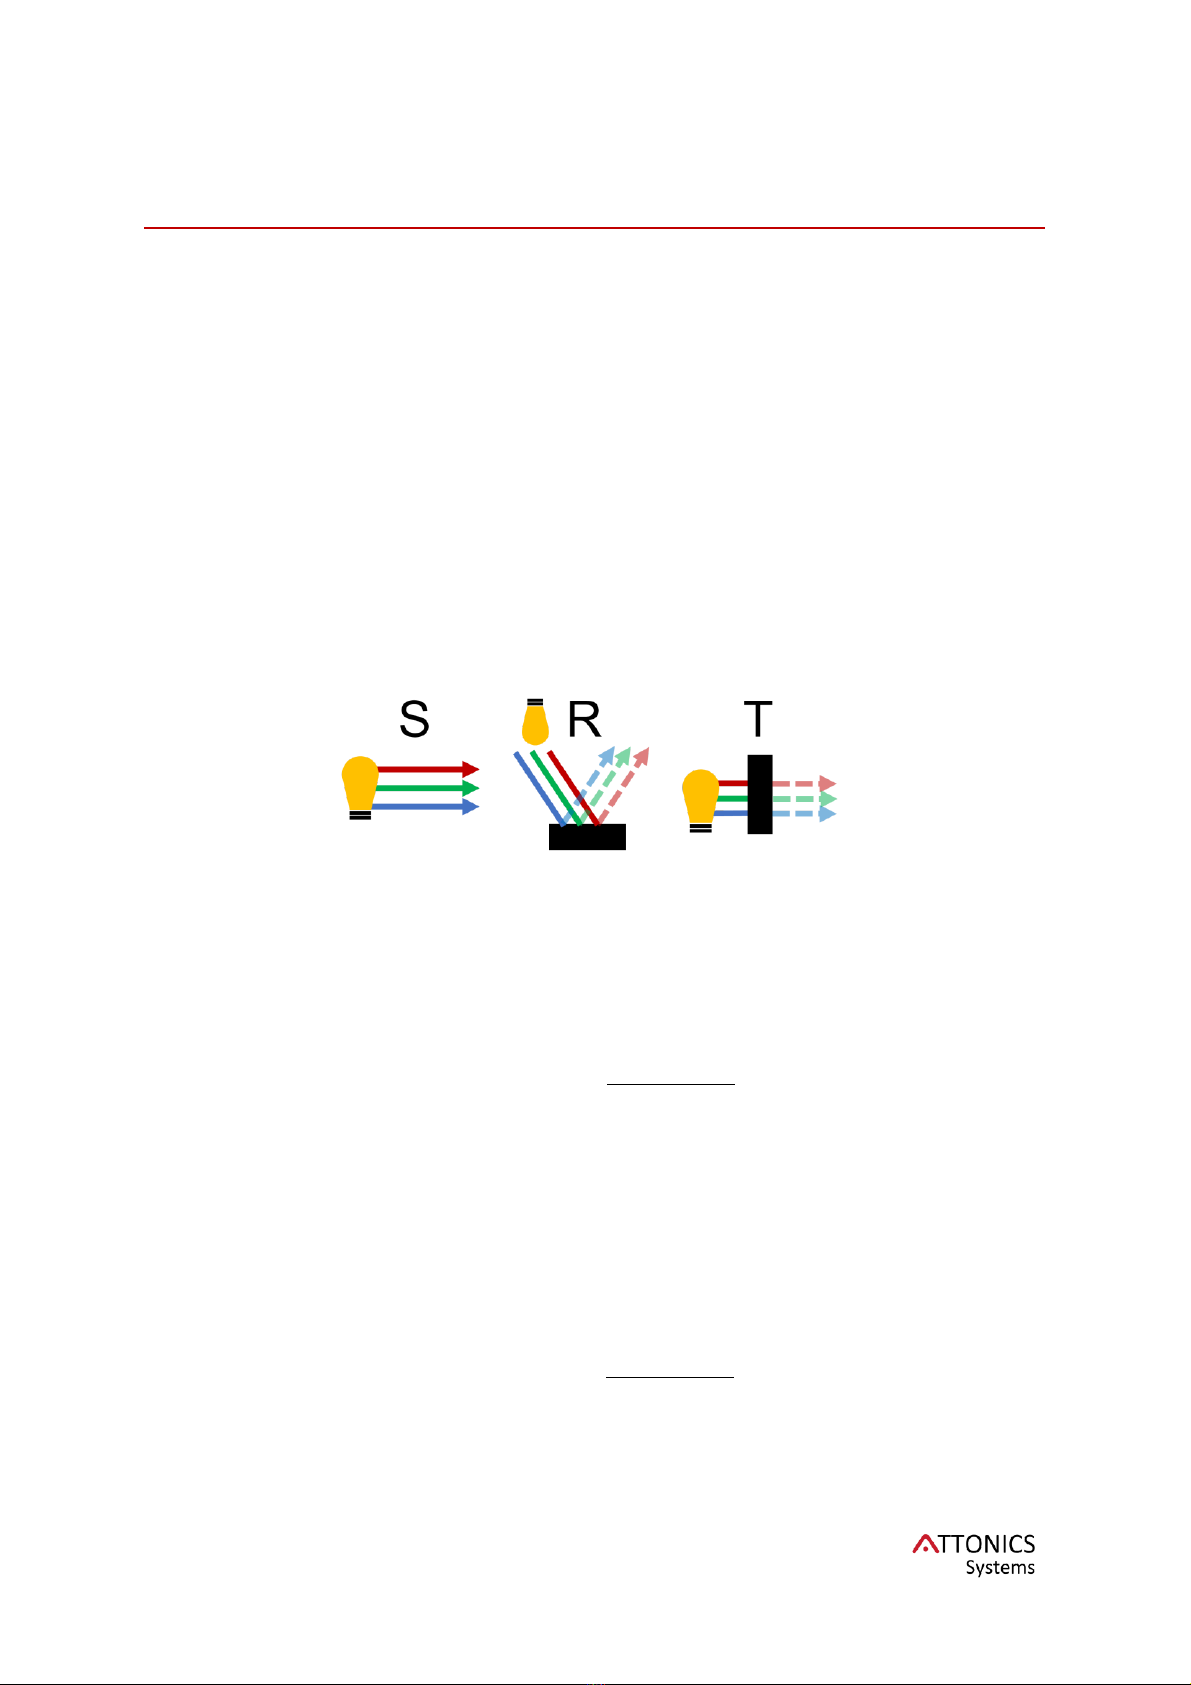
Reflectance, Transmittance & Absorbance
The reflectance (R(λ)) of an object is measured as follows:
•Measure Dark Spectrum(optional)
•Measure the spectrum of the illuminant also known as bright spectrum (B(λ))
•Optionally subtract the dark spectrum (D(λ))
•Divide the measured spectrum (S(λ)) by the bright spectrum (B(λ))
The transmittance (T(λ)) of an object is measured as follows:
•Measure Dark Spectrum(optional)
•Measure the spectrum of the illuminant also known as bright spectrum (B(λ))
•Optionally subtract the dark spectrum (D(λ))
•Divide the measured spectrum (S(λ)) by the bright spectrum (B(λ))
Absorbance is typically derived as follows:

ATTO3Manual 1.6
12
Typically, Beer’s law is used for the calculation of absorbance for liquid/solution
samples. According to Beer’s Law (also known as Beer-Lambert law) that the
absorbance of a solution will depend directly on the concentration (c) of the
absorbing molecules and the pathlength (l) travelled by light through the solution.
where is the molar absorptivity of the sample. By measuring the transmittance
also given as
, we can estimate the absorbance as follows:
where A(λ) is dimensionless.
Fluorescence
Fluorescence is a very important technique to resolve single molecules and
commonly used to understand the electronic structure of a molecule or an atom.
Fluorescence is the light emitted by an electron that is excited from ground state to
excited state by a photon. The emitted light typically has longer wavelength than the
wavelength of excitation.
Most of the dyes generally have an absorption peak in the UV (360-400 nm) region
of the electromagnetic spectrum. Attonics spectrometers can be customized to UV
LED or any desired illumination for measuring fluorescence. For example, if a
sample is excited at UV, the UV light is filtered using a long pass filter above the
excitation wavelength to avoid saturation of the detector caused by the UV light
source.
Colorimetry
As for every spectroscopy system, the Atto3sample measurement consists of two
independent measurements, a reference and a sample spectrum measurement:
First, a bright spectrum must be taken. The bright spectrum measures the
emission of the spectrometers light source alone. To take the bright spectrum the
device is placed onto, e.g. a white reference surface meant for colorimetry and the
bright or reference spectrum is recorded. This measurement is commonly referred
to as the source spectrum I0 (λ). The user confirms the measurement of the white
standard by pressing “collect bright spectrum”.
Second, the sample measurement is taken IS (λ)by placing the device onto the
sample surface.
The device then computes the sample reflectance spectrum R()by:
In the Atto3software, once the bright spectrum is taken, the computation of
reflectance spectrum R(λ) is automatically implemented, subsequent spectra are
compared against the bright spectrum. To be able to see the reflectance spectrum,
please enable the Reflectance Tab on the plot. This disables the Scope tab.
Reflectance is plotted as a normalized spectrum ranging from 0 to 1. Since the

ATTO3Manual 1.6
13
source spectrum spans from 400 to 750 nm, hence the reflectance plot is only
plotted from 400 to 750 nm.
All related colour information such as colour coordinates (CIE, CIE LAB, sRGB) are
computed from the reflectance spectrum R(λ).
Consequently, the correct measurement of I0 (λ)by appropriate selection of a
reference surface are of paramount importance, particularly when accurate colour
data is required. This is further discussed in the appendix note AN1.
ATTO3Manual 1.6
14
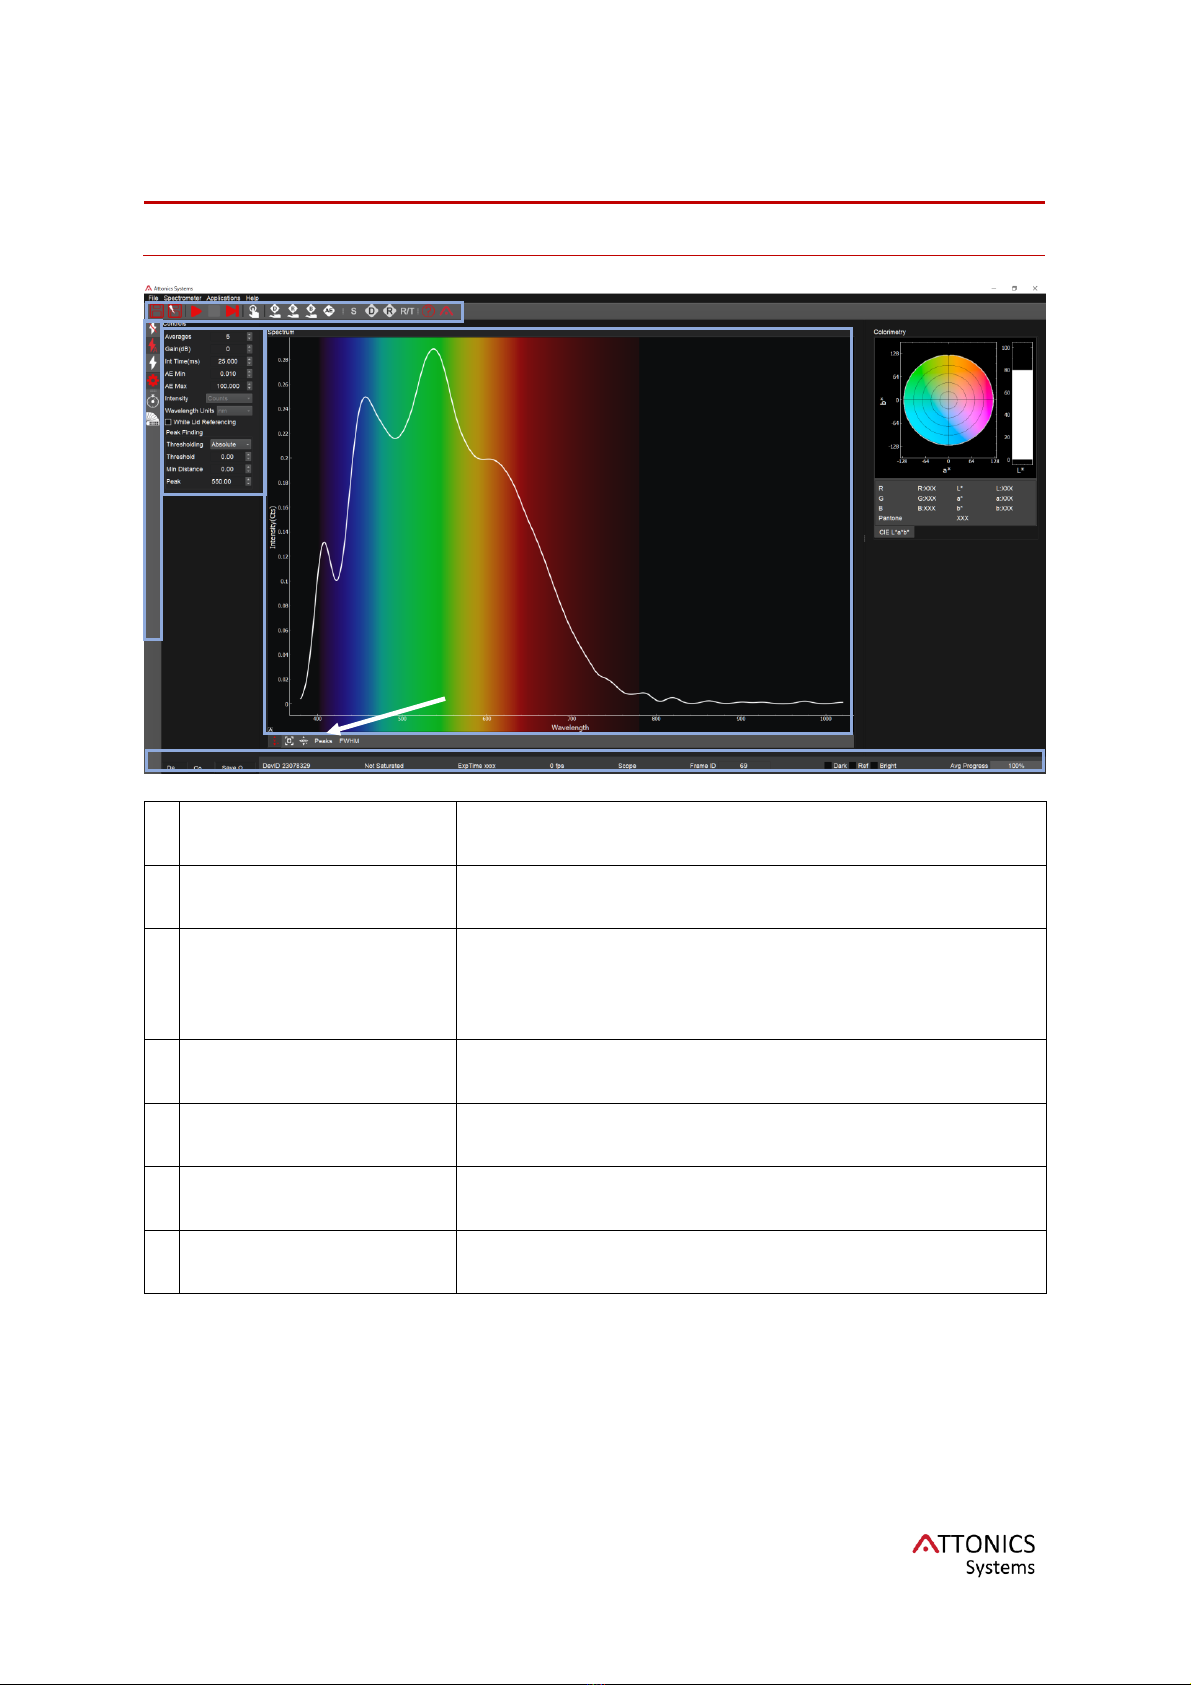
Software Description
AttoView Software Main Screen
1
Controls
Spectrometer’s settings such as gain and integration
time are set here.
2
Spectrum Window
This is where the spectrum appears.
3
Main toolbar
Acquisition Modes, Collect Dark, Reference, Bright
And Post processing of spectra can be done here:
Scope, Dark Correction (DC), Reference Correction
(RC), Reflectance/Transmittance Mode (R/T)
4
Side toolbar
Toolbar for Flash Settings, Trigger, Colour and Time
Series
5
Plot features
Plot scale settings, peak finder and FWHM
6
Indicators
Device details and status indicators from the
connected spectrometer are displayed here
7
Colorimetry charts
RGB values and CIE Lab, xy charts
6
2
1
3
4
7
5

ATTO3Manual 1.6
15
Software Features
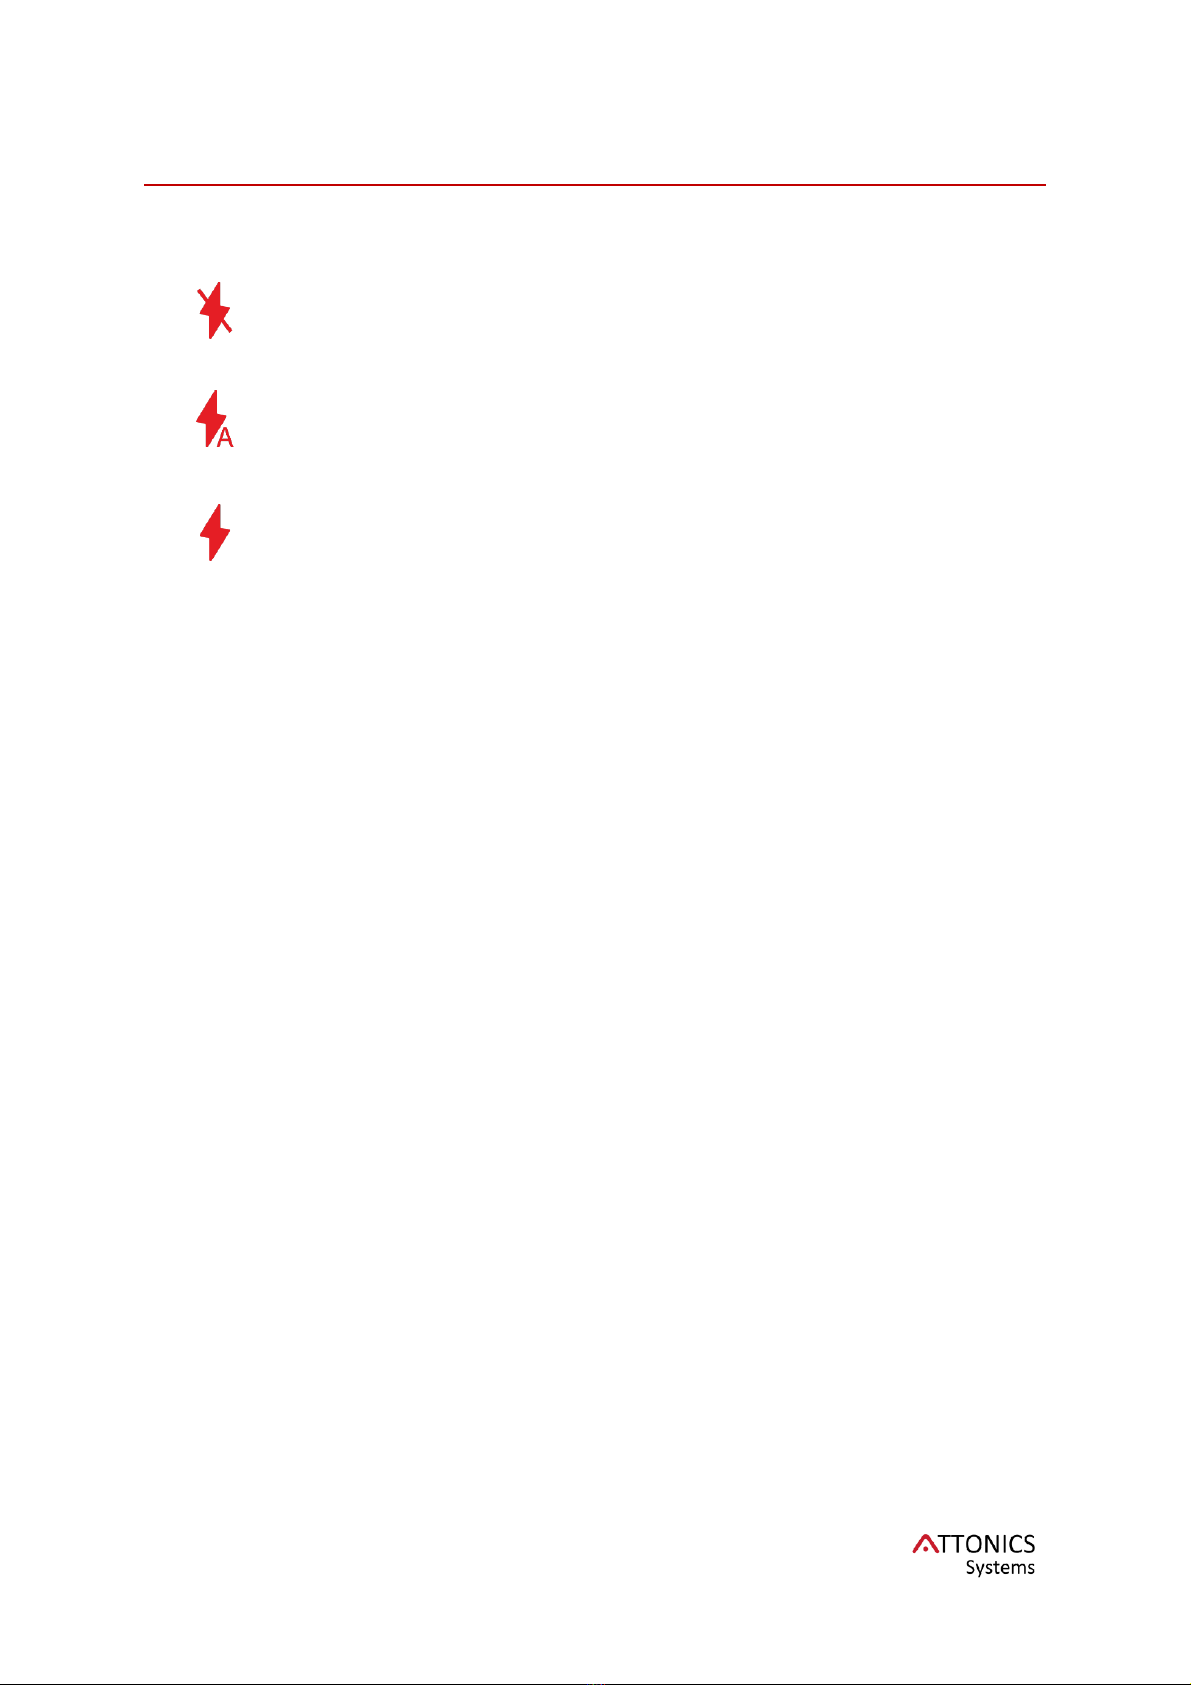
Acquisition Modes
Live Acquire: This is a continuous (free run) acquisition mode. The
spectra are collected as rapidly as permissible by the spectrometer. For
continuous or transient monitoring, this acquisition method is
recommended.
Snap: This mode enables software triggered single shot spectrum
acquisition. The spectrum is collected only once. For single shot
evaluation of your sample, this method is recommended.
HW trigger Snap: This enables HW triggered acquisition mode. The
spectrum is collected only once when the switch on top of the
spectrometer is clicked. For single shot evaluation of your samples, this
method is recommended.
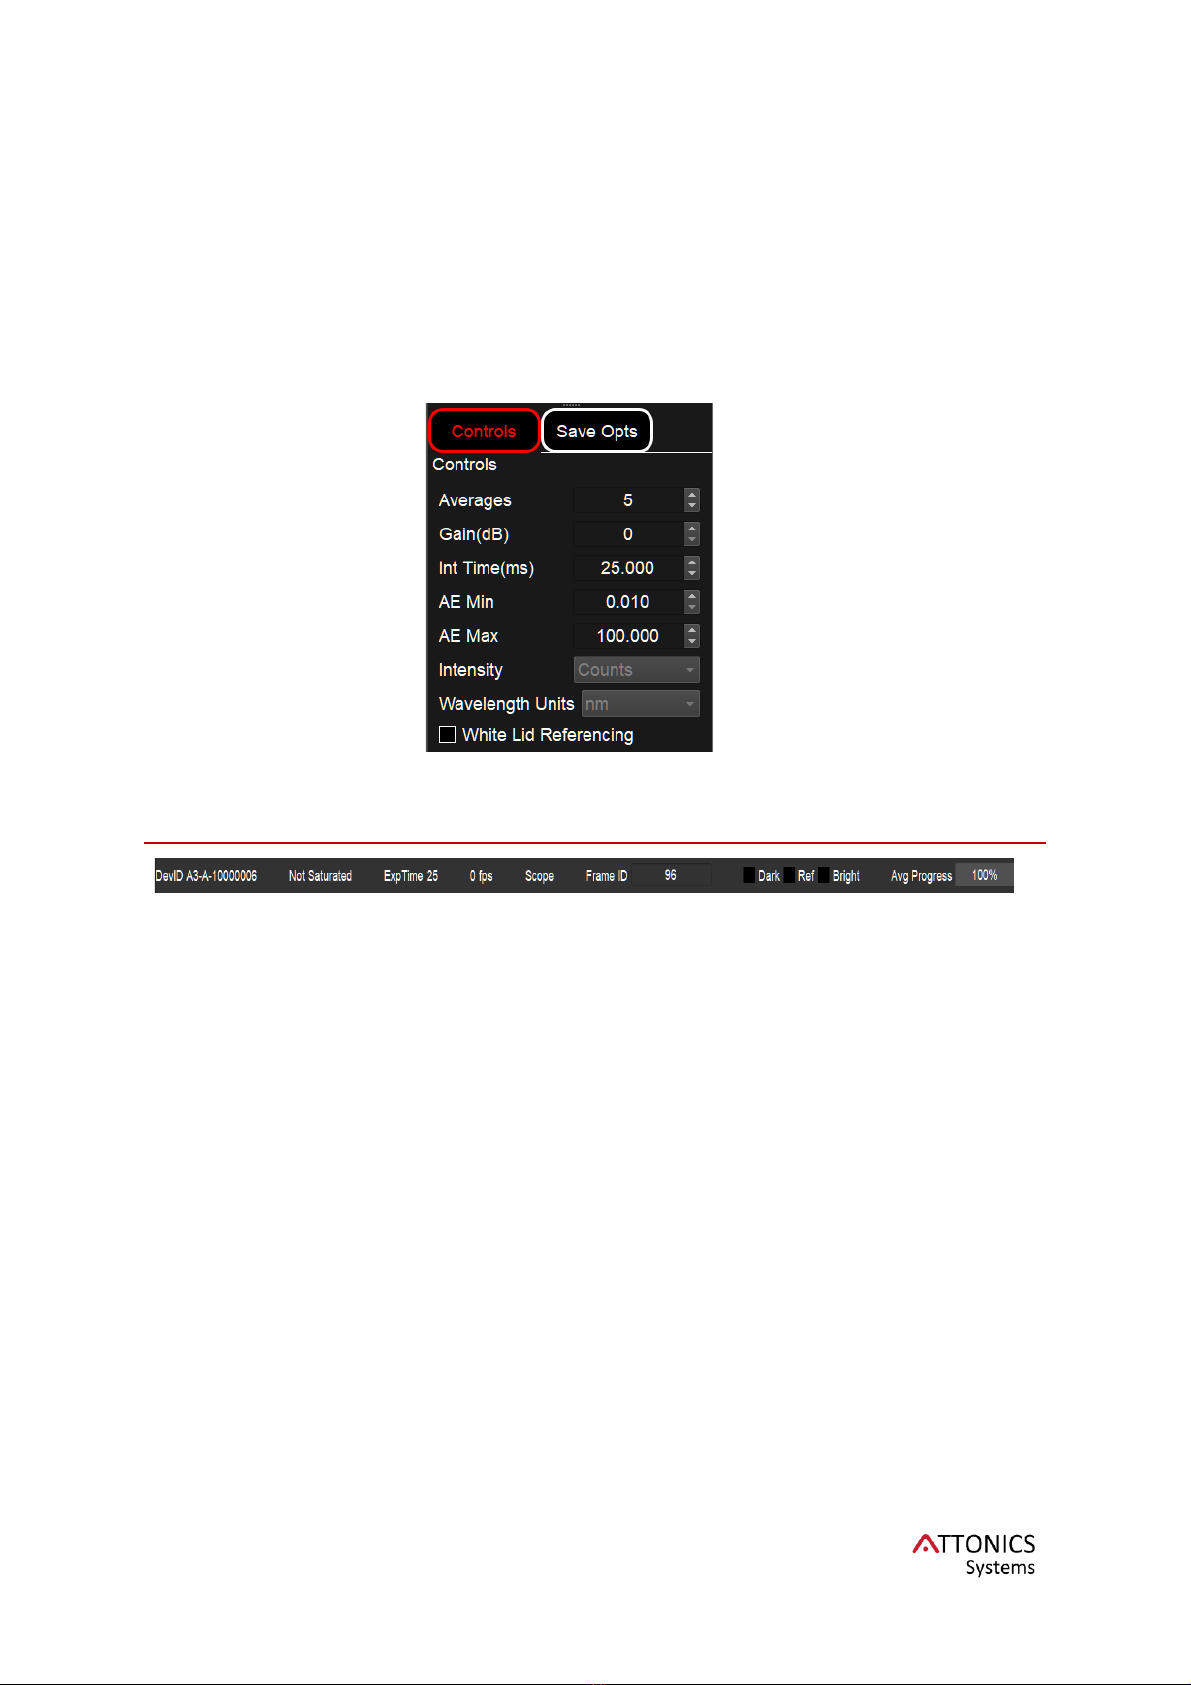
Spectrometer Controls :
Integration Time
Sets the integration time, the time over which the
detector captures incident light. At the end of the
integration time the accumulated signal is read from the
detector by the electronics. Minimum is 10 us. Maximum
is 1s.
Gain
Sets the gain on the device to capture low level light
signals. Use only in case of low light. High gain can lead
to nonlinear spectral/intensity inaccuracies. Maximum
setting allowed is 18.
Averages
Signal, especially at low levels, is significantly impacted
by noise. Averaging several spectra together reduces the
impact of noise and improves the accuracy of the result.
Maximum averages are limited to 100. Use higher
integration times to record low light spectra. Please note
that, at long integration times, averaging can increase
the total time of a measurement significantly.
ATTO3Manual 1.6
16
AE min
Sets the minimum exposure time limit for AE mode.
AEmax
Sets the maximum exposure time limit for AE mode.
Units
Intensity is set in counts. Wavelength is set in nm.
Presently, the units are fixed and in future versions, the
units can easily be changed by user.
White Lid
Referencing
Enables referencing the bright spectrum with the white lid
provided with spectrometer. Please refer to Appendix
Note AN 1 for more details.
Controls Widget
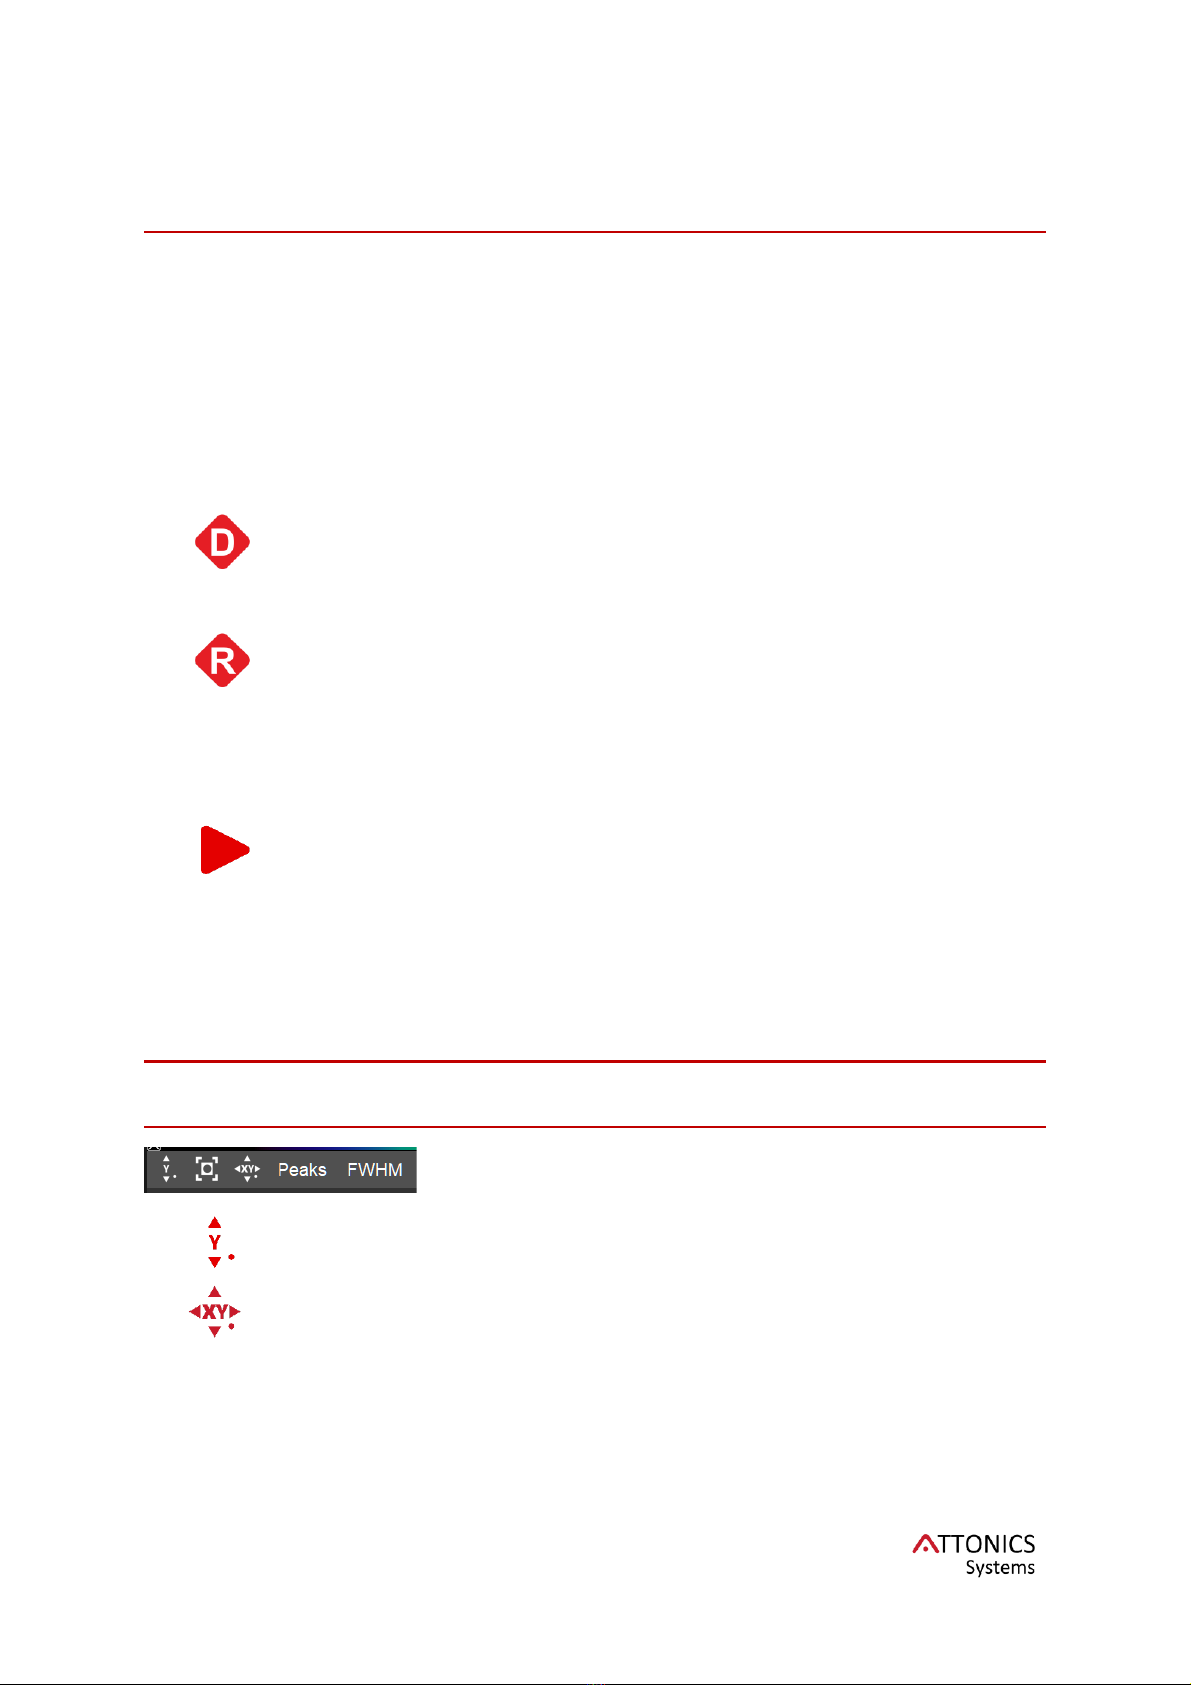
Indicator Bar
DevID
This shows the device ID of the spectrometer connected
to the computer.
Saturation Flag
Detects saturation in the detector and turns red to
indicate the user that spectrometer is saturated.
ExpTime
Displays current exposure time in milliseconds.
Frame Rate
Frame rate in spectra per second for live mode.
Mode
Shows the present mode of spectrometer with applied
spectral corrections. For example, Scope DC is
displayed when the mode is set to Scope and Dark
correction is applied.
Spectra ID
Identification number (ID) of the spectra recorded.
Resets after ever Live mode ends.
Dark Collected
Reference Collected
Bright Collected
These flags indicate whether the user has already
collected the dark, reference and bright spectra. Dark
Correction (DC), Reference Correction(RC), and
Reflectance/Transmittance(R/T) modes are not allowed
until their respective spectra are collected. These are
described in spectral processing section.

ATTO3Manual 1.6
17
Progress Bar
During averaging, the progress bar updates from 0 to
100 as it captures entire sequence.
Saving Data
Save spectrum: This icon opens a save file dialog for user to save
the current spectrum in a folder.
Quick Save saves the file instantly without opening a file dialog to a
preassigned file path in the scan opts widget.
Scan Opts widget
This widget helps in saving spectra with a defined
scan name in a preassigned folder. To use this
feature, type in the scan name for your dataset,
add a folder name using browse. Quick Save
saves the file instantly without opening a file dialog.
It uses the Scan name and adds a rolling number
to keep saving multiple files without having to
rename.
Spectral Processing
Collect Dark, Reference and Bright spectrum
Collect Dark spectrum: Any detector has a constant dark noise arising
due to various factors such as fixed pattern noise, etc. It is important to
remove the dark noise to get correct spectrum. Dark spectrum, as the name
suggests, is captured only when the light source is OFF to remove any
background from the ambient environment.
Collect Reference spectrum –Reference spectrum is useful for
subtracting out the contribution of a background arising due to fluorescence
of the substrate or due to ambient lighting.
Collect Bright spectrum –Bright spectrum is captured to make the
spectrum signal relative to it. It is a normalization of the signal against the
bright spectrum. Typically, this is taken with a reference sample and the
light source turned on.
The following applies to all the above collection modes. In Live Capture Mode, the next
spectrum is set as Dark/Reference/Bright spectrum as soon as the user clicks the respective
icon. If the spectrometer is not acquiring, a snap is initiated and spectrum is captured. For
HW triggered Snap, the user needs to press the switch to capture the spectrum.
ATTO3Manual 1.6
18
Spectral View Modes
Scope
Scope Mode(S): Shows only raw spectrum with no post processing.
Reflectance
Reflectance: Divides the processed spectrum with bright spectrum
yielding reflectance based on the measurement methodology.
Spectral Processing
Dark Correction(DC): Subtracts the dark spectrum collected before.
Here, icon denotes that it is enabled. Ensure that the correction is on
to get the right spectrum.
Reference Correction(RC): Subtracts the reference spectrum.
Here, icon denotes that it is enabled. Ensure that the correction is on
to get the right spectrum.
Auto Exposure Mode(AE): In this mode, the spectrum captured is
divided by the exposure time and exposure time is automatically
varied to get the maximum signal. This mode is very useful for
measurements which need high dynamic range, have low light
collection. For example, dark colour measurements suffer from low
light reflected back and hence suffer from higher measurement error.
AE mode takes care of low light collection by increasing the
integration time to the appropriate amount to boost the signal-to-
noise ratio.
Other Features
Plotting Features
Plot Toolbar
Autoscale Y: Set the Y scale automatically based on the live
spectrum.
Rescale XY: Rescale XY axes to maximum limits once. After that it
returns to the manual or Autoscale Y mode.

ATTO3Manual 1.6
19
Manual Scale: Set the manual scale as
per user’s requirement to specific plot
limits. Opens a dialog box as seen on the
right.
Peaks
Peaks: Peak Finding allows a user to see
the values of peaks on data. The threshold
can be set to absolute or relative. The peak
threshold and minimum distance is set
using the Peak Finding Controls within the
Controls widget in the Settings bar. Enable
peak finding by clicking Peaks on plot
toolbar.
FWHM
FWHM: FWHM or Full Width Half
Maximum is a measure of the width of the
peak and used for many spectral
measurements. For computing FWHM, set
the Peak in Peak Finding params to the
wavelength of your desired peak and then
click the FWHM button on the plot toolbar.
The FWHM is displayed as a number on
the plot toolbar.
Applications
Colorimetry: Opens a new widget showcasing the colour of any
surface based on CIE Lab colour scale and sRGB. The colour is
computed using the reflectance spectra recorded with our device. It is
recommended that a bright measurement using a white standard is
done before enabling the colour measurement. This application is only
available for devices with High CRI white LED illumination.
Time Series: This application allows the user to record time series of
spectra for monitoring a transient behaviour. It will store spectra and a
user specified metric such as area under the curve, intensity at a
particular wavelength or peak ratio at two separate wavelengths. The
data is recorded between user-defined time intervals for a fixed
duration of the recording. Minimum time interval is 1 s.
Recording: This application allows the user to record spectra for
monitoring a fast-transient behaviour at the maximum permissible
frame rate of the detector. It will store the spectra in a folder defined
by user after the recorded raw data is post-processed. The data is
recorded at time intervals specified by 1/FPS where FPS is the frame
rate of the detector.
ATTO3Manual 1.6
20
Illumination Control
Active Illumination for active spectrometers includes three different exclusively
enabled modes: Flash Off, Flash Auto, Flash On.
Flash Off: This mode renders the spectrometer to act as a passive
device. The lights provided by our spectrometer are switched OFF and
spectrometer collects the spectrum of external light sources.
Flash Auto: This mode switches flash ON only while spectrum is
captured. This is the default mode for hardware trigger mode.
Flash On: This mode is used for keeping the light on while capturing
spectra continuously.
Table of contents
Popular Laboratory Equipment manuals by other brands


MedKlinn
MedKlinn PRO AS3 operating manual

Beckman Coulter
Beckman Coulter Optima MAX-XP Instructions for use

BIO RAD
BIO RAD Experion DNA 12K analysis kits quick guide

cytiva
cytiva SE 250 Mighty Small II operating instructions

Mitutoyo
Mitutoyo StyliCleaner manual

EYELA
EYELA N-1210 Series instruction manual


