biochrom GeneQuant 1300 User manual

GeneQuantTM 1300
QUICK REFERENCE GUIDE
Biochrom US Telephone: 1-508-893-8999
84 October Hill Road Toll Free: 1-800-272-2775
Holliston, MA Fax: 1-508-429-5732
01746-1388 support@hbiosci.com
USA www.biochromspectros.com
GeneQuantTM 1300 Quick Reference Guide Page 2 Version 2.0
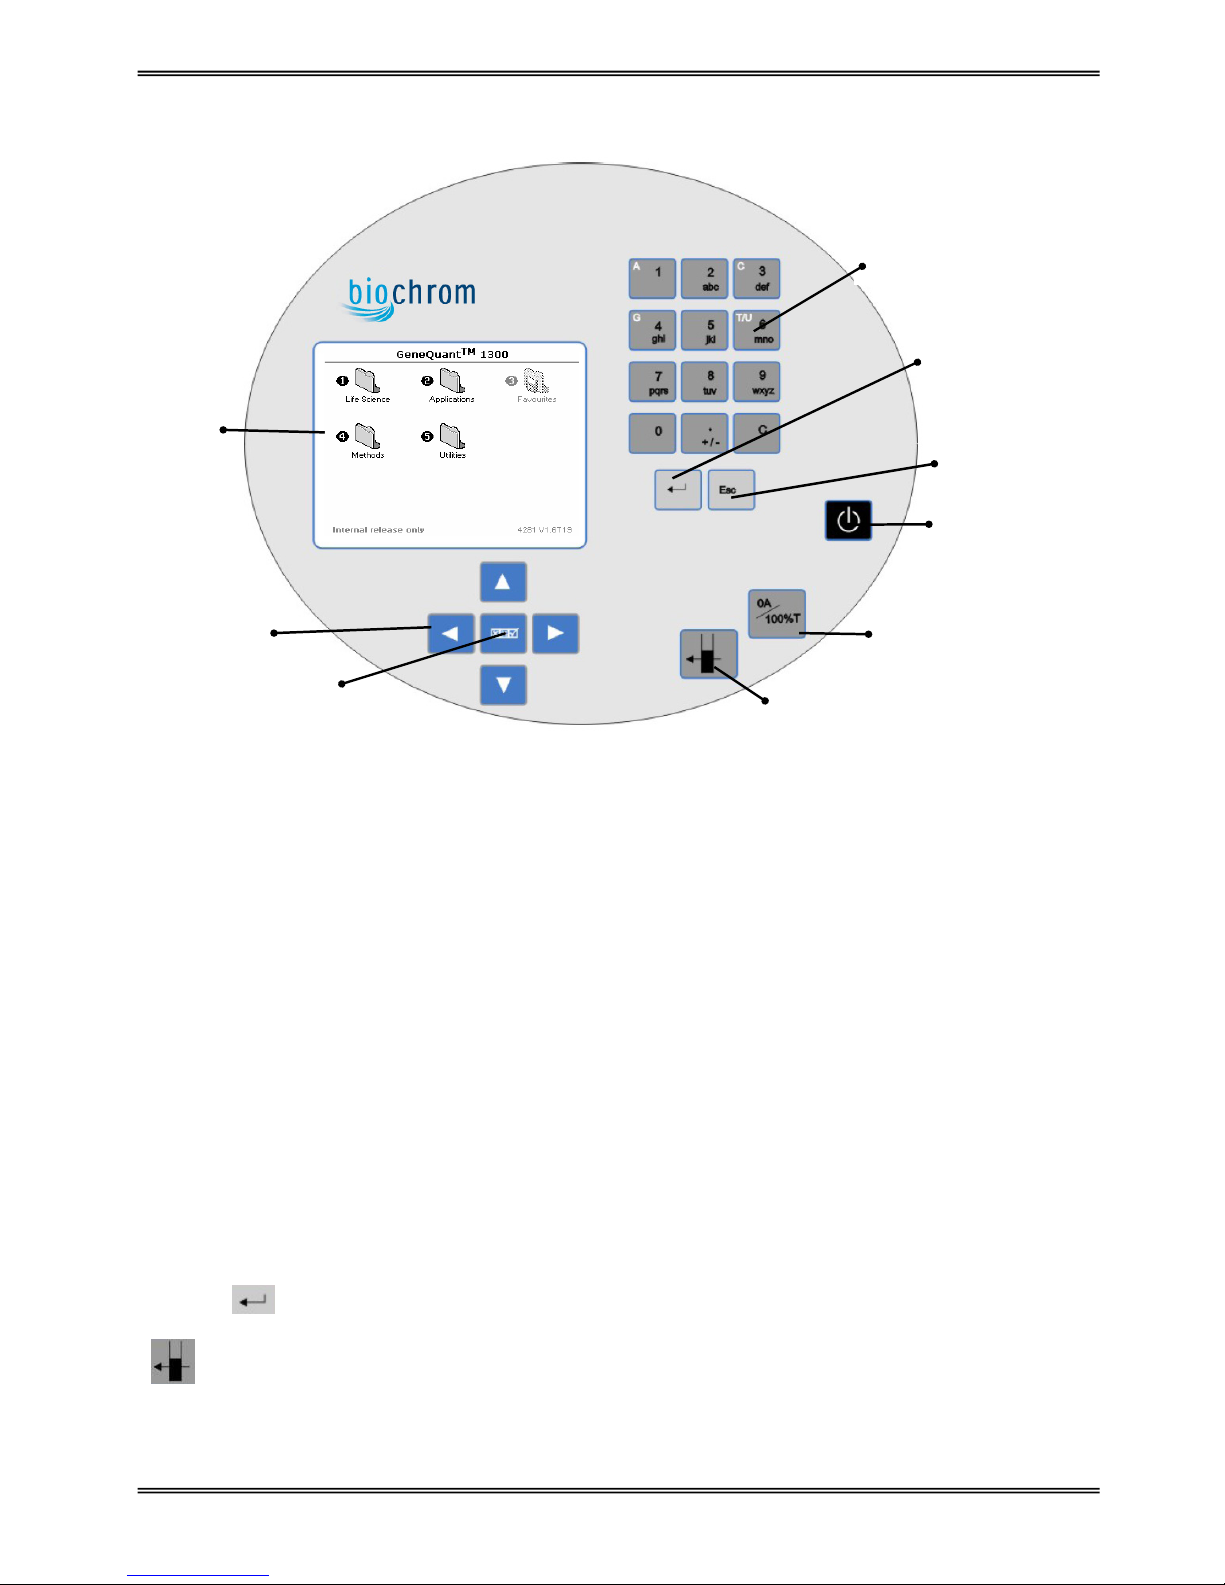
The Instrument
Key
Action
On/off key Turns the instrument on/off
Arrow keys Use the four arrow keys to navigate around the display and select the required
setting from the active (highlighted) option.
View Options: ::; View options for that application mode. Some of these are common to all
applications and described below. Options unique to an application are
described in the relevant section.
Alphanumeric keys Use these to enter parameters and to write text descriptions where
appropriate, or required. Use repeated key presses to cycle through lower
case, number and upper case. Leave for 1 second before entering next
character. Use C button to backspace and 1 to enter a space.
Escape Escape from a selection and return to the previous folder.
Set Reference: 0A/100%T Set reference to 0.000 A or 100%T on a reference solution at the current
wavelength in the mode selected. When in scan mode, do a reference scan.
OK/Next: Enter, or confirm, a selection.
Take a measurement.
Confirm selection/
Go to next screen
On/Off key
View options Take measurement
Set reference
Escape/cancel
Alphanumeric keys
Display
screen
Arrow keys
GeneQuantTM 1300 Quick Reference Guide Page 3 Version 2.0
The Display Screen
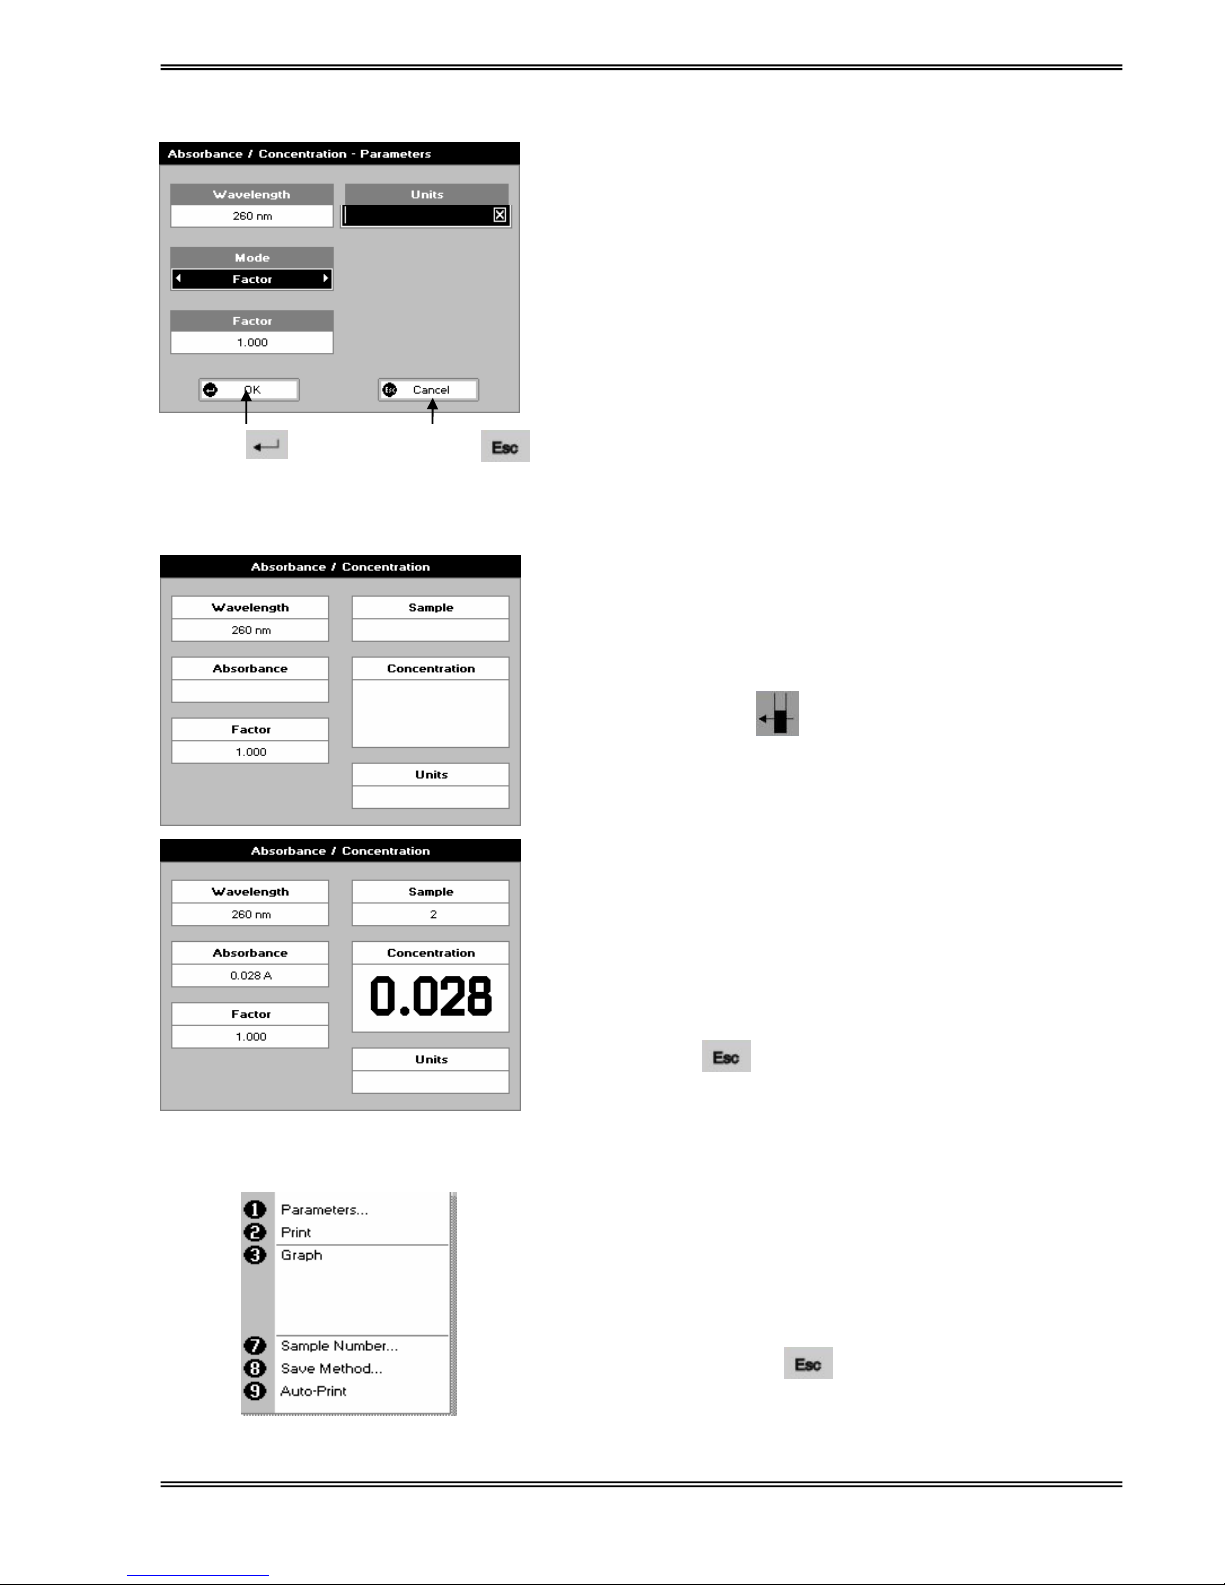
Taking Measurements
1. Insert the reference sample in chamber. Press the
blue 0A/100% key.
2. Insert the first sample and press the key with a test
tube symbol on it .
Repeat 2 for each sample.
Results
The results are displayed on screen.
Press the ::; key, or use the number keys to select
further options either relevant to the application used, to
print the results, view the parameters etc. – see below for
details.
Press Cancel: , to exit the application.
Navigation
Move between boxes using the up and down arrows.
Enter parameters by:
using the key pad numbers
OR
If the box contains the symbol :, either type in a value or press
the options key ::;, and choose a parameter from the next
screen.
OR
If the box contains arrow symbols, use the left and right arrow
keys to select the required parameter.
Press OK to
save the selected
parameters and go on
to the next screen
Press Cancel to
erase selections and
return to the previous
screen
Options (select using key pad numbers)
1. View parameters for the experiments
2. Print the results
3. Display a graph of the results
4,5,6 Specific to an application
7. Define the sample number you wish to start from
8. Save the parameters as a method in the Methods folder
with a defined method name.
9. Toggle auto-print on/off. Default is off.
Exit options by pressing , or wait.
Experienced operators can use the numeric keys as a
shortcut to the option required without needing to enter the
Options menu.

GeneQuantTM 1300 Quick Reference Guide Page 4 Version 2.0
Parameter Dictionary
Parameter Folder Sub-Folder Manual
page
Description and options
A Life Science Nucleic Acids - Oligo 17 Enter the proportion of Adenine bases.
Default is 10, range: 0 – 9999. Only an
option when units are pmol/µl
A260 Life Science Protein – Protein UV 28 Enter coefficient 2 (for absorbance at 260
nm). Default is 0.76 as in Christian and
Warburg equation: protein (mg/ml) =
1.55*Abs 280 – 0.76*Abs 260
A280 Life Science Protein – Protein UV 28 Enter coefficient 1 (for absorbance at 280
nm). Default is 1.55 as in Christian and
Warburg equation: protein (mg/ml) =
1.55*Abs 280 – 0.76*Abs 260
Autodetect
peaks
Applications Wavescan 48 Yes/No – turns on and off the automatic
peak detection
Auto-Print Utilities Printer 62 Select whether auto-print is on or off. When
on, results are automatically printed after a
measurement is taken. When off, printing
has to be initiated manually
Auto Standby Utilities Preferences 63 Select whether to use a standby mode after
defined periods. Options: 1 hour, 2 hours, at
night or off
Background Applications Absorbance Ratio –
Wavelengths
58 Select whether a background correction is
applied to both wavlengths
Background Life Science Nucleic acids – DNA
Nucleic acids – RNA
Nucleic acids – Oligo
Cy Dye
Protein – Protein UV
13
15
17
23
28
Select whether the background correction
at 310 nm is used or not. Options: On or Off
Base sequence Life Science Tm Calculation 21 Enter the base sequence triplets using the
annotated number keys. 1=A, 3=C, 4=G,
6=T/U
Base Type Life Science Tm Calculation 21 Select the base type: DNA or RNA
Brightness Utilities Contrast 63 Adjust the brightness using the left and right
arrows
Buffer molarity Life Science Tm Calculation 21 Enter the molarity of the buffer.
C Life Science Nucleic Acids - Oligo 17 Enter the proportion of Cytosine bases.
Default is 10, range: 0 – 9999. Only an
option when units are pmol/µl
Calibration App lications
Life Science
Standard curve
Protein – BCA
Protein – Bradford
Protein – Lowry
Protein – Biuret
53
30
33
36
39
Select the calibration mode. Standard,
measure prepared standard or Manual,
enter values using key pad numbers
Coefficient Life science Cy Dye 23 Use to enter the exitinction coefficent of the
dye
Contrast Utilities Contrast 63 Adjust the contrast using the left and right
arrows
Correction Life Science OD600 25 Enter the correction factor to compensate
for different optical configurations between
this and other instruments. Default value is
2
Counter ion Life Science Tm Calculation 21 Select the counter ion: Na, K, TEA or Other

GeneQuantTM 1300 Quick Reference Guide Page 5 Version 2.0
Parameter Folder Sub-Folder Manual
page
Description and options
Curve Fit Applications
Life Science
Standard curve
Protein – BCA
Protein – Bradford
Protein – Lowry
Protein – Biuret
53
30
33
36
39
Select the type of curve fit to be used.
Options: straight line regression (forces the
line through the origin), zero regression,
interpolated or cubic spline
Day Utilities Date and Ti 62 Enter the day of the month
Delay time Applications Kinetics – Parameters 1 50 Enter the delay time in seconds before
measurements are taken. Maximum 600
seconds (10 minutes)
Diluent Applications
Life science
Absorbance Ratio –
Parameters
Nucleic Acids – DNA
Nucleic Acids – RNA
Nucleic acids – Oligo
Cy Dye
Protein – Protein UV
58
13
15
17
23
28
Enter the volume of the diluent. Range:
0.01 – 9999
Dilution Factor Applications
Life science
Absorbance Ratio –
Parameters
Nucleic Acids - DNA
Nucleic Acids – RNA
Nucleic acids – Oligo
Cy Dye
Protein – Protein UV
58
13
15
17
23
28
Enter the dilution factor using the keypad
numbers or press ::; to calculate the
dilution factor
DP Applications
Life Science
Concentration
Kinetics – parameters 2
Standard Curve
Protein – BCA
Protein – Bradford
Protein – Lowry
Protein – Biuret
45
50
53
30
33
36
39
Determines the number of decimal places in
the results (0-2). Results have a maximum
of 5 figures
Draw peaks Applications Wavescan, options 4 –
peak detection
48 Yes/No – switches display of peak cursors
on and off
Duration Applications Kinetics – Parameters 1 50 Enter the time in minutes over which
measurements are taken. Maximum 60
minutes
Dye name Life science Cy Dye 23 Enter the name of the dye
End wavelength Applications Wavescan 47 Enter the end wavelength for the spectral
scan. Range: 200 – 950 nm
Factor Applications Concentration 45 Set the factor by which the result is
multiplied to give the result within a chosen
range. Only available if the mode selected
is Factor
Factor Applications Absorbance Ratio –
Parameters
Kinetics – Parameters 2
58
50
Set the factor by which the result is
multiplied to give the result within a chosen
range. Range 0.01 – 9999
Factor Life science Cy Dye 23 Enter the A260 conversion factor for the the
form of DNA or RNA being used
Factor Life Science Nucleic acids – DNA
13
Enter the factor. Default is 50, range: 0.01-
9999
Factor Life Science Nucleic acids – Oligo 17 Enter the factor. Default is 33, range: 0.01-
9999
Factor Life Science Nucleic acids – RNA 15 Enter the factor. Default is 40, range: 0.01-
9999
me

GeneQuantTM 1300 Quick Reference Guide Page 6 Version 2.0
Parameter Folder Sub-Folder Manual
page
Description and options
Factor Life Science OD600 25 Enter the factor. Range 0 – 9999. Only
available if units are cells/ml
Folder Ulitilites Folder Names 63 Select a folder to rename. Options:
Methods 1-9 or Favourites
G Life Science Nucleic Acids - Oligo 17 Enter the proportion of Guanine bases.
Default is 10, range: 0 – 9999. Only an
option when units are pmol/µl
Game Utilities Sudoku - Setup 64 Select the game number. Range 1-50. Only
available if ‘Computer’ (the 50 preset
games) is selected as the game mode
Games Utilities Preferences 63 Select whether the games function is on or
off. Options: yes or no
History Utilities Preferences 63 Select whether to use previously entered
parameters when the instrument is switched
on or to use default values. Options: On or
Off
Hour Utilit Date and Time 62 Enter the hour. Range 1-24
Interval Applications Kinetics – Parameters 1 50 Enter the interval time in seconds between
measurements: 5, 10, 20, 29 or 60 seconds
Language Utilities Regional 62 Select the language used on the display
screen. Options: English , French, Italian,
Japanese or Spanish
Minimum peak
height
Applications Wavescan, options 4 –
peak detection
48 This selects the minimum height above the
highest of the two adjacent minima, that a
peak must be if it is to be detected
Minimum peak
width
Applications Wavescan, options 4 –
peak detection
48 This selects the minimum width, in nm, a
peak must be to be detected (width =
difference in wavelength between the
higher of the two adjacent minima and the
opposing intersection of that higher
minimum level and the peak profile). Range
1-190 nm, default 5 nm
Minutes Utilities Date and Time 62 Enter the minute. Seconds are zeroed when
OK is pressed
Mode Applications Concentration 45 Select ‘Factor’ if the factor is known or
‘Standard’ if it will be calculated from a
standard of known concentration
Mode Applications Kinetics – Parameters 2 50 Select the measurement mode: Delta A –
change in absorbance over the
measurement duration; Final A –
absorbance at the end of the measuremnt
duration; slope – rate of change of
absorbance over the measurement duration
Mode Applications Single Wavelength
Wavescan
43
47
Select the mode of measurement –
Absorbance or % Transmission
Mode Utilities Sudoku - Setup 64 Select the mode – Computer, for 50 preset
games, or User to enter your own pattern
Month Utilit Date and 62 Select the month
Multiplier Life Science OD600 25 Select the multiplier: 1000 or 1,000,000.
Only available if units are cells/ml
New Name Utilities Folder Names 63 Enter a new name for the folder
Number Format Utilities Regional 62 Set the decimal point style: 999,9 or 999.9
Other MW Life Science Tm Calculation 21 Only available if counter ion is ‘Other’
Time
ies

GeneQuantTM 1300 Quick Reference Guide Page 7 Version 2.0
Parameter Folder Sub-Folder Manual
page
Description and options
Pathlength Applications
Life science
Absorbance Ratio -
Parameters
Nucleic Acids – DNA
Nucleic Acids – RNA
Nucleic acids – Oligo
Tm Calculation
Cy Dye
Protein – Protein UV
58
13
15
17
21
23
28
Select the relevant path length – 5 or 10
mm
Peak detect on
zoom
Applications Wavescan, options 4 –
peak detection
48 Yes/No – determines whether peaks are
reassessed and tabulated when the user
zooms into a region of the wavescan or
whether these stay as determined on the
un-zoomed display
Phosphorylated Life Science Tm Calculation 21 Select whether or not the sample is
phosphorylated: yes or no
Prime
concentration
Life Science Tm Calculation 21 Enter the concentration of the primer.
Printer Utilities Printer 62 Select the printer to send the results to.
Options: Built in (internal printer), or to a
computer via either USB port or Bluetooth
Replicates Applications
Life Science
Standard curve
Protein – BCA
Protein – Bradford
Protein – Lowry
Protein – Biuret
53
30
33
36
39
Select the number of standards to be
measured and averaged at each standard
concentration point. Options: OFF (=1), 2 or
3. This parameter is only available if the
calibration mode is set to Standards
Sort peaks by Applications Wavescan, options 4 –
peak detection
48 Select how peaks are sorted – by
wavelength, peak height or peak width
Standards Applications
Life Science
Standard curve
Protein – BCA
Protein – Bradford
Protein – Lowry
Protein – Biuret
53
30
33
36
39
Enter the number of standard concentration
points to be used in the curve. Range 1-9.
Start RNA Life science Cy Dye 23 The amount of RNA in ng that is being used
Start
wavelength
Applications Wavescan 47 Enter the start wavelength for the spectral
scan – range 200 – 950 nm
Std. n (n=a
number)
Applications
Life Science
Standard curve
Protein – BCA
Protein – Bradford
Protein – Lowry
Protein – Biuret
54
30
33
36
39
Enter the concentration value for each
standard. These parameters are only
available if the calibration mode is set to
Manual
T Life Science Nucleic Acids - Oligo 17 Enter the proportion of Thymine bases.
Default is 10, range: 0 – 9999. Only an
option when units are pmol/µl
Theme Utilities Preferences 63 Define the screen layout of folders. Options
are a grid format (the default) or a list
Units Applications
Life Science
Absorbance Ratio –
Parameters
Nucleic acids – DNA
Nucleic acids – RNA
Nucleic acids – Oligo
Protein – Protein UV
58
13
15
17
28
Select the units to measure the absorbance
ration in. Options: µg/ml, ng/µl or µg/µl

GeneQuantTM 1300 Quick Reference Guide Page 8 Version 2.0
Parameter Folder Sub-Folder Manual
page
Description and options
Units Applications
Life Science
Concentration
Kinetics – Parameters 2
Standard Curve
Protein – BCA
Protein – Bradford
Protein – Lowry
Protein – Biuret
45
50
53
30
33
36
39
Enter the units using the alphanumeric keys
or press ::; and select pre-defined units
using the left and right arrows (options:
(µg/ml, µg/µl, pmol/µl, mg/dl, mmol/l, µmol/l,
g/l, mg/l, µg/l, U/l, %, ppm, ppb, conc or
none)
Units Life Science OD600 25 Select the units of measurement: OD or
cells/ml
Volume Applications
Life science
Absorbance Ration –
Parameters
DNA
RNA
Oligo
Cy Dye
Protein – Protein UV
58
13
15
17
23
28
Enter the volume of the sample. Range:
0.01 to 9999
Volume Life science Cy Dye 23 Enter the volume of the probe being used in
µl
Wavelength Applications Concentration 45 Enter the wavelength at which you want to
do the colorimetric assay
Wavelength Applications Kinetics – Parameters 1 50 Enter the wavelength at which you want to
measure absorbance over a period of time
Wavelength Applications Single wavelength 43 Enter the wavelength at which you want to
measure absorbance or % transmission
Wavelength Applications Standard curve 53 Select the wavelength at which you want to
construct the calibration curve
Wavelength Life science Cy Dye 23 Enter the wavelength of the dye absorbtion
peak
Wavelength Life Science OD600 25 Select the wavelength. Default value is 600
nm
Wavelength Life Science Protein – BCA 30 Set at 562 nm
Wavelength Life Science Protein – Biuret 39 Set at 546 nm
Wavelength Life Science Protein – Bradford 33 Set at 595 nm
Wavelength Life Science Protein – Lowry 36 Set at 750 nm
Wavelength 1 Applications Absorbance Ratio –
Wavelengths
58 Enter the first wavelength which you want to
use to measure the absorbance ratio
Wavelength 2 Applications Absorbance Ratio –
Wavelengths
58 Enter the second wavelength which you
want to use to measure the absorbance
ratio
Wavelength 3 Applications Absorbance Ratio –
Wavelengths
58 Enter the wavelength from which the
background correction will be obtained. This
parameter is only available if the
background parameter has been set to On
Wavelengths Applications Multi Wavelength 57 Select the number of wavelengths at which
you want to measure absorbance. Range 2-
5
X axis limits Applications Wavescan, options 6 -
Graph Scale
49 Set to On to define the start and finish
points of the x axis, or off to retain default
values
X1 Applications Wavescan, options 6 -
Graph Scale
49 Enter the minimum value for the x axis
X2 Applications Wavescan, options 6 -
Graph Scale
49 Enter the maximum value for the x axis

GeneQuantTM 1300 Quick Reference Guide Page 9 Version 2.0
Parameter Folder Sub-Folder Manual
page
Description and options
Y axis limits Applications Wavescan, options 6 -
Graph Scale
49 Set to On to define the start and finish
points of the y axis, or off to retain default
values
Y1 Applications Wavescan, options 6 -
Graph Scale
49 Enter the minimum value for the y axis
Y2 Applications Wavescan, options 6 -
Graph Scale
49 Enter the maximum value for the y axis
Year Utiliti Date and T 62 Enter the year
Zoom mode Applications Wavescan, options 6 -
Graph Scale
49 Allows you to choose to set the scale of the
x and y axis on the wavescan graph.
Options: x axis, y axis, x & y axes
λ n (n= a
number)
Applications Multi Wavelength 57 Enter each of the wavelengths at which you
want to measure absorbance. Range 190 –
1100 nm
imees
Other biochrom Laboratory Equipment manuals

biochrom
biochrom ASYS EXPERT PLUS User manual

biochrom
biochrom EZ Read 400 User manual

biochrom
biochrom Anthos 2010 User manual

biochrom
biochrom EZ Read 400 User manual

biochrom
biochrom EZ Read 400 User manual

biochrom
biochrom ANTHOS MULTIREAD 400 User manual

biochrom
biochrom Anthos Fluido 2 User manual

biochrom
biochrom Libra S32 PC User manual
Popular Laboratory Equipment manuals by other brands


3B SCIENTIFIC PHYSICS
3B SCIENTIFIC PHYSICS 1023095 quick start guide

Flight Dental Systems
Flight Dental Systems Clave B instruction manual

Ellab
Ellab TrackSense LyoPro user manual

Scientifica
Scientifica LBM-7 manual

Thermo Scientific
Thermo Scientific Agilent 1200 Series Getting connected guide

MRC
MRC FH-12-DB user manual


