Cotek S1500-112 User manual
Other Cotek Inverter manuals

Cotek
Cotek SK120 Series User manual

Cotek
Cotek S600 Series User manual

Cotek
Cotek SE200-124 User manual

Cotek
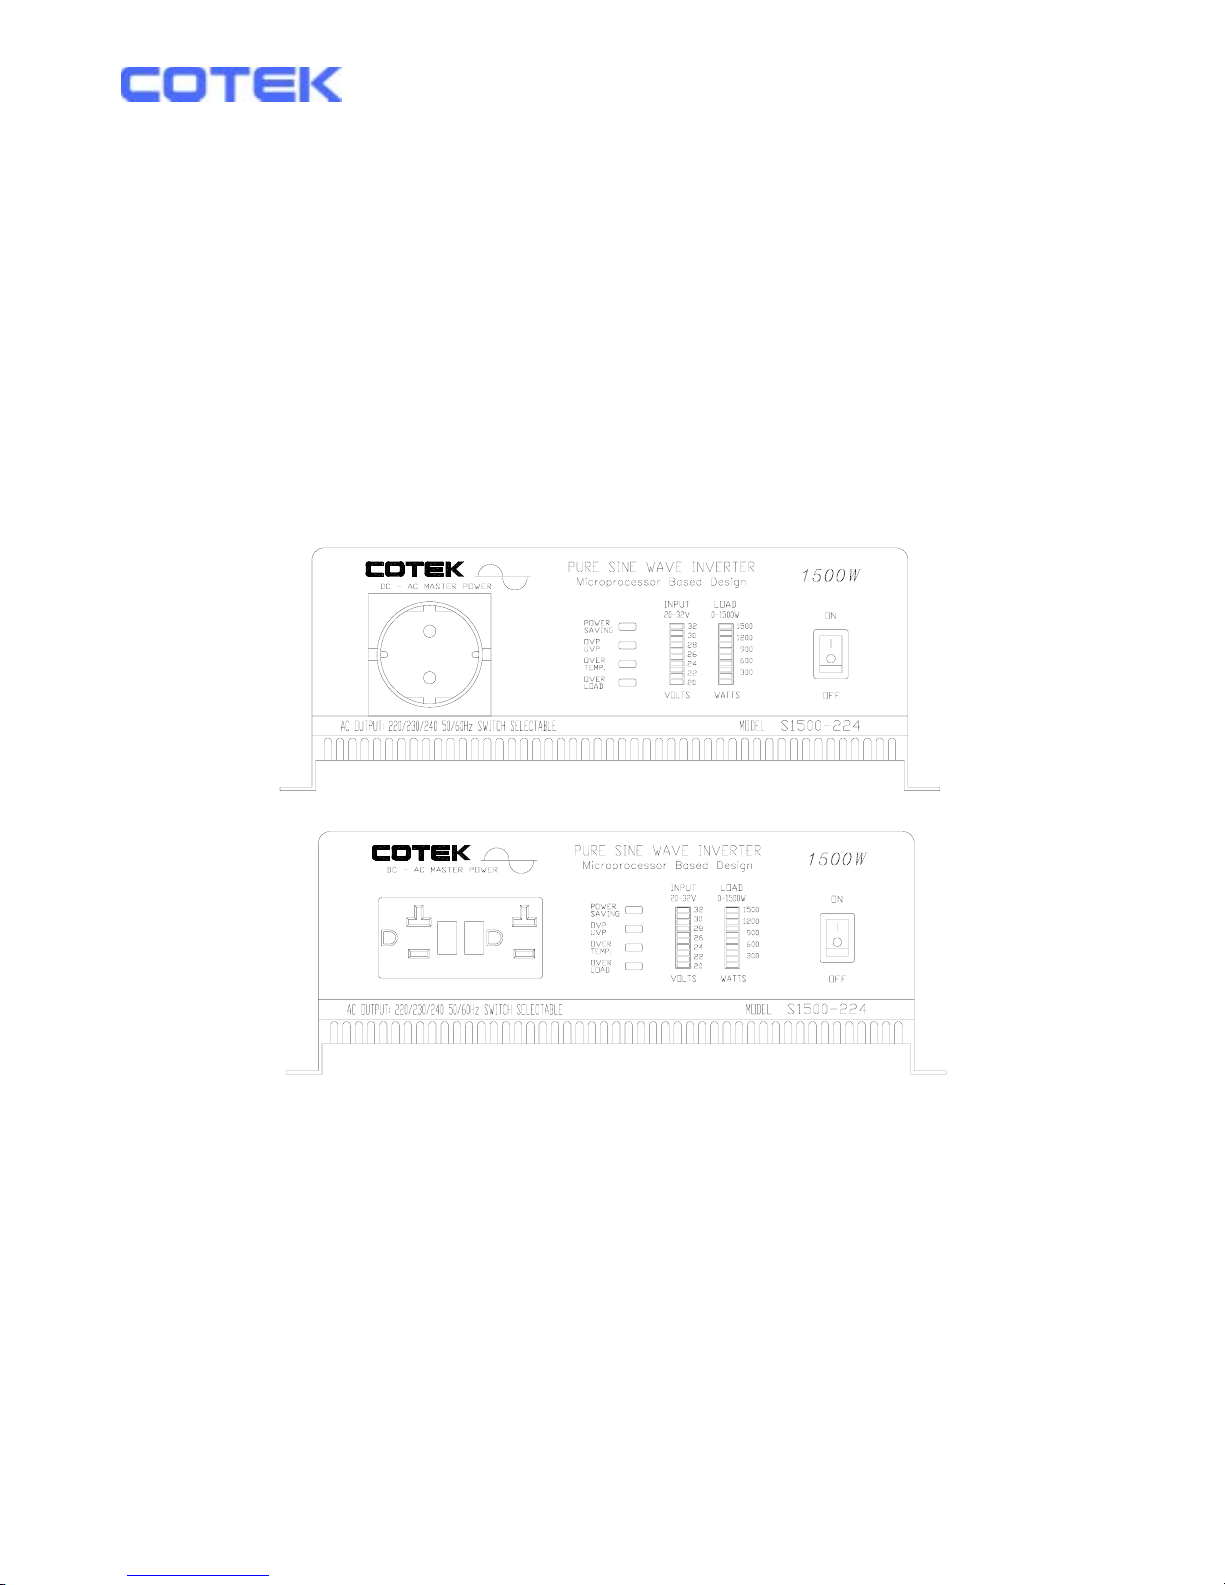
Cotek S1500-112 User manual

Cotek
Cotek SD2500 User manual

Cotek
Cotek SR-1600 Plus-124 User manual

Cotek
Cotek SR series User manual

Cotek
Cotek S600R Series User manual

Cotek
Cotek SR1000 User manual

Cotek
Cotek SK700-112 User manual

Cotek
Cotek SR-1600 Plus -148 User manual

Cotek
Cotek SP-700-148 User manual

Cotek
Cotek S600 Series User manual

Cotek
Cotek SR series User manual

Cotek
Cotek S150 Series User manual

Cotek
Cotek S Series User manual

Cotek
Cotek SD Series User manual

Cotek
Cotek SE350 series User manual

Cotek
Cotek ST Series User manual

Cotek
Cotek SD2500-112 User manual


Popular Inverter manuals by other brands


BARRON
BARRON EXITRONIX Tucson Micro Series installation instructions

Baumer
Baumer HUBNER TDP 0,2 Series Mounting and operating instructions

electroil
electroil ITTPD11W-RS-BC Operation and Maintenance Handbook

Silicon Solar
Silicon Solar TPS555-1230 instruction manual

Mission Critical
Mission Critical Xantrex Freedom SW-RVC owner's guide

HP
HP 3312A Operating and service manual