ELSEC 774 User manual

774 ENVIRONMENTAL MONITOR
USER MANUAL
774.doc V2.1


CONTENTS
INTRODUCTION...............................................................................................1
BASIC OPERATION .........................................................................................2
Set Button......................................................................................................3
UNITS OF MEASUREMENT.............................................................................4
Ultra-Violet (UV)............................................................................................4
Visible Light...................................................................................................5
Temperature..................................................................................................6
Thermal Radiation (Infrared).........................................................................6
MAXIMUM AND MINIMUM...............................................................................7
DISPLAY...........................................................................................................8
Contrast.........................................................................................................8
Backlight........................................................................................................8
DATA LOGGING...............................................................................................9
Wrap Data.....................................................................................................9
ShowStatus..................................................................................................9
Start Logging.................................................................................................9
Stop Logging...............................................................................................10
Re-Starting logging......................................................................................10
Logger-PC Communications.......................................................................10
Installing the Software.................................................................................13
Viewingthe Results using RView................................................................14
CLOCK............................................................................................................15
Setting the Time..........................................................................................15
Setting the Date...........................................................................................15
Date Format ................................................................................................15
Hiding the Clock..........................................................................................15
MAINTENANCE..............................................................................................16
Battery.........................................................................................................16
Mains Power Supply....................................................................................16
Software Version.........................................................................................16
CALIBRATION ................................................................................................17
Temperature................................................................................................17
UV & Visible Light........................................................................................18
SERVICE ANDSUPPORT..............................................................................19
SPECIFICATIONS ..........................................................................................20
PRINTED 25-Mar-05

1
INTRODUCTION
Using the 774 measurements can be taken ofthe proportion ofUV present as
microwatts per lumen (mW/lumen), the total amount ofUV as milliwatts per square
meter (mW/M2) and the amount ofvisible light present (Lux).
Most objects are also sensitive to temperature. The 774 also measures temperature as
°C or °F and thermal radiation in W/M² or BTU/Hour/FT2
The 774 can be leftfor extended periods to log the above parameters at auser set
interval (10 seconds to 1hour). The saved data can then be transferred to acomputer
for display, graphing etc.
Wealwayswant to improve our products. Ifyou have anysuggestions please send
themto the manufacturer.

2
BASIC OPERATION
To take areading the appropriate yellow button is pushed depending on the
measurement required and the reading is taken.
UV= Ultra Violet (µW/lumen or mW/M2)
Vis= Visible light (Lux or Foot-candles)
T= Temperature (Centigrade or Fahrenheit)
IR= Thermal radiation (Infra Red)
The unit automaticallyturns off 10 seconds after the button is released unless abutton
is held down for over 5seconds, this will cause readings to be taken continuouslyuntil
a button is pressed.
Ifthe Tand UV buttons are pressed together then all parameters are displayed at the
same time. Hold both the buttons down for over 5 seconds for a continuous readout.
Note that the buttons should be pressed firmlyfor asecond or so to ensure reliable
operation.
Typical display:
A
B
C
D
E
Lux
1234
Min: 1.2 21-08:14
Max: 3456 14-09:34
B H L 3/11/99 10:20
A: Units ofmeasurement
B: Current reading
C: Minimumreading since last reset, dayofmonth and time ofminimum
D: Maximumreading since last reset, dayofmonth and time ofmaximum
E: Hshows that the reading is “held” and the unit will turn itselfoff after 10 seconds
ofinactivity. A round blob shows the unit is in continuous reading mode until a
button is pushed, nothing here means that a single reading is being taken.
The Lindicates logging is in operation, Wis shown iflogged data is wrapped.
The current time and date are also shown. Unless theyare hidden bypressing
Set\Clock\Hide-Unhide.
Ifa batterysymbol appears at B it means that the batteries need to be replaced.
Min & Max are reset bypressing Set\Max-Min\Reset (Press Set 3 times)

3
The above format is slightlydifferent for someparameters and can be altered bythe
user ifrequired, see below.
Set Button
The blue Set button is used to access advanced functions, change units etc. Ifit is
pushed once a menu similar to that below is shown:
Max-Min>
Display>
Units>
Clock>
Calibrate>
The first menu item“Max-Min” is highlighted, different menu itemscan be
highlighted using the éand êbuttons. The wanted action is done byhighlighting the
appropriate menu itemand pressing the Set button. To abort without doing anything
press the Xbutton. In some cases a further sub-menu is displayed with more choices.
Elsewhere in this manual directions in the formSet\item1\item2are given. This means
Press Set, select item1in the first menu, press Set again, select item2in the next menu
and press Set.
To take ameasurement without having to look at the displaywhile the reading is
taken (for example where the operators head mayeffect the reading) proceed as
follows:
1. Position the monitor where the reading is to be taken.
2. Push the appropriate button for 1-2 seconds and release.
3. Hold the monitor in position for at least 2 seconds.
4. Without operating anybuttons bymistake move the monitor so the reading
can be noted before it turns itselfoff.

4
UNITS OF MEASUREMENT
Ultra-Violet (UV)
TraditionallyUV has been measured in museumsas the proportion ofultraviolet
present. This result is useful for checking aparticular lampor window because the
proportion ofUV does not change with the distance fromthe light source. Using a
simple rule the amount ofUV on an object can be limited. It is usual to arrange that
the proportion ofUV should not exceed 75µW/lumen in museumsand galleries,
though some organisations tryto keep UV levels below 25µW/lumen
The damage is done bythe total amount ofUV falling on the object so it is useful to
be able to measure this directly,especiallyifnon standard amounts ofillumination are
required. The amount ofUV should be as little as possible but in general should not
exceed 20mW/M2, again some organisations keep the level below 6mW/M2.
Both the above units are displayed when the UV button is pressed, one in large
characters, the other smaller at the bottomofthe screen. Which is displayed where can
be swapped bypressing Set\Units\µW/Lumn-mW/M².

5
VisibleLight
This can be displayed either in Lux or Foot-candles. To change the units press
Set\Units\Lux-Footcandl.
Avisible light readout is provided to control illumination and limit damage done by
visible light. Normal museumlight levels should be limited to 150-250 Lux.
Once measurements have been made the light level can be altered if necessaryand UV
filters can be fitted on windows, fluorescent tubes or other UV producing light sources
as required. These filters often deteriorate over aperiod of years so it is essential to re-
check themperiodically.
Magazine reprints on the subject ofmuseumlighting ,UV etc can be obtained from
the manufacturer.
Suggested light levels for various other purposes are given below:
Corridor, stairs etc 100/150 Lux
Warehouses, storage bays 100/150 Lux
General office work 300/500 Lux
Rough bench/machine work 300/500 Lux
Mediumbench/machine work 500/700 Lux
Drawing offices 750/1000 lux
Fine bench work 1000/1500 Lux
Fine inspection 1500/3000 Lux
Minute work 3000/5000 Lux

6
Temperature
Temperature can be measured in degrees Centigrade or Fahrenheit. To change the
units press Set\Units\°C-°F.
Thermal Radiation (Infrared)
Thermal radiation is measures using athermopile. This is sensitive to all radiation
fromthe near ultraviolet to the far infrared (to about 40µM wavelength). Bydefault
this is measured in W/M² (Watts per square Meter), readings can also be displayed in
BTU/Hour/FT² (British Thermal Units per Hour per square Foot); see the Units menu.
One ofthe features ofathermopile is that it also detects radiation that is being emitted
bythe sensor due to its temperature (an unavoidable law ofnature). This emitted
radiation depends on the temperature ofthe thermopile. The obvious wayto eliminate
this effect is to maintain the sensor at aconstant temperature; but the power required
to do this makes it impossible on abatteryoperated instrument. The 774 compensates
bymeasuring the temperature ofthe sensor and calculating a correction.

7
MAXIMUM AND MINIMUM
The maximumand minimumvalues for each unit are displayed along with the dayof
the month and time the maximumor minimumoccurred.
The values can be reset bypressing Set\Max-Min\Reset (This equates to pressing Set
3 times).
To find the date when maxima&minimaoccurred press Set\Max-Min\Date or Time,
repeat to displaythe times again.
The maximumand minimumvalues are also set when data logging is active.
8
DISPLAY
Contrast
The displaycontrast can be increased/decreased bypressing Set\Display\Contrast UP
or DOWN. Ifthis is done the menu continues to be displayed and the set button can be
pressed repeatedlyuntil the required contrast is achieved.
Backlight
The displaybacklight operation can be adjusted fromthe Set\Displaymenu as
follows:
Menu item Action
Lamp off Backlight always off
Lamp mostlyoff Backlight initiallyoff,turns on ifvisible light is less
than 10 Lux
Lamp mostlyon Backlight is initiallyon, turns off ifvisible light is more
than 10 Lux
Lamp on Backlight always on
The backlight uses aconsiderable amount ofpower, the more it is used the less time
the batteries will last.

9
DATALOGGING
Data logging is an optional extra. Astandard unit can be upgraded to include data
logging byreturning it to the manufacturer. Ifdata logging is not fitted then the
relevant menu items are not displayed.
Ifdata logging is fitted “Data logging” is one ofthe options when the Set button is
pushed.
WrapData
IfWrap is set (press Set\Data logging\Wrap) then logging continues when the logger
memoryis full overwriting the oldest data.
IfNo wrap is selected (press Set\Data logging\No wrap) logging stops when the
memoryis full.
ShowStatus
To see how much data has been saved, when logging was started etc select
Set\Data logging\Show status and the information is shown on the screen for 20
seconds. Press the X button to clear the screen sooner.
StartLogging
To start logging press Set\Data logging\Start and then select the log period and press
Set again.
Iflogging is started then anypreviouslylogged data is lost, so be sure that saved data
has been transferred before starting again.
The Log Period is how often readings are taken, ifthe log period is short then it will
be less timeuntil memoryspace runs out. The storage capacityis 10,900 readings of
all 4parameters (UV, Visible light, temperature and humidity). The other values
(e.g. dewpoint and µW/Lumen) are calculated fromthe 4 saved parameters.
Logging commences at atimeso that measurements are taken at the start ofeach
minute, 10 minutes, hour etc.
Log Period MaxLog time (Days, Hours:Mins) Logging Commences
10 seconds 1, 6:16 Start ofnext minute
1 Minute 7, 13:40 Start ofnext minute
10 Minutes 75, 16:40 (about 2 ½ months) Next whole 10 minutes
past the hour
1 Hour 454, 4:00 (about 1 year 3 months) Start ofnext hour
Logging will continue until the memoryis full or a low batterycondition is detected.
10
Stop Logging
To stop logging press Set\Data logging\Disable. This stops data being saved. The
logged data is saved until logging is started again.
Re-Starting logging
Data is saved in non-volatile memorythat retains data even ifthe batteries are
removed. BUT the memorythat retains information about when the next log timeis
and the clock itselfrequire batterypower. So ifpower is lost for anyreason logging
will not restart until both the timeand the date have been set. After this is done
logging will continue, leaving ablank in the memoryfor the data that was not
recorded.
Logger-PCCommunications
See below for information on installing the reception software on your computer..
1. Start the PC program(‘RView’) on the computer.
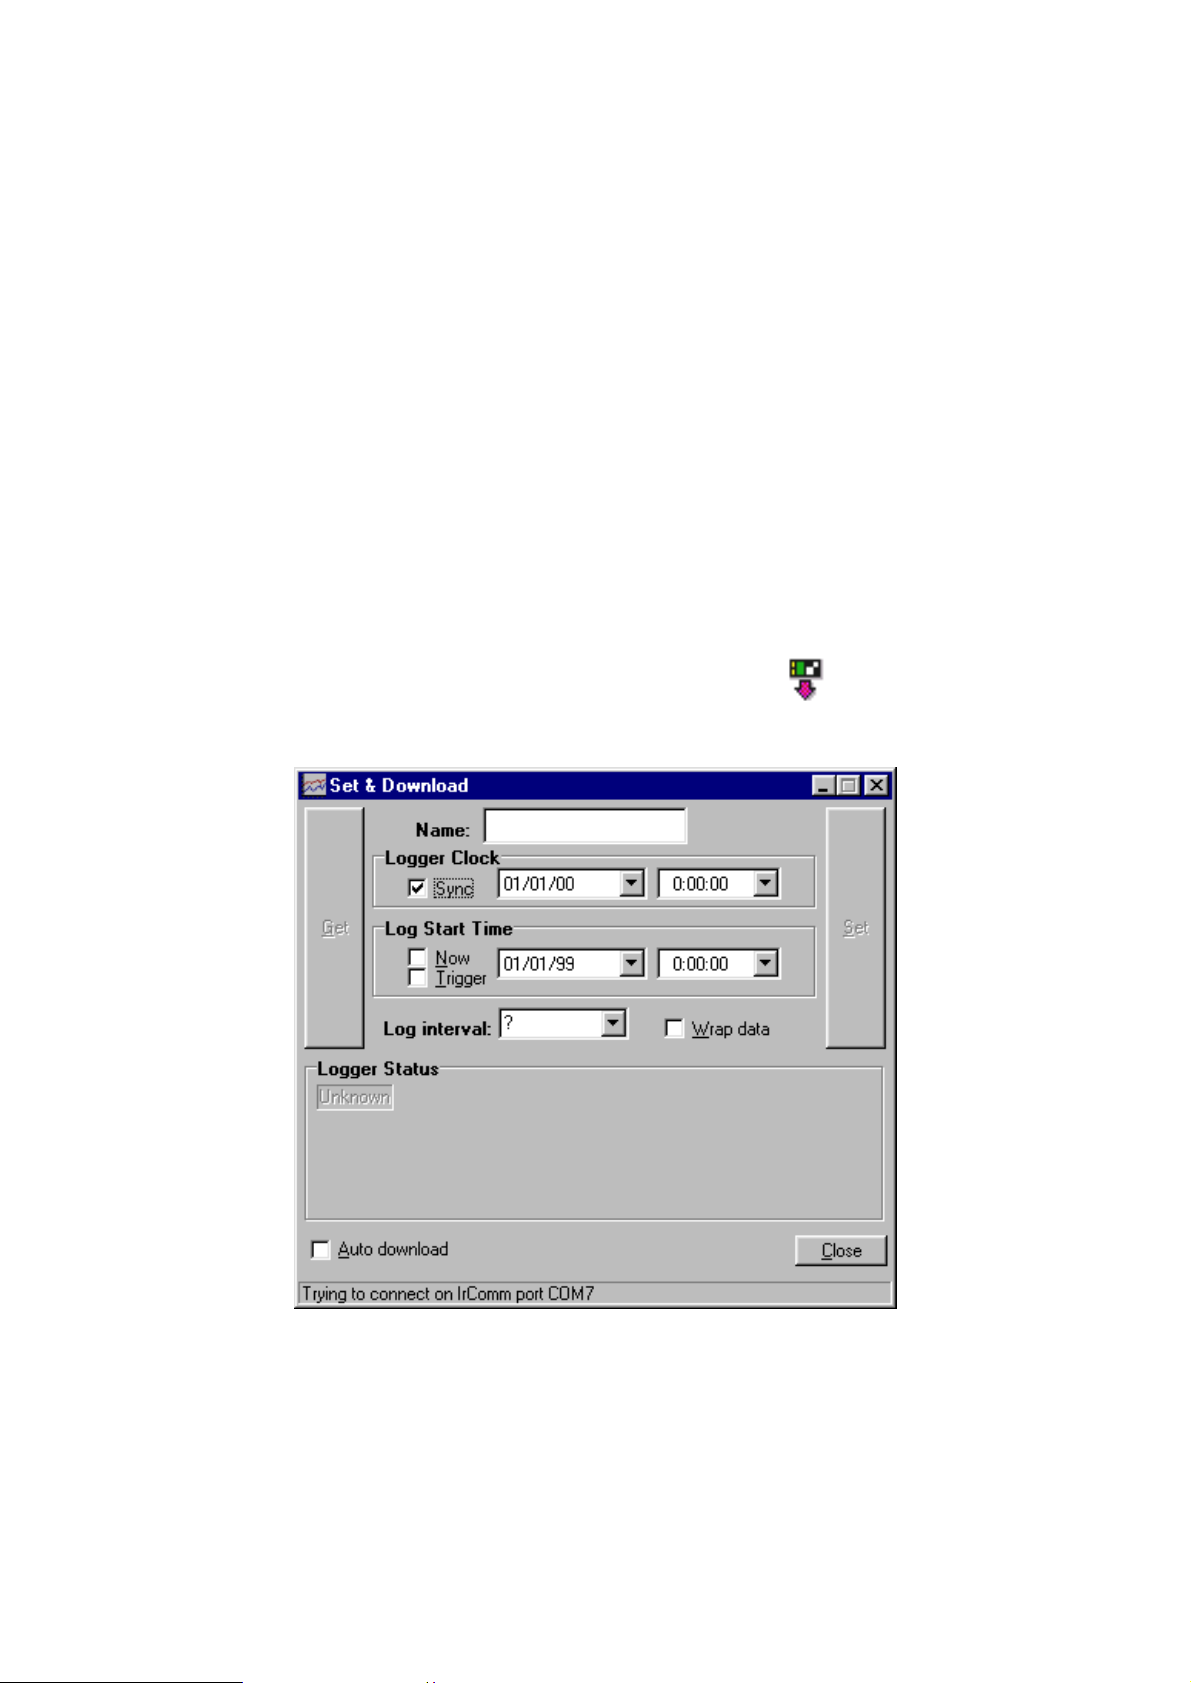
2. Open the Set &Download window bypressing the button or selecting
"Logger/Set &Download" fromthe menu. Something similar to the following is
displayed:
If"Auto Download" is checked then anynew data is downloaded as soon as
contact is made with the logger.
3. Select Set\Data logging\Transmit on the 774.
11
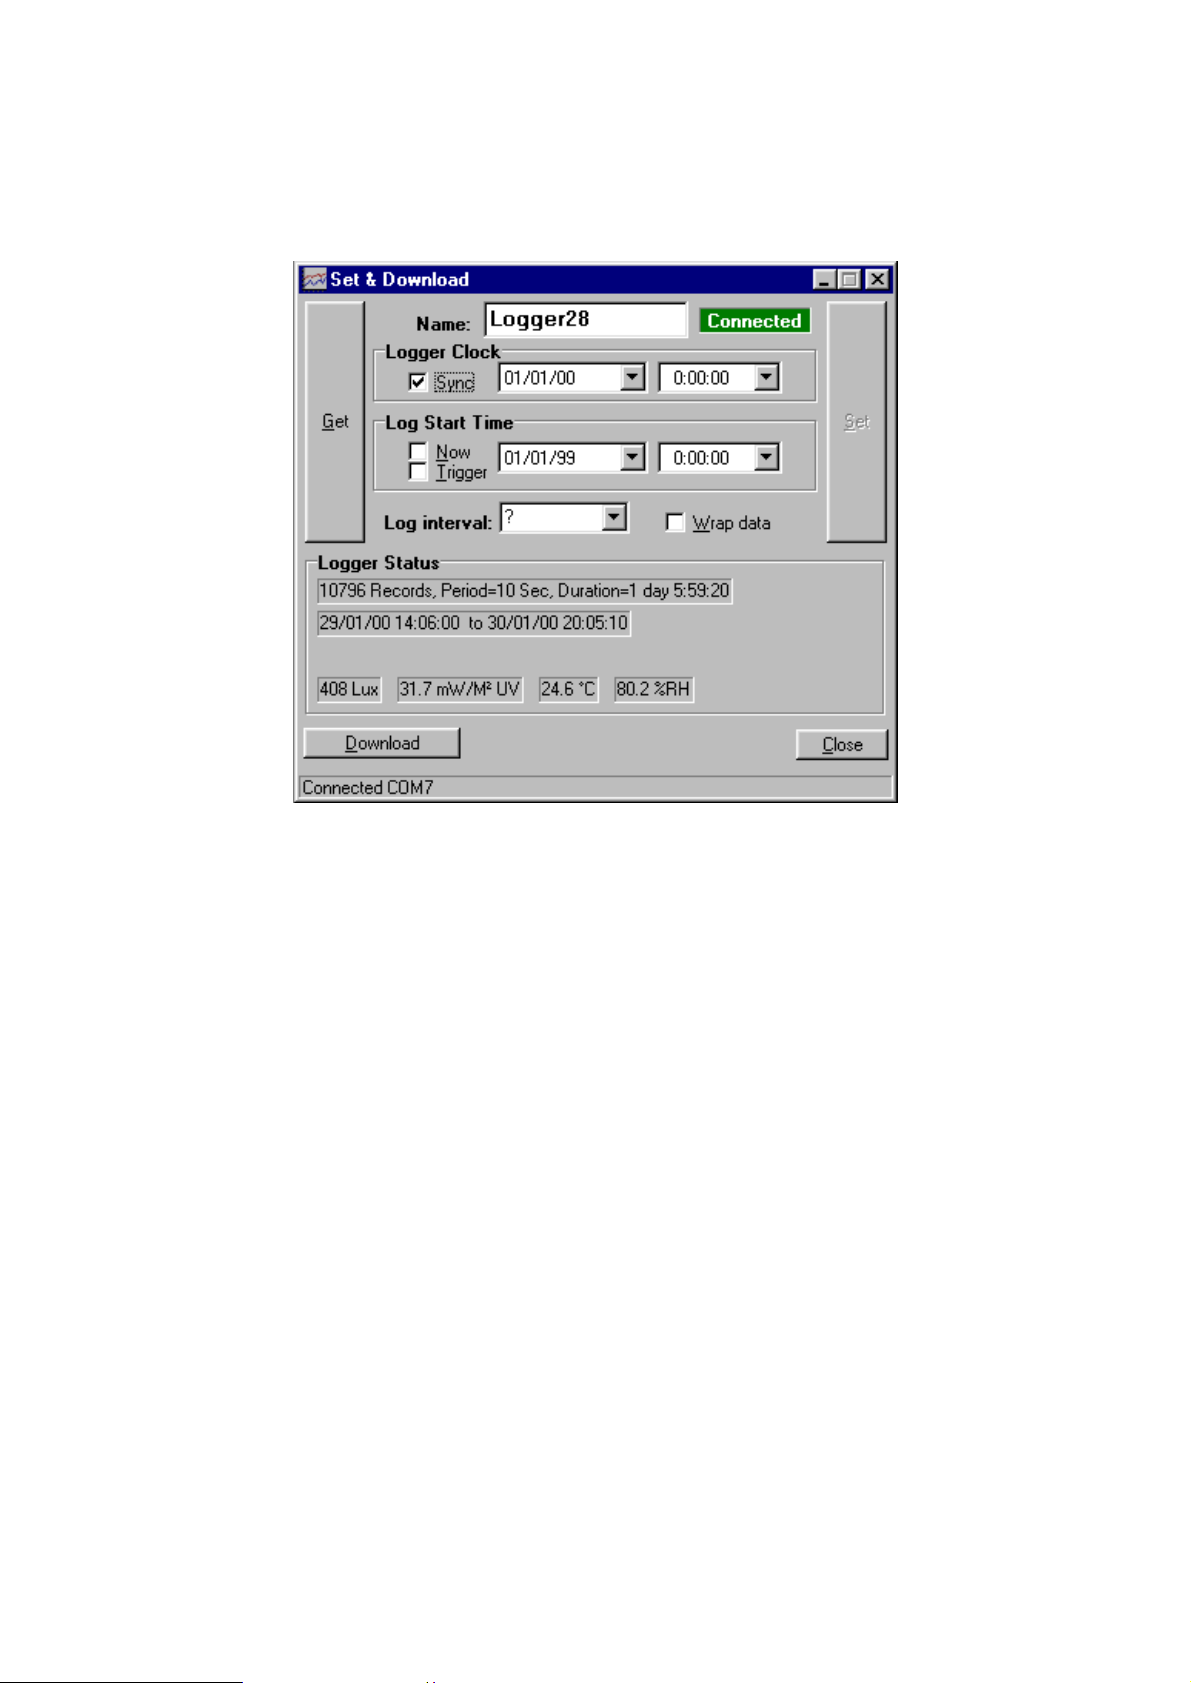
4. Within 10 seconds place the monitor with it’s black end window (the end with the
temperature sensor) facing directlyat the computer'sinfrared port, within 30-
60cm(1-2 feet). When contact is made with the logger the computer requests the
logger status and something similar to the following is shown:
If"Auto Download" was checked then anynew data is downloaded automatically.
Otherwise, ifrequired, click on the Download button to start transmission. The
infrared link is closed after all data has been sent.
Information on anylogged data and the current readings (updated every5seconds) are
shown under "Logger Status".
The Get button can be clicked to check the current logger settings (Clock, log start
time etc).
If"Wrap data" is checked logging will continue when the memoryis full overwriting
the oldest data.
IfSync is checked then the logger clock will be set fromthe PC when the Set button is
clicked. Otherwise it can be set using the 774 Clock controls.
If"Now" is checked the logger will start as soon as possible after "Set" isclicked,
otherwise anystart time and date can be set.
"Trigger" is not used bythe 774.
The logger name can be changed. This effects where the downloaded data is stored.
The Set button sends the settings on the PC (Logger Clock, start time, interval, name
etc) to the logger. This also terminates the connection. The Set button is enabled when
a valid log interval is chosen.
The infrared link can be closed bypressing the 'X'keyon the 774 or closing the "Set
&Download" window on the PC. Ifthe 774 is just taken awaywithout the link being
officiallyterminated the computer will complain that it has lost communication, this
does not matter.

12
Notes:
After the link is established (“Connected” is shown on the 774 and the PC), if
transmission is interrupted (e.g. byblocking the path between the 774 and the
computer infrared receiver) transmission will re-start fromwhere it leftoff onlyif
communication is re-established within 15 seconds. Ifcommunication is blocked for
longer than this then the link is broken and the process must be re-started fromstep 1.
Ifall the data is not transferred for anyreason the procedure can easilybe repeated,
though see the information on file names above.
Ifpower has been lost then the 774 mayforget how manyrecords it has saved and no
data will be transferred. It is possible to force the 774 to transmit data byselecting
“File\Get Data” fromRView, the user then has to specifyhow manyrecords are
required and theyare transmitted whether theyare valid or not.
Ifbatterypower gets low during transmission awarning message is displayed but
transmission continues for as long as possible but maynot complete. Ifthis happens
the batteryshould be replaced and the data retrieved using the method described in the
paragraph above.

13
Installing theSoftware
At the time ofwriting Rview have been tested with Microsoft Windows 98 and 2000.
To install the software run the installation programthat is provided on afloppydisc or
that has been downloaded fromour web site (www.elsec.co.uk) and follow the
instructions given. The installation file is called Rview21.exe or similar.

14
Viewing theResults using RView
For more detailed information on RView see the help file.
When RView is started an emptywindow is shown. One or more data files can be
opened byselecting File\Open on the menu or pressing the appropriate button on the
toolbar.
When adata file is opened the information is displayed as agraph in it’s own window.
More than one graph can be open at anytime.
The graph can then be manipulated in the following ways:
Change the graphed parameters. If‘Show’ is selected on the menu alist of
parameters that can be plotted is shown with the current selection ticked. The various
items can be ticked/unticked to change what is shown.
Make the graph bigger/smaller. Use the standard window controls on the top right
ofthe graph window and/or drag the edges ofthe graph as required.
Zoomto see part of the data in more detail. Move the mouse cursor to one corner
ofthe area ofinterest, click and hold the leftmouse button while moving the mouse
cursor so that the area ofinterest has abox drawn round it. When the mouse button is
released the graph is redrawn showing onlythe selected area.
Change the temperature units. Select ‘Show’ on the menu and the current units are
shown (°C or °F) click on this to change the units.
Move the Legend. When the graph is first drawn the legend box mayhide part ofthe
data. This can be moved byclicking on the box and dragging it to anew location. Ifit
changes to afree floating window it can be removed completelyor put back on the
graph byclicking on it again.
Check the time/value of apoint on the graph. Move the mouse cursor to the point
ofinterest, the timeand value represented bythe position is shown on astatus bar at
the bottomofthe window.
Add/Change the title of the graph. Press the Titles button on the toolbar and enter
the title as required.
Print the graph. Select File/Print on the menu.
Copythe Graph to the Clipboard. Select edit/copyon the menu or press the
appropriate button on the toolbar. The saved image can now be pasted into other
programs, documents etc.

15
CLOCK
The 774 has abuilt in clock, this is used to show the timeofmaximumand minimum
values and for data logging. The date functions are valid until January2098 so the unit
is completelyyear 2000 compliant.
Setting theTime
To set the timeproceed as follows, the procedure can be abandoned at anytimeby
pressing the X button:
1. Press Set\Clock\Set time. The displayshows the current timewith the hours
highlighted.
2. Use éand êbuttons to adjust the hours to the correct value and press the
Set button.
3. The minutes are now highlighted. Repeat 2above to set the minutes, when
the set button is pressed the seconds are set to zero.
Setting theDate
To set the date proceed as follows, the procedure can be abandoned at anytimeby
pressing the X button:
1. Press Set\Clock\Set date. The displayshows the current date as Day-Month-
Year with the dayhighlighted (note that the date is always shown in this
order regardless ofthe date format setting as described below).
2. Use éand êbuttons to adjust the dayto the correct value and press the Set
button.
3. The month is now highlighted. Repeat 2 above to set the month.
4. The year is now highlighted, repeat 2 above to set the year.
Date Format
The timeand date are shown at the bottomofthe displaywith everyreading. The date
is normallydisplayed as day-month-year, this can be changed to the American format
(month-day-year) bypressing Set\Clock\DMY or MDY. The format can be restored to
day-month-year byrepeating this.
Hiding theClock
Ifthe date and timeare not needed theycan be hidden bypressing
Set\Clock\Hide-Unhide. Repeat to unhide.
16
MAINTENANCE
The sensor windows should be kept clean and grease free. Grease and finger marks
that look clear maybe opaque to UV. Ensure that solvents do not comeinto contact
with plastic parts, especiallythe perspex window over the visible (left-hand) sensor.
Battery
The batteries should be replaced as soon as the batterysymbol is seen on the bottom
leftofthe display.Any1.1 to 2.5 volt AA style batterycan be used, though it is
preferable to use alkaline cells because oftheir longer lifeand much reduced tendency
to leak.
The batterycompartment can be accessed byremoving the single screw in the bottom
centre ofthe case.
Suggested batterytypes (2 off required):
MANUFACTURER TYPE
Duracell MN1500
Ever Ready LR6B4
Nickel Cadmiumrechargeable types can be used but theycannot be charged inside the
instrument.
MainsPower Supply
The optional external mains power supplycan be connected to the power input socket
on the right hand side ofthe instrument. This socket is onlyfitted ifrequested with
order because the hole required compromises the moisture seal on the casing.
SoftwareVersion
The internal software version is displayed when the 774 is turned on. Atypical start-
up message might be “ELSEC 774 V2.1”, in this case the software version is 2.1

17
CALIBRATION
The calibration information is kept in non-volatile EEPROM. Ifthis fails the
instrument displays“Mem Fail” when turned on and will load default calibration
values and future readings maybe 25% in error. Ifthis happens aquestion mark “?”is
displayed on the top right ofthe displaywith suspect readings.
Temperature
The 774 is fitted with asolid state temperature sensor that should not normallyrequire
calibration.
The unit can be checked byputting it together with another, known accurate,
temperature measuring device for at least an hour. Make sure that the two sensors are
within 2cm(1") ofeach other and that neither are close to anything hot or cold,
sunlight etc..
Ifthe units do not agree the 774 can be adjusted byselecting
Set\Calibrate\Temperature, this allows the user to change the temperature offset with
the éand êbuttons before pressing the Set button. Pressing "X" leaves the offset
unchanged.
The offset is the temperature (alwaysin Centigrade) that is added to the measured
temperature.
Example: Correct temperature is 20.4°C, 774 indicates 20.1°C, current offset is -0.2°C
The offset should be changed to +0.1°C
Table of contents
Other ELSEC Measuring Instrument manuals

Popular Measuring Instrument manuals by other brands

Skold
Skold SCBA Phantom NFPA 2002 instruction manual

Leuze
Leuze AMS 348i Original operating instructions

Foif
Foif J2-2 instruction manual

Smiths
Smiths BOEING B737-100 Maintenance manual supplement

Ambiductor
Ambiductor HEAT 1 Operating and mounting instructions

Start italiana
Start italiana TOKHEIM Pro Gauge XMT-SI-485-LOG installation manual

CTC Union
CTC Union 589342301 Installer manual

Southwire
Southwire M555TP operating instructions

socomec
socomec DIRIS A80 operating instructions

Caen
Caen V1724 Series Technical information manual

ElektroPhysik
ElektroPhysik MiniTest 7200 FH Technical manual and operating instructions

Shinko
Shinko WIL-101-ORP instruction manual


