Field Scout TDR 350 User manual

TDR 350
Soil Moisture Meter
PRODUCT MANUAL
Item # 6435
Distributed & Supported By:
www.edaphic.com.au
Ph: 1300 430 928

2
CONTENTS
Shaft Dimensions 4
Specifications 5
Batteries 6
Button Functions 8
Display Screens 10
Meter Calibration 14
Updating Firmware 15
Electrical Conductivity 16
Meter Operation 18
Replacing or Re-attaching the Probe Block 21
Field Scout Mobile App/SpecConnect 22
Data Logs 24
VWC Measurements 26
GPS 27
Appendix 1: Soil-Specific Calibration 28
Appendix 2: Checking VWC Readings 30
Appendix 3: FAQ 31
Appendix 4: Time Zone Corrections 32
This manual will familiarize you with the features and operation of
your new Field ScoutTM TDR 350 Soil Moisture Meter. Please read
this manual thoroughly before using your instrument.

3
Thank you for purchasing the Field ScoutTM TDR 350
soil moisture, electrical conductivity and soil surface
temperature meter. This manual describes the meter's
general features and operation.
Soil moisture is a critical, and potentially highly varia-
ble, component of the soil environment. Time domain
reflectometry is a proven technology for quickly and
accurately determining volumetric water content
(VWC) in soil. Electrical conductivity (EC) is a func-
tion of the moisture and salt in the soil. The meter also
measures soil surface temperature. The user can quickly
transition between taking VWC readings in standard
and high-clay mode.
The TDR 350's shaft-mounted probe allows the user to
take measurements while standing. The meter’s built-in
data logger can record data from several sites and elimi-
nates the need to record data manually. The data points
can be viewed with the FieldScout Mobile app that
maps out soil measurements on logged GPS locations or
measurements can be saved to a USB drive that is
plugged into the built-in USB port.
Contents
Your shipment includes the following components:
-TDR 350 meter (in collapsed position)
-Carrying case
-4 AA batteries
Note: TDR rods are sold separately
General overview

4
Shaft dimensions
The following are the dimensions of a fully extended
shaft. It is possible to reduce the length of the meter to
23” (58.5 cm) by adjusting the lower half of the shaft.
38"
19.5"
2.4"
14"
5"

5
Measurement
Units
Percent volumetric water content (VWC)
Period (raw sensor reading)
Resolution VWC: 0.1% VWC units
EC: 0.01 mS/cm
Temperature: 0.2 ˚F (0.1 ˚C)
Accuracy VWC: ±3.0% volumetric water content
with electrical conductivity < 2 mS/cm
EC: ± 0.1 mS/cm
Temperature: ± 1.8 ˚F (± 1 ˚C)
Range VWC: 0% to saturation (Saturation is typi-
cally around 50% volumetric water)
EC: 0 to 5 mS/cm
Temperature: -22 to 140 ˚F (-30 to 60 ˚C)
Power 4 AA batteries
Lithium batteries will optimize battery life
Logger
Capacity
50,000 measurements
Display Backlit, high-contrast, graphic LCD
GPS Accuracy < 2.5m
Weight 4.3 lbs. (1.9 kg)
Probe Head
Dimensions
2.4” x 1.4”
(6cm x 3.5cm)
Shaft
Dimensions
Extended Length: 38” (96.5cm)
Collapsed Length: 23” (58.4cm)
Width: 1.4” (3.5cm)
Available
Rod
Dimensions
Turf 1.5” (3.8cm),
Short 3” (7.6cm),
Medium 4.7” (12cm)
Long 7.9” (20cm)
Diameter: 0.2” (0.5cm)
Spacing: 1.2” (3cm)
Specifications

6
Changing the batteries
The TDR 350 requires 4 AA batteries. The battery holder
is on the underside of the display unit. The sensor is at-
tached to the display via a cable that is plugged into a
socket between the battery holders. The cable can be
pulled out of and pushed back into the shaft through a
grommet at the top of the shaft.
STEPS:
1. Turn the TDR 350 upside down and remove the 4
screws. Open the bottom and separate the display
module from the base plate. This may require pulling
the cable slightly out of the shaft.
2. Unplug the cable connector from the jack to complete-
ly detach the display from the base.
3. Install batteries and ensure correct polarity by refer-
encing the (+) positive and (-) negative labels at either
end of each slot.
4. Plug the cable connector back into the larger stereo
jack.
5. Mount the display box back onto the base plate. As
you do this, feed the cable back into the grommet.
6. Reattach the 4 screws.
Batteries
cable
plug
grommet
7
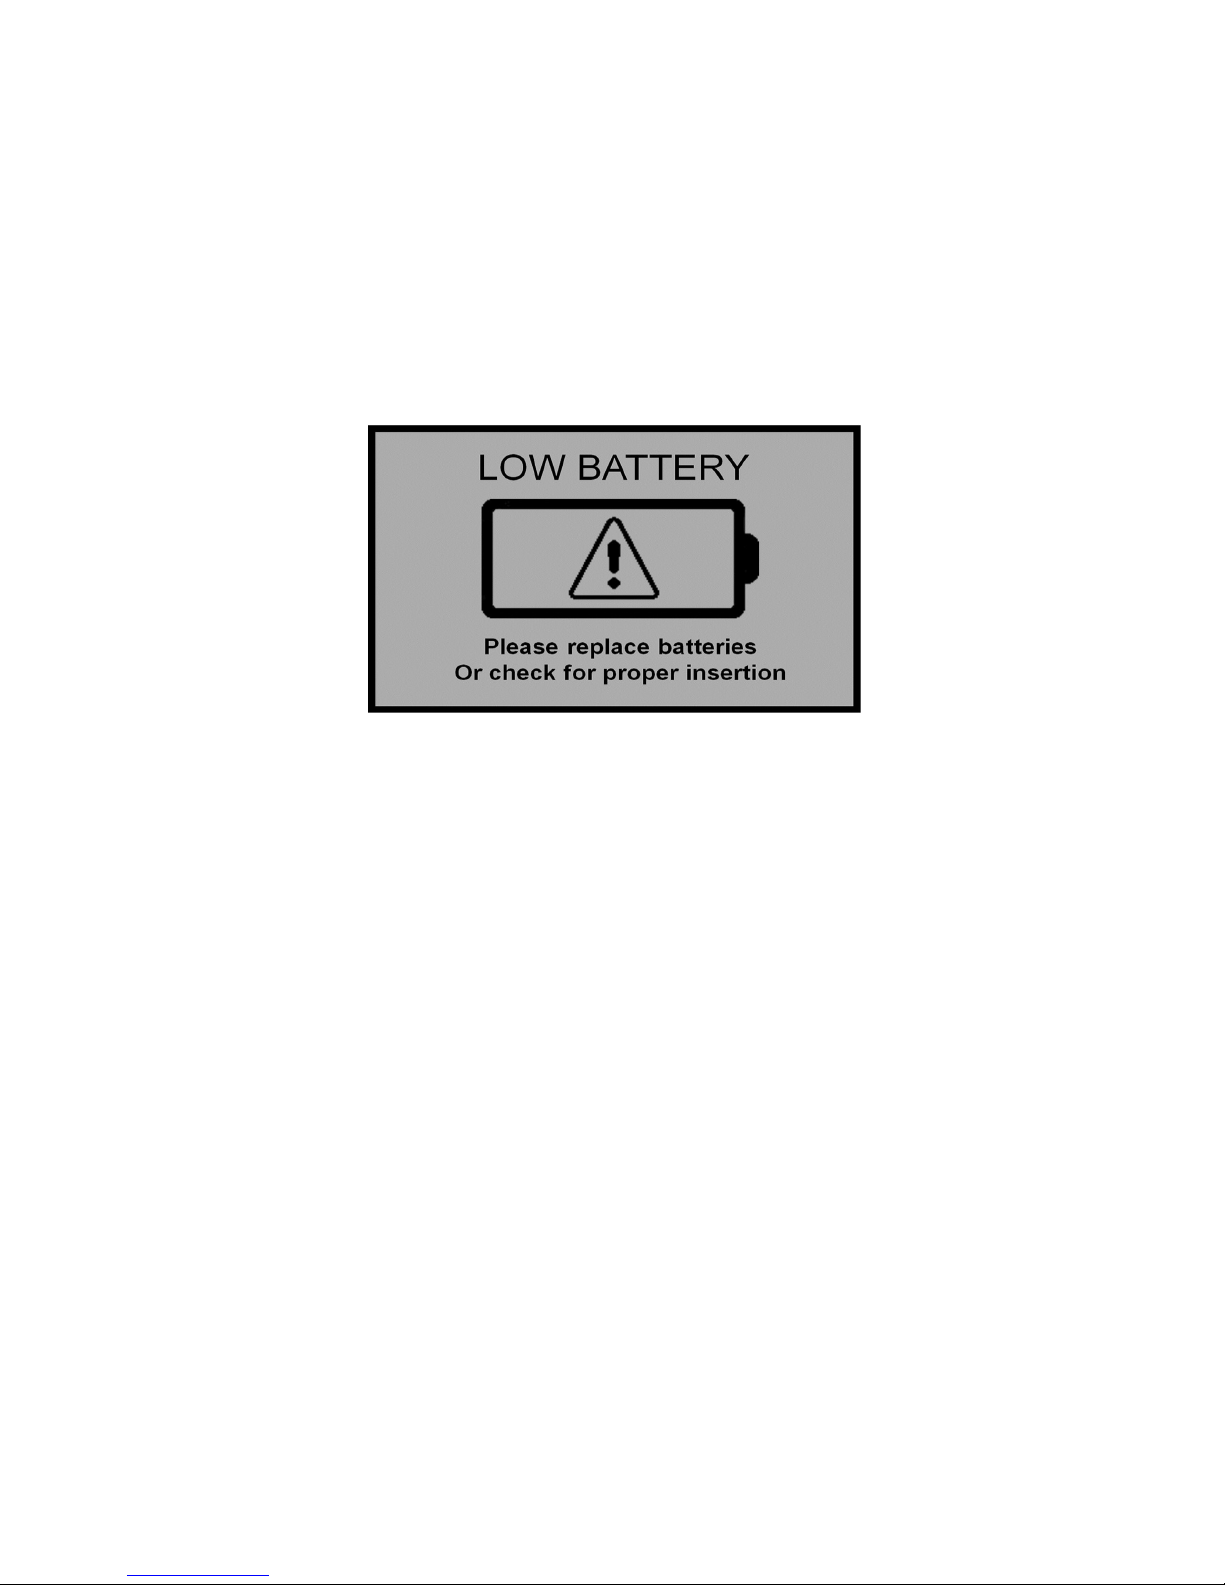
Battery life
The battery level is checked every time the display
unit is turned on. If the battery level is low, or if a
battery is inserted incorrectly, this low battery im-
age shows on the full screen for about 10 seconds
and then the display will automatically turn off.
In addition to frequency of use, battery life is im-
pacted by use of the backlight and GPS receiver. If
not needed, the GPS feature should be disabled.
The backlight can be set to AUTO mode (p. 12).
This allows enough time to see the reading without
unduly taxing the battery.
8
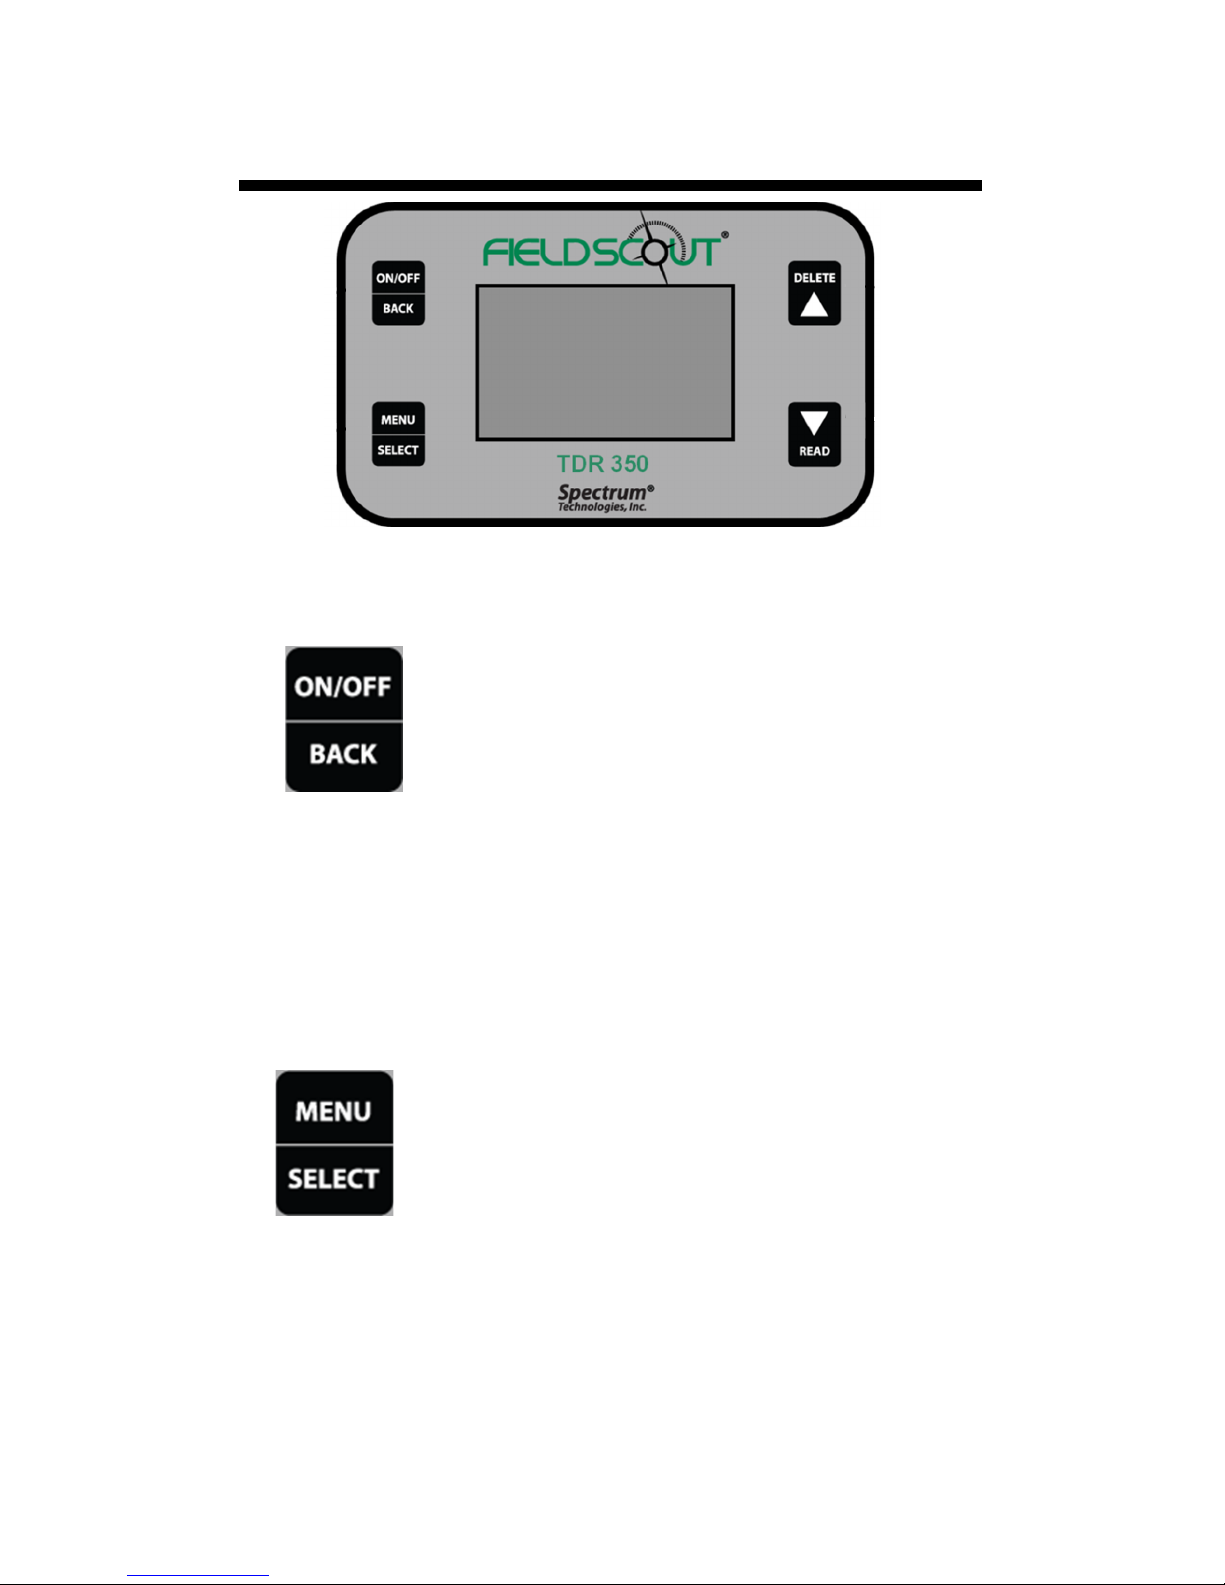
Button Functions
Basic Button Operations
ON/OFF or BACK button
Press this button briefly to turn on the
display. The meter will then display
the Data screen (p. 11). To turn the
meter off, press and hold this button
for about 2 seconds.
When in the Settings Menu screen (p. 12), press
this button to return to the Data screen. If you are
in a settings option that requires its own screen,
this button will return you to the Settings Menu
screen
MENU or SELECT button
When in the Data screen, press this but-
ton to go to the settings menu screen (p.
12). When in the Settings Menu screen
and on a menu option, press this button
to browse through the different choices
for that specific menu selection. In
some cases, selecting a settings option will take
you to another screen for further action.

9
DELETE or UP button
When on the Data screen (p. 11), press
this button to delete the last measured
data point from the computed Average
and decrement the Count.
When on the Settings Menu screen (p. 12), press
this button to scroll up to the previous menu item.
READ or DOWN button
When on the Data screen, press and
release this button to take a sensor
reading. Press and hold to clear the av-
erage and reset the sample count to 0.
When on the Settings Menu screen, press this but-
ton to scroll down to the next menu item.

10
Display Screens
The TDR 350 has 3 main display screens;
- Startup Information screen
- Data screen
- Settings Menu screen
Startup Information screen
The Startup Information screen is displayed for
about 2 seconds after the display is turned on.
If desired, the startup screen can be kept on for a
longer duration. While powering up the meter,
press and hold the On/Off/Back button to contin-
ue displaying the Startup Device Information
screen. Release the button to proceed to the Data
screen.
11
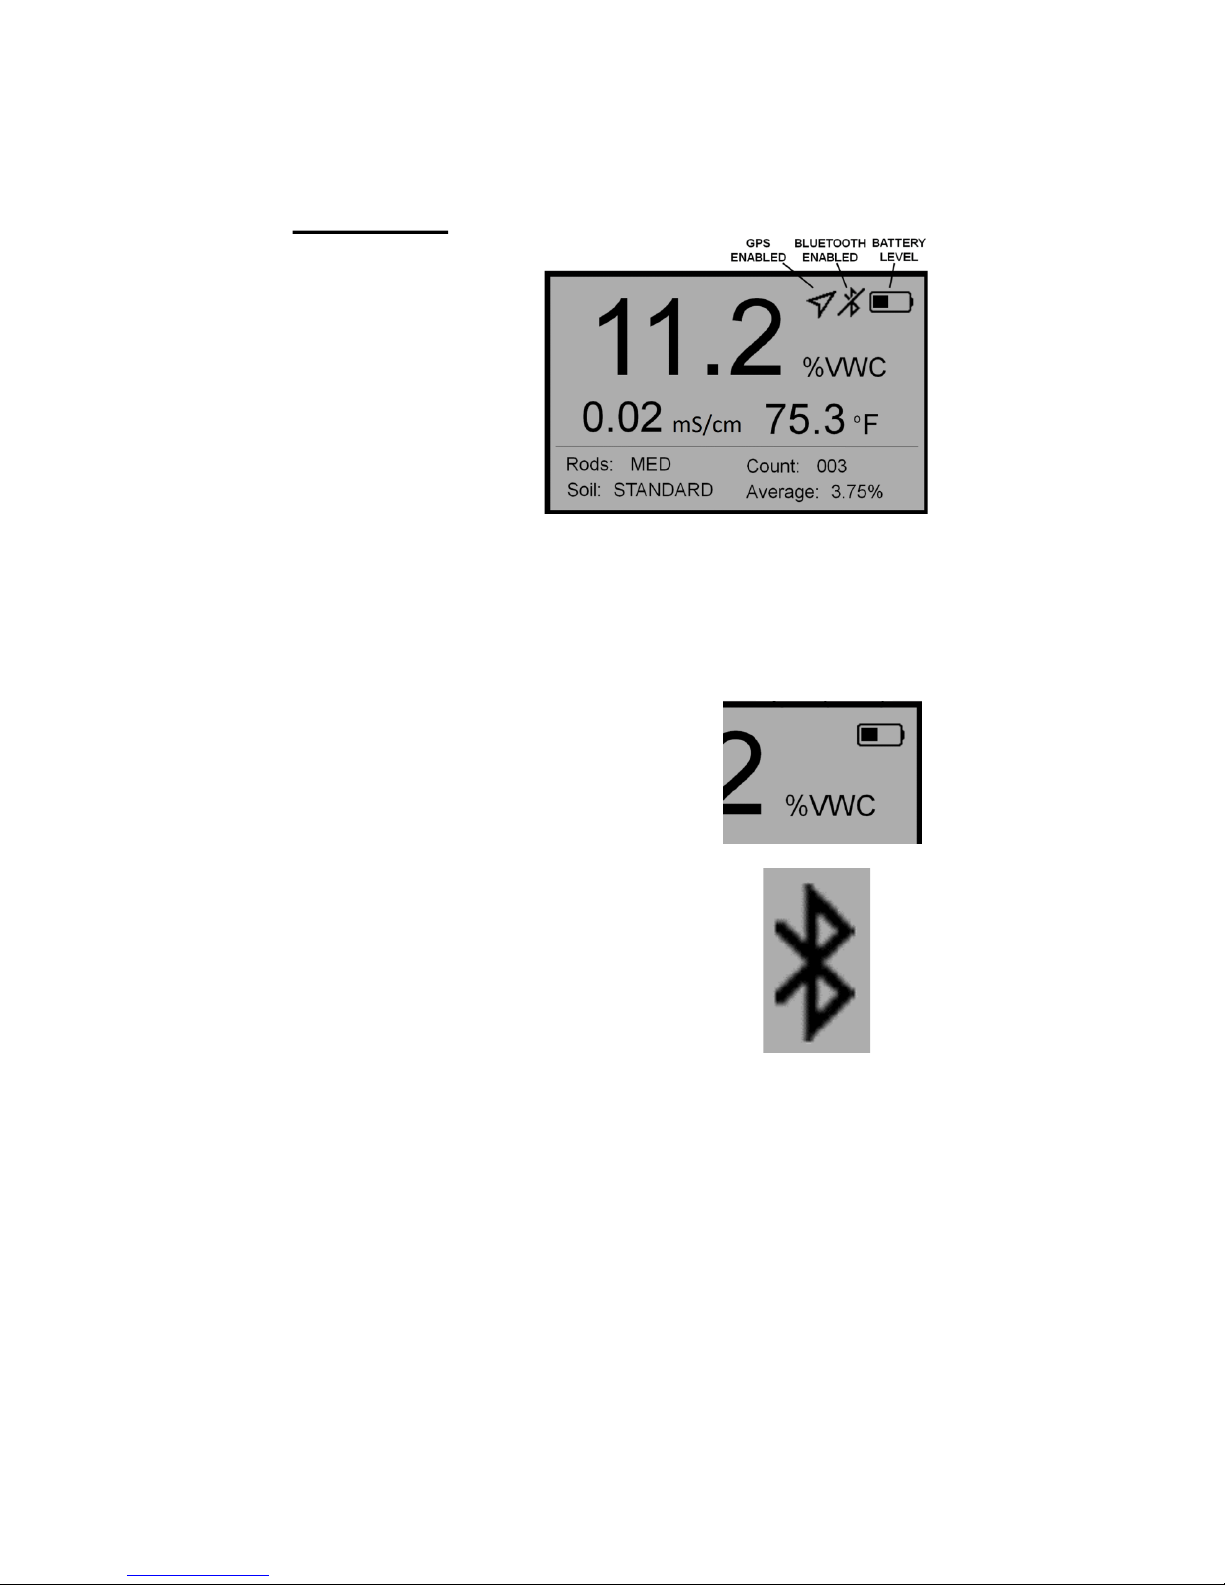
Data screen
Readings from
the sensor are
displayed on the
Data screen. The
battery level in-
dicator appears
in the upper right
corner. The run-
ning average and
number of readings included in that average are
shown in the lower right corner. Pressing and
holding the READ button will clear the average
and re-set the counter to 0.
When disabled, the GPS and/or
Bluetooth icons will no longer
be visible. When visible, the
GPS icon will indicate the quali-
ty of the GPS fix (p. 27).
When the Bluetooth is enabled
but the TDR is not connected to
a mobile device, the Bluetooth
icon has a bar through I (see im-
age in data screen at top of
page). When the TDR is con-
nected to a mobile device, the bar is removed (see
image to the right).
12
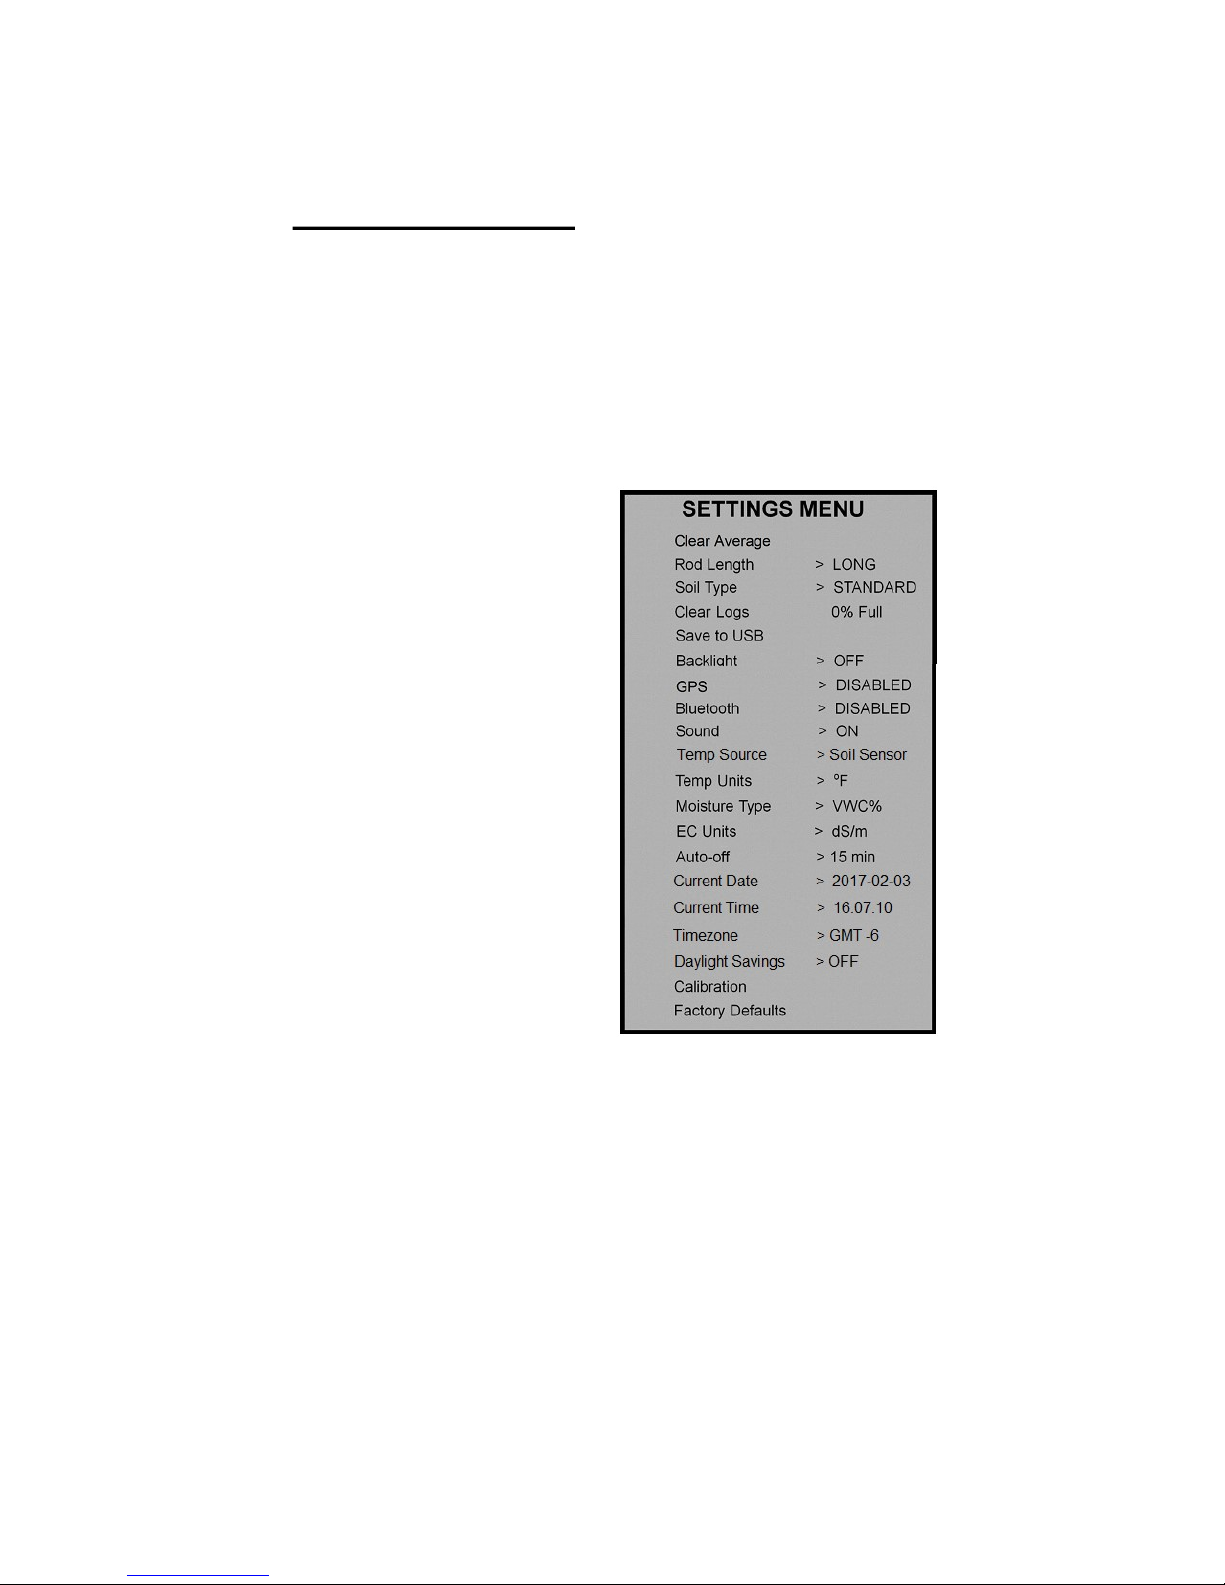
Settings Menu screen
The contents of the Settings Menu are shown on
the following figure. Use the arrow buttons to
scroll to the desired option. The options are de-
scribed below. For most options, pressing the Se-
lect button simply toggles you through the differ-
ent choices for that option. Some options require
an additional step or steps.
Clear Average*:
Clears the current av-
erage and resets the
counter to zero.
Rod Length: Select
the size rods attached
to meter. See p. 5 for
options.
Soil Type: Choose
Standard or High Clay.
Clear Logs*: Initiates
erasing of data from
internal memory.
Save to USB*: Initi-
ates transfer of data to USB flash drive.
Backlight: The three options are ON, OFF, and
AUTO. In AUTO mode, the backlight will be illu-
minated for 5 seconds after a measurement is taken
and then shut off.
GPS, Bluetooth, Sound: Enable or disable these
options. If location is not needed or a mobile devic-
es is not used, disabling these features will improve
battery life.

13
Temp Source: Choose Soil Sensor or IR Sensor
(IR sensor accessory will be available soon).
Temp Units: Choose Fahrenheit or Celsius.
Moisture Type: Choose volumetric water content
(VWC%), raw sensor reading (Period), or TDR
300 mode. The latter will report a VWC that
matches the output of the TDR 300 meter (no EC
optimization).
EC Units: Choose simple EC value (mS/cm) or
the Salinity Index (see p. 17).
Auto-Off: Choose how long the meter will stay on
before automatically powering off.
Current Date, Current Time: These are reported
values. They cannot be manually adjusted. This
information is acquired from the GPS signal.
Timezone: Choose the offset from Greenwich
Mean Time (see p. 32). As you change the offset,
the Current Time and Date will be updated.
Daylight Savings: Options are ON or OFF.
Calibration*: Initiates calibration sequence (see p.
14).
Factory Defaults*: Returns all meter settings to
the factory default values. See p. 31.
* Pressing Select button for these options brings
up an additional screen.

14
The meter has internal calibrations for standard
and high-clay soil types. It also has the option of
outputting a value that matches its predecessor, the
TDR 300. These calibrations will work for a large
number of soils. However, each meter will have a
small difference in how it responds to identical soil
conditions. This is due to sensor drift or variability
in the electronic components used during manufac-
turing. The meter allows for adjustments to the cal-
ibration to account for these differences. There-
fore, if two meters are giving slightly different
readings in the same soil, the output of the meters
can be standardized such that the meters can be
used interchangeably. After calibration, a TDR
350 in "TDR 300" mode (see p. 13) should read
the same as a TDR 300 meter.
To perform the calibration, you will need a 6" di-
ameter plastic container of distilled or de-ionized
water. The container must be at least as tall as the
length of the TDR rods. The procedure is as fol-
lows:
1. From the Settings menu (p. 12), scroll to the
Calibration option. Press the Select button to
initiate the calibration process.
2. Hold the meter so the rods are in the air. Press
the Menu/Select button and wait until the me-
ter indicates it is ready.
3. Immerse the rods completely in the water.
Press the Menu/Select button and wait until
the meter indicates it is ready.
Meter Calibration

15
The meter will then show that the calibration is
complete for that specific rod length. If more than
one rod size is being used, a calibration operation
must be done for each one.
Note: This procedure is different than a soil-
specific calibration (Appendix 1, p. 28) where a
unique calibration curve is generated.
Updating Firmware
The firmware of the TDR 350 can be updated us-
ing a USB flash drive. Firmware update files can
be found at the Spectrum website.
1. Copy the latest firmware update from your PC
onto your flash drive.
2. Power off the meter.
3. Insert the flash drive into the meter's USB port.
4. While holding down the Delete button, and
press the On/Off/Back button. The meter will
beep.
5. Release the Delete button after the meter beeps
a second time.
6. Remove the flash drive.
The meter will then power up as usual.

16
Electrical Conductivity
Electrical Conductivity
Knowledge of the salinity level of your soil is an im-
portant component of irrigation and nutrient management.
The source of the salts in the soil ranges from the original
parent material to additions from natural sources and man-
agement activity. Often, having salt in the soil has a nega-
tive connotation. This is because when the soil solution
has a high salt concentration, plant roots cannot bring in
sufficient soil moisture. However, fertilizer exists as salt
ions in that same soil solution. So, if the salt level is too
low, the plant cannot get the nutrients it needs.
Direct measurement of salt content can only be done by
subjecting a field sample to laboratory analysis. Fortunate-
ly, the electrical conductivity (EC) is a function of the dis-
solved salts in the soil. EC is expressed in units of mS/cm.
This proxy measurement is possible because, as salts dis-
solve into the soil, they disassociate into ions which con-
duct electricity. EC is highly temperature dependent. The
temperature correction, in turn, is dependent on the com-
position of the electrolyte solution. For example, a 0.01m
KCl solution would have a temperature correction factor
of 0.02 mS/cm per degree C.
The EC measured by an electrode is defined as the bulk
EC. The significance of this value depends on how the
sample was prepared. The EC reported by a soil lab is typ-
ically the saturated media extract. Briefly, distilled water
is added the soil until it glistens. The soil solution is given
time to equilibrate with ions on the soil exchange sites.
This soil water is then suctioned off to be measured.
Measuring the EC of diluted soil/water solutions (such as
1 part soil: 2 parts water) is also common. The determina-
tion of whether the EC is within an acceptable range is
based on the type of sample being measured.

17
The TDR 350 uses the same metal rods used for soil mois-
ture sensor as the electrodes for the EC circuit. The value
measured is an average for the entire depth sampled.
Salinity Index
The TDR 350 measures the bulk EC of soil that may or
may not be saturated. There are two competing mecha-
nisms at place. As the soil dries, the remaining solution in
the pore space becomes more concentrated which increas-
es its EC. However, reduced water in the pores leads to a
longer and more tortuous path between the sensor elec-
trodes, which decreases EC. The second mechanism dom-
inates. This means that bulk EC will decrease as soil
moisture decreases. EC measurements at different sam-
pling times are comparable when the moisture content for
each measurement is the same. This is easily accom-
plished if readings are always taken when the site is at
field capacity. Field capacity is defined as the condition
that exists when a saturated soil is allowed to drain to the
point where the pull of gravity can no longer remove any
additional water.
The TDR 350 also gives the option to report EC in the
form of the Salinity Index. The salinity index is defined as
the ratio of the bulk EC to the volumetric water content
(expressed as a decimal). For example, if the bulk EC is
0.25 mS/cm and the VWC is 22%, the Salinity Index
would be reported as 1.14 (0.25 ÷ 0.22 = 1.14). Therefore,
the Salinity Index combines VWC and EC (corrected for
temperature) into a parameter that will be less dependent
on the sub-saturated water content.

18
Meter Operation
Setting up the meter
The telescoping shaft (fig. 1) can be used in an extended
or retracted position. To adjust the length, remove the
fastening bolt and push or pull the shaft into its new posi-
tion.
Screw the rods into the sockets at the bottom of the probe
block.
Configuring the meter
Turn on the meter and ensure that it is properly config-
ured. Configuration is done in the Settings menu (pp. 12 -
13).
The TDR 350 can be set to one of two Soil Type modes,
Standard or High Clay. The Standard mode will be appro-
priate for most mineral soils. The High Clay mode will be
more accurate for soils with higher clay contents (> 27%).
There are 3 Moisture Type options. VWC% mode dis-
plays the moisture content optimized by the output of the
EC sensor. Period mode displays the raw sensor reading.
This mode is intended primarily for troubleshooting or for
soil-specific calibrations. TDR 300 mode displays a read-
ing that will match the output of a TDR 300 meter.
Figure 1. Shaft, fastening bolt, and rods

19
To geo-reference data, enable the GPS capability. If you
are using the FieldScout Mobile app (p. 22), Bluetooth
functionality must be enabled. If GPS is disabled, the app
will use the phone's GPS instead.
Display
Figure 2 shows a sample
data screen. The GPS,
Bluetooth, and battery
status are shown in the
upper right corner. Soil
moisture, EC, and temper-
ature data are displayed in
the top half of the display.
The average reading and number of readings included in
the average are visible in the lower right corner. The cur-
rent Rod Length and Soil Type are shown in the lower
left corner.
Taking Readings
Push the rods into the soil. When taking a measurement,
it is important that the rods be fully inserted into the soil.
If not, part of the sampling volume will be composed of
air and the reading will be inaccurately low. For the same
reason, the probe should be inserted with a steady, down-
ward pressure. If the rods are wiggled into the soil, air
pockets can be created adjacent to the rods that will result
in low readings. The probe should not be struck with a
hammer or other blunt instrument as this can cause dam-
age to the internal electronics. Also, care should be taken
to ensure the rods are inserted as parallel to one another
as possible. This will not have a large affect on the read-
ing but will decrease the chances the rods will be bent or
broken. Likewise, it is best to avoid areas with rocks or
other material that can cause the rods to deflect or bend.
If the ground is especially hard or compact, you can use a
Figure 2.Sample data screen

20
Pilot Hole maker (item 6430PH) to make 3” holes to aid
in starting the insertion of the probe rods.
Press the READ button to initiate the measurement se-
quence. The reading should appear almost instantaneous-
ly. If the display does not detect the sensor, it will display
dashes. Check that the sensor is securely attached (see p.
21).
Note: The TDR rods are manufactured from type 303
stainless steel and are designed to bend if non-vertical
force is applied to them. This serves to protect the TDR
block electronics from potential damage that could be
caused by excessive force.
Occasional rod bending is normal, and can be expected
during the course of sampling. Longer rods will be more
susceptible to bending than shorter rods. If bending oc-
curs, rods should simply be bent back to parallel position,
perpendicular to the TDR block. Measurements will con-
tinue to be accurate provided that rods are reasonably
close to parallel.
If care is not taken to reposition rods to a parallel posi-
tion, subsequent pressure on the rods will accentuate the
bending and may cause the rods to break.
Rods should be considered maintenance items that may
need to be replaced over time, depending upon the nature
and frequency of sampling. The rods will wear most rap-
idly in sand-based root zones.
Table of contents
Other Field Scout Measuring Instrument manuals


