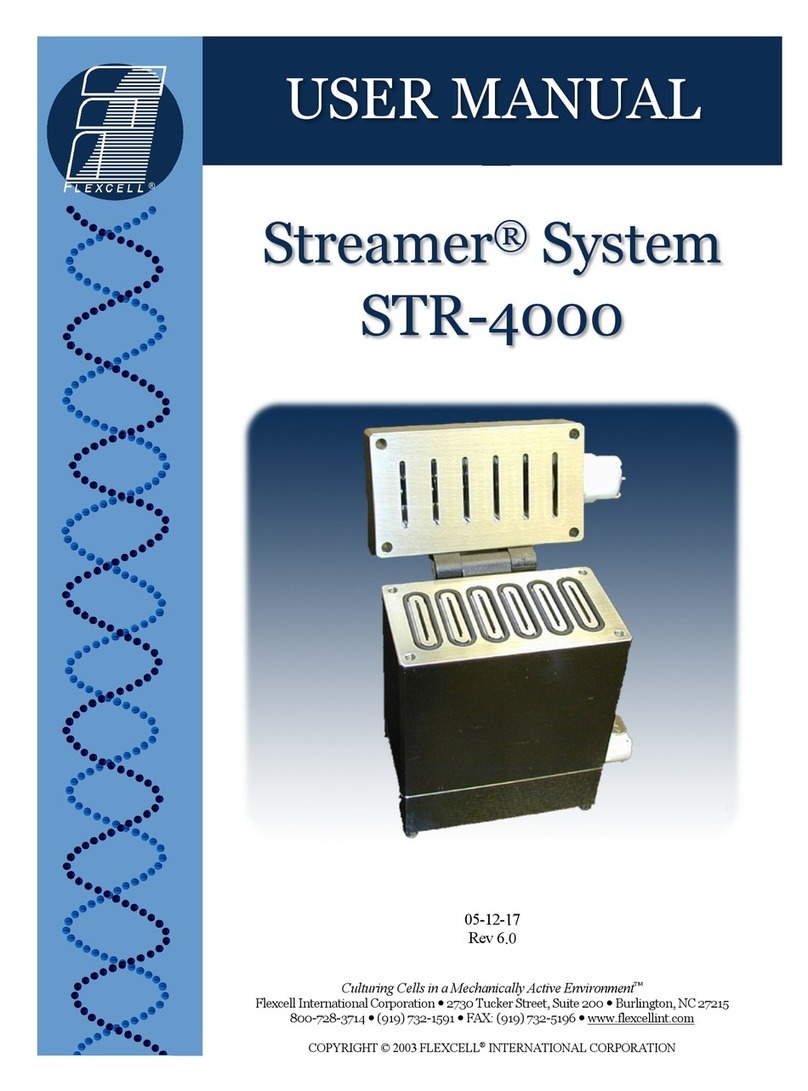
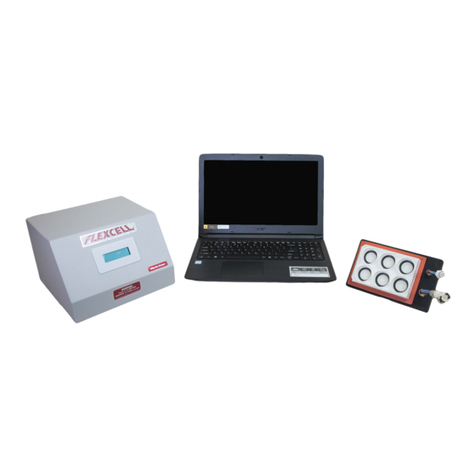
flexcell FX-5000 User manual

USER MANUAL
Flexcell®FX-5000™
Compression System
06-20-17
Rev 16.0
Culturing Cells in a Mechanically Active Environment
™
Flexcell International Corporation 2730 Tucker Street, Suite 200 Burlington, NC 27215
800-728-3714 (919) 732-1591 FAX: (919) 732-5196 www.flexcellint.com
COPYRIGHT © 2009 FLEXCELL
INTERNATIONAL CORPORATION

FLEXCELL®INTERNATIONAL CORPORATION
i
TABLE OF CONTENTS
One Year Limited Parts Warranty ................................................................................................ii
Dell Computer Warranty Information .........................................................................................iii
Federal Communications Commission Radio Frequency Interference Statement ...................... iv
FX-5000
™
Quick Start Instructions .............................................................................................. v
1. Flexcell
®
FX-5000
™
Compression System Components ....................................1
2. Setup of the Flexcell
®
FX-5000
™
Compression System......................................1
2.1 Packing List ...................................................................................................................... 1
2.2. Location of the FX-5000
™
Compression System ............................................................ 1
2.3 Setup of the Computer and FX5K
™
Compression FlexLink
®
.......................................... 2
2.4 Incubator Access Ports...................................................................................................... 3
2.5 Sample Preparation and Setup of BioPress
™
Culture Plates and Baseplate Clamping
Assembly........................................................................................................................... 4
2.6 Connecting the System Positive Pressure Lines ............................................................... 6
2.7 FlexSoft
®
FX-5000
™
Software and System Power-up ..................................................... 7
2.8 LCD Display on the FX5K
™
Compression FlexLink
®
..................................................... 7
2.9 Using Additional FlexLinks
®
............................................................................................ 8
3. Operation Instructions..........................................................................................9
3.1 Starting the FX-5000
™
Program ....................................................................................... 9
3.2. Using the FX-5000
™
Tutorial .......................................................................................... 9
3.3 Main Display Window...................................................................................................... 9
3.4. Configuring Users.......................................................................................................... 11
3.5 Creating Regimens.......................................................................................................... 11
3.6 Creating a Regimen with a Custom Waveform Shape ................................................... 13
3.7 Assigning Regimens ....................................................................................................... 14
3.8 Starting Regimens........................................................................................................... 14
3.9 Simulating Regimens...................................................................................................... 14
3.10 Pausing Regimens......................................................................................................... 15
3.11 Resuming Regimens ..................................................................................................... 15
3.12 Stopping Regimens ....................................................................................................... 15
3.13 Determine the Progress of the Regimen ....................................................................... 15
3.14 Resetting the FlexLink
®
................................................................................................ 15
3.15 Using the Pressure/Force Conversion Calculator ......................................................... 15
3.16 Data Analysis................................................................................................................ 16
3.17 Exiting the FX-5000
™
Program .................................................................................... 17
4. System Troubleshooting ....................................................................................17
5. Application Notes ..............................................................................................19
Sample Pressure Calculations Converting Sample Pressures to Forces ............................... 19
Baseplate and Gasket Cleaning and Disinfecting ................................................................. 19
6. Waveform Shape Definitions.............................................................................20
7. Flexcell
®
FX-5000
™
Compression System Specifications ..................................... 22
Appendix: FX-5000
™
Compression System Dual Baseplate Operation .................. 24

FLEXCELL®INTERNATIONAL CORPORATION
ii
ONE YEAR LIMITED PARTS WARRANTY
Flexcell®FX-5000™Compression System
1.
FLEXCELL INTERNATIONAL CORPORATION warrants to the original purchaser/customer all hardware components of the Flexcell
FX-5000
Compression System serial #___________________________for a period of one year from the date of shipment to the purchaser/customer to be free from
manufacturing defects in workmanship or materials with the following exceptions, terms and conditions:
a.
ITEMS EXCLUDED FROM THE WARRANTY ARE: Dell OptiPlex desktop computer and monitor*, software, disks, manuals and external
peripherals such as printers, mouse or track ball units, imaging devices, vacuum pumps, air tanks, electric voltage converters, compressors, surge
suppressers and all other accessory equipment.
b.
DURING THE WARRANTY PERIOD, the purchaser/customer must notify Flexcell of any warranty claim in writing, by telephone, fax transmission
or email identifying each defective part or specifically describe the exact problem no later than the last day the warranty is in effect.
c.
FLEXCELL AGREES to correct any defect in workmanship or material and supply new or rebuilt parts in exchange for defective parts upon
completion and submission by purchaser/customer of a printed “Parts Return Authorization” form furnished by Flexcell. Parts must be properly
packed in original container and shipped to our factory service center or distributor with all shipping costs prepaid if the unit is out of warranty
coverage. If the original shipping box is not available, Flexcell will send the required protective shipping container. (Flexcell will recommend the
insurance value for parts or equipment to be shipped.) Return carrier shipping costs within the US and Canada will be paid by Flexcell from the
service center. All other shipping costs outside of the US and Canada will be paid by the purchaser/customer. The purchaser/customer is solely
responsible for payment of custom fees, taxes, holding fees or value added taxes.
d.
THIS LIMITED WARRANTY only covers failures due to defects in materials or workmanship which occur during normal use. It does not cover
damage which occurs in shipment or failures of original equipment due to products identified as add-ons not manufactured by Flexcell International
Corporation or its distributors nor does this limited warranty cover damages or failures which result from accident or disaster such as fire, explosion,
flood, wind, lightning, or earthquake or misuse, abuse, neglect, mishandling, misapplication, alteration, faulty installation, modification or service
by anyone other than our factory or distributor. Breaking the seal and opening the unit case or violating unit components will void the warranty. This
warranty is extended only to the original purchaser/customer unless a transfer of ownership is approved by Flexcell in writing.
e.
LIMITED LIABILITY. Flexcell or its distributor’s only liability shall be to remedy any defect to comply with its warranty and return the repaired
equipment to function as designed. Under no circumstances shall Flexcell or its distributors be liable for any special incidental or consequential
damages based upon breach of warranty or contract or negligence. Such damages include, but are not limited to: loss of profits, revenue, loss of data,
down time, customer’s material or time.
f.
DISCLAIMER OF WARRANTIES: The Limited Warranty expressed in the foregoing language is the only warranty applicable to this product. Any
other warranty, expressed or implied warranty or of merchantability or fitness for a particular purpose are hereby disclaimed. No oral or written
information or advice provided by Flexcell, through its agents or employees, in the use and functioning of the equipment shall in any way create a
warranty or in any way increase the scope of this limited warranty.
g.
DISCLAIMER: LANGUAGE. This warranty document, accompanying instruction manual and supplemental applicable laws appear in the English
language. In the event of any inconsistency in the meaning of the words and terminology and any foreign language translation, the English language
shall prevail.
2.
GOVERNING LAW. The performance of the duties and liabilities of the parties under the terms and conditions of this Limited Warranty shall be governed in
all respects by the laws of the State of North Carolina, the United States of America.
APPLICATION OF STATE LAWS: Some states do not allow the exclusion or limitation of consequential damages nor do some states allow limitations on
how long an implied warranty lasts, so the above limitations may not apply to you. This warranty gives you specific legal rights and you may also have other
rights that vary from state to state.
3.
INTERNATIONAL CUSTOMERS. The full text of the foregoing limited warranty and all disclaimers is applicable to international customers/purchasers
except when the purchase was made from an international distributor or reseller, the warranty will be covered through your distributor or reseller.
If technical advisory support service is not available through your distributor or reseller, for service contact warranty headquarters by phone or fax.
Within the United States only: 1-800-728-3714 (toll free) - Fax: 1-919-732-5196
International Customer’s telephone: 01-919-732-1591 - Fax: 01-919-732-5196
Email: info@flexcellint.com
FLEXCELL INTERNATIONAL CORPORATION
2730 Tucker Street, Suite 200, Burlington, NC 27215
1-800-728-3714 (within the U.S. only) 1-919-732-1591 fax: 1-919-732-5196 http://www.flexcellint.com
*Customers should contact Dell Inc. for all warranty questions or concerns with regards to the Dell OptiPlex computer and monitor.

FLEXCELL®INTERNATIONAL CORPORATION
iii
Dell COMPUTER WARRANTY INFORMATION
Dear Customer:
Congratulations on your purchase of the Flexcell FX-5000 system. This system comes with a one (1) year
warranty. The Dell computer that is included with this equipment will be transferred into the Principal
Investigator and University’s name at the time of purchase. This computer comes with an excellent
warranty through Dell. If you have any problems with this computer, you will contact Dell directly. The
details of the warranty are listed below. You will need to have the service tag number and Express Service
Code number, which are located on the side of the computer.
Dell Hardware Limited Warranty Plus Onsite Service Extended Year
Dell Hardware Limited Warranty Plus Onsite Service Initial Year
Thank you choosing Dell ProSupport. For tech support, visit http://support.dell.com/ProSupport or
call 1-866-516-3115
ProSupport for IT: Next Business Day Parts and Labor Onsite Response 2 Year Extended
ProSupport for IT: Next Business Day Parts and Labor Onsite Response Initial Year
ProSupport for IT: 7x24 Technical Support for certified IT Staff, 2 Year Extended
ProSupport for IT: 7x24 Technical Support for certified IT Staff, Initial year

FLEXCELL®INTERNATIONAL CORPORATION
iv
FEDERAL COMMUNICATIONS COMMISSION
RADIO FREQUENCY INTERFERENCE STATEMENT
This computing equipment has been type-tested and found to comply with the limits for a Class B digital
device in accordance with the specifications for Subpart J of Part 15 of FCC Rules. These limits are
designed to provide reasonable protection against harmful radio and TV interference in a residential
installation. There is no guarantee that interference will not occur in a particular installation.
The following instructions and precautions must be observed by the user when installing and operating this
device:
1.
The equipment must be operated in strict accordance with the manufacturer's instructions.
2.
The unit must be plugged into a properly-grounded power outlet and used with the power cord
supplied with the unit, unmodified.
3.
The unit must be operated with the factory-installed cover in place.
4.
No modifications of the equipment can be made which may result in the equipment failing to meet
the limits of the FCC Rules.
5.
The equipment must be maintained in a satisfactory state of repair.
6.
Shielded cables must be used with this equipment to ensure compliance with the FCC Rules.
If the unit does interfere with radio or television reception, which can be tested by turning the unit off and
on, the user is encouraged to try the following suggestions to correct the interference:
1.
Reorient the antenna of the receiver.
2.
Relocate the equipment to increase the distance between the unit and the radio/TV.
3.
Connect the unit to an outlet on a different circuit from the receiver.
4.
Consult with the dealer or an experienced radio/TV technician for advice on ways to reduce
interference.

FLEXCELL®INTERNATIONAL CORPORATION
v
FX-5000Q
UICK
S
TART
I
NSTRUCTIONS
1. Choose a location for the FX-5000
™
Compression system that is near the
incubator.
2. Place the computer, monitor, keyboard,
mouse, and FX5K
™
Compression FlexLink
®
on a sturdy, flat surface.
3. Connect the keyboard, mouse, and monitor to
the computer according to the manufacturer’s
instructions.
4. Connect the FlexLink
®
(COMM) to the
Ethernet port on the back of the computer
using the Ethernet cable supplied (see Figs. 2
and 3, p. 2).
5. Connect the computer, monitor and
FlexLink
®
to a power source using a surge
protector.
6. Connect the system pressure line to the
SYSTEM port on the back of the FlexLink
®
using the ⅜" (9.5mm) OD blue tubing.
7. Cut the SYSTEM tubing near the unit and add
the pop-off valve and pressure gauge
assembly in line with the tubing.
8. Cut a 10' (3 m) length of the ¼” (6.4 mm)
blue and ⅜” (9.5 mm) clear tubing and
connect each to the back of the FlexLink
®
in
the FLEX IN and FLEX OUT ports,
accordingly. Attach the provided quick
disconnects to the other end of each piece of
tubing.
9. Place the tissue/gel samples onto the foam
disks in the center of each well of the four
BioPress
™
compression plates. Add 3-4 mL
of medium into each well. Place a stationary
platen into each well of the plates and screw
the center piece down until it touches the top
of the tissue/gel sample. Center the four
BioPress
™
plates on the four black
compression gaskets in the baseplate.
10. Adjust the clamping pads to their maximum
height on the compression clamping system.
Be sure that each pad surface is parallel with
the surface of the BioPress
™
baseplate to
prevent any of the pads from catching the
plate lids during insertion. Place the
Plexiglas
window into the clamping system,
evenly along the bottom four clamping bars.
NOTE: This window is used as a backing
support for the BioPress
™
baseplate to
enable it to withstand high pressures. Never
operate the compression baseplate without
this window in place.
11. Slide the BioPress
™
baseplate/plate assembly
into the clamping system and adjust so that
the four plates are centered underneath the
eight clamping pads. Check the Plexiglas
window below and move as necessary to
center it under the BioPress
™
baseplate.
Tighten the pads down until the wing nuts are
finger tight. At this point the BioPress
™
plates should be sufficiently clamped.
NOTE: If using less than 4 culture plates in
an experiment, put an old plate or support in
place of the missing plate(s) and tighten the
clamping pads onto this surface.
12. Place the baseplate/clamping system
assembly into the incubator. Insert the ¼"
(6.4 mm) blue and ⅜" (9.5 mm) OD clear
tubing into the access port of the incubator.
Snap the quick disconnects for the ¼" (6.4
mm) and ⅜" (9.5 mm) tubing to the quick
disconnects on the baseplate.
13. Turn the FlexLink
®
and computer system
ON. The Windows
desktop should appear
on the monitor. Double click on the FX-
5000
™
icon on the left hand side of the screen
to start the software.
14. In the Configure menu, select User Editor
and register as a user.
15. In the Regimen menu, select Create new and
create a regimen by entering values into the
appropriate spaces or click on the Run
Wizard button in the bottom left-hand corner
for a step-by-step procedure. When
completed, click on Save Regimen. Exit the
regimen editor.

FLEXCELL®INTERNATIONAL CORPORATION
vi
16. In Controllers menu, select the appropriate
FlexLink
®
number to which the regimen will
be downloaded.
17. In the Regimen menu, select Assign. Choose
the proper platform, user, and regimen
(Important: see section 3.7 - Assigning
Regimens) from the drop-down menus.
Confirm with a Yes to download the regimen.
18. Once the program is downloaded, click on
Simulate in the main window display. Once
satisfied that the regimen is correct, click on
Stop.
19. Turn ON the pressure source. **Do not
allow the input pressure to exceed 20 psi or
the transducers may be damaged.
20. Click on Start to run the regimen. The plates
should begin flexing.
21. To pause or stop the regimen, click on Pause
or Stop at any time. Otherwise, the program
will stop once the regimen is complete.

FLEXCELL®INTERNATIONAL CORPORATION
Copyright
2009 Flexcell International
FLEXCELL, FlexLink and FlexSoft are trademarks of Flexcell International Corporation. MS Windows and MS Office are trademarks
of the Microsoft Corporation. Adobe Acrobat is a trademark of Adobe Systems Inc. Dell OptiPlex is a trademark of Dell.
General Notice: Other product names mentioned in this manual are for identification purposes only and may be trademarks of their respective
owners. Flexcell International disclaims any and all rights in those marks.
1
1. FLEXCELL®FX-5000COMPRESSION SYSTEM COMPONENTS
1. Dell OptiPlex desktop computer.
Do not delete any software or change any
settings on this computer. It has been pre-
configured to operate the FlexSoft
®
FX-
5000
™
software.
Preinstalled software:
FlexSoft
®
FX-5000
™
Microsoft Windows
®
7
Microsoft Office 2010
Adobe Acrobat
2. FX5K
Compression FlexLink
®
3. USB Keyboard
4. USB 2-button entry mouse
5. 17” Flat Panel monitor.
6. Accessory pack - nuts, ferrules
7. Flexcell
®
positive pressure baseplate
8. Gaskets and clamping system
9. Plexiglas
®
baseplate bottom support
10. Inlet and outlet tubing
11. Flexcell
®
FX-5000
Compression
System User Manual and other ancillary
manuals for computer and monitor
12. Surge protected outlet strip
13. Pop-off valve/Pressure gauge assembly
14. Positive pressure source (Not supplied)
2. SETUP OF THE FLEXCELL®FX-5000™COMPRESSION SYSTEM
Do not power up the Flexcell
®
FX-5000
™
Compression system until all connections
among components have been properly
made and checked! Never power up the
FX5K
™
Compression FlexLink
®
with the
cover removed - an electrical shock hazard
exists. Operation of the computer without
the cover is in violation of FCC regulations
and will void the warranty!
2.1 P
ACKING
L
IST
Remove the packing list and check off the
instrument components as they are removed
from the shipping containers. If any parts are
missing, contact Flexcell
®
International Corp.
immediately.
2.2 L
OCATION OF THE
FX-5000™
C
OMPRESSION
S
YSTEM
Choose a location for the FX-5000
™
Compression system (Fig. 1) that is adjacent
and as close as possible to the CO
2
incubator
and positive pressure source. A shorter
distance in the pressure lines decreases the
airflow resistance for compression and
release of the flexible bottomed plates,
allowing for a greater range of compression
at higher frequencies. The length of the
pressure line should be a minimum of 4’ (1.2
m). All cables (mouse, monitor, keyboard,
and Ethernet communications cables) will
connect to the rear of the computer (Fig. 3).
All tubing and the Ethernet communications
cable connect to the rear of the FX5K
™
Compression FlexLink
®
(Fig. 2). The
length of the clear and blue tubing from the
FlexLink
®
to the baseplate should be 10' (3
m) long. This length can vary if necessary

FLEXCELL®INTERNATIONAL CORPORATION
2
but no more than 5' (1.5 m) longer or shorter.
Cut the tubing after the system is fully set up
to ensure of the proper length.
NOTE: The PUMP CONTROL CONNECTION
(Fig. 2) feature is only available with the FX-
5000
™
Tension system.
Figure 1. Flexcell
®
FX-5000
™
Compression
System
Figure 2. FX5K
™
Compression FlexLink
®
rear
view
The FX-5000
™
Compression system will
require a space 28.75” (73.03 cm) wide by
22.44” (57.00 cm) deep if the computer,
FX5K
™
Compression FlexLink
®
and monitor
are placed side by side with the keyboard and
mouse in front. The total weight of the
system is 48.37 lbs (21.96 kg).
Figure 3. Dell OptiPlex rear view
2.3 S
ETUP OF THE
C
OMPUTER
A
ND
FX5K™C
OMPRESSION
F
LEX
L
INK
®
Setup the Dell OptiPlex desktop computer
and peripherals according to the
manufacturer’s instructions. Refer to
Figures 1-10 for proper setup of the FX-
5000
™
system instruments. Place the
FX5K
™
Compression FlexLink
®
next to the
computer and connect the FlexLink
®
to the
computer via the Ethernet cable provided.
If additional FlexLinks
®
have been
purchased, they are to be placed side by side.
For multiple FlexLinks
®
to be controlled by
one computer, connect the Ethernet cable
from each FlexLink
®
to an Ethernet Hub.

FLEXCELL®INTERNATIONAL CORPORATION
3
Then, connect the hub to the Ethernet port on
the back of the computer.
Connect the system tubing as follows:
1. Connect the ⅜” (9.5 mm) O.D. blue tubing
from the pressure source to the SYSTEM
port on the back of the FlexLink
®
(Fig. 1
& 2).
2. Attach the free end of the clear ⅜” (9.5
mm) tubing to the FLEX OUT port on the
back of the FlexLink
®
(Fig. 2).
3. Attach the free end of the blue ¼” (6.4
mm) tubing to the FLEX IN port on the
back of the FlexLink
®
(Fig. 2). The VENT
port should be left open.
NOTE: When connecting the tubing to the back
of the FlexLink
®
, slip the brass nut with the nylon
ferrule over the tubing, then push the tubing onto
the fitting as far as possible and tread the nut onto
the fitting. Tighten each nut by hand until the
tubing is completely crimped. If the tubing is not
firmly connected it may blow off under high
pressures.
Connect the power cables (115 or 230 VAC)
to the rear power inlet (FlexLink Power) of
the FlexLink
®
(Fig. 2). If the available power
supply is 115 VAC or 230 VAC, be sure the
voltage selection switch ON the computer
(Fig. 3) is set to 115 V or 230 V, respectively.
When the instruments are completely set up,
the power cords should be connected to a
surge protected power strip and then to a 115
VAC or 230 VAC, 60 Hz power outlet.
2.4 I
NCUBATOR
A
CCESS
P
ORTS
Consult the operations manual of the CO
2
incubator for the location of the incubator
access ports. Most incubators have an access
port at the top or the rear of the incubator. If
this opening is not immediately apparent,
consult the incubator manufacturer about the
location of an access port. To prevent voiding
the incubator warranty or encountering an
electrical hazard, a trained incubator
representative should open the incubator
access ports.
Once the access port has been located, insert
the FLEX IN and FLEX OUT tubing
through the access port into the incubator.
Attach the ¼” (6.4 mm) blue tubing to the
¼” (6.4 mm) quick disconnect on the
baseplate. Attach the ⅜” (9.5 mm) clear
tubing to the ⅜” (9.5 mm) quick disconnect
on the baseplate (Fig. 4). If two baseplates
are to be used simultaneously, connect the
baseplates using the configuration as shown
in Figure 5.
Figure 4. Single baseplate connection
(clamping system not shown)
Figure 5. "T" connection for two baseplates
(clamping systems not shown)

FLEXCELL®INTERNATIONAL CORPORATION
4
2.5 S
AMPLE
P
REPARATION AND
S
ETUP
OF
B
IO
P
RESS
™
C
ULTURE
P
LATES
AND
B
ASEPLATE
C
LAMPING
A
SSEMBLY
The BioPress
™
compression culture plate
contains a foam ring and sample holder in
each well (Fig. 6). The foam ring is used to
contain the removable sample holder. In
preparing samples, be sure that the sample
thickness is no less than 1000 m and no
greater than 0.118” (3 mm). The thickness of
the compressed foam is 350 m; therefore,
thinner samples will not be compressed. A
sample thickness of 1000 m or more will
ensure compressibility. The maximum
chamber height is 0.122” (3.1 mm); therefore
samples with a thickness greater than 0.118”
(3 mm) will be preloaded when the platens are
inserted into the wells of the culture plates.
Figure 6. Compression culture plate foam ring
and sample holder
The sample diameter should be equal to or less
than the inner diameter of the foam sample
holder in the chamber, which is 0.200” (5
mm). If the user wishes to use a larger sample,
they can remove the sample holder and place
the sample within the larger ring that normally
contains the sample holder. This will allow a
sample diameter of up to 0.525” (13 mm).
To prepare a sample for loading, remove the
sample holder from the plate using a pair of
sterile forceps. Place the tissue or gel sample
into the hole at the center of the removable
sample holder. Carefully place the sample
holder back into the BioPress
™
compression
plate so that it is contained within the foam
ring. Do this for the remainder of the wells.
Add 3-4 mL of culture medium to each well.
Prepare all stationary platens by adjusting
the center screw (Fig. 7) such that the screw
bottom (part that touches the sample) is
exactly flush with the bottom of the platen
body. Use a pair of sterile forceps and the
two holes at the adjustable center of the
platen to turn the center screw.
Figure 7. Stationary platen and compression
culture plate
Place a stationary platen into each well of the
compression plate (Fig. 7). Calculate the
number of revolutions required to bring the
bottom of the center screw to the point where
it just touches the top of the sample by using
the following equations:
For sample height in millimeters,
x = (3.11-h) / 0.62

FLEXCELL®INTERNATIONAL CORPORATION
5
where xis the # of 180 degree clockwise turns
required for the center screw to touch the
sample and his the sample height in
millimeters.
For sample height in inches:
x = (0.122-h) / 0.025
where xis the # of 180 degree clockwise turns
required for the center screw to touch the
sample and his sample height in inches.
NOTE: If the sample height is larger than 3.11
mm (0.122”), ‘x’ in the above equations will be a
negative number. In this case, the bottom of the
center screw will compress the sample when it is
flush with the bottom of the platen body as the
platen is first inserted into the well. To
compensate for this, the center screw can be
turned counterclockwise ‘x’ number of turns;
however, it should be noted that the sample will no
longer be fully compressible, as the base of the
sample holder will no longer be able to contact the
base of the center screw.
Using sterile forceps, turn the center screw
clockwise the number of turns required by the
above equation(s). Be careful not to screw the
center down too far as this will preload the
sample and give inaccurate force readings.
Add or remove fluid medium through any of
the eight holes around the inner periphery of
the platen (Fig. 7).
Center the BioPress
™
compression plates on
top of the four black gaskets in the baseplate
(Fig. 8). Adjust the eight clamping pads in the
clamping system to their maximum height and
turn them so that the bottom of each pad is
parallel with the surface of the baseplate.
Place the Plexiglas
window into the
clamping system (Fig. 9), evenly along the
bottom four clamping bars
NOTE: The Plexiglas window is used as a
backing support for the baseplate to enable it to
withstand high pressures. Never operate the
compression baseplate without this window in
place.
Figure 8. Baseplate with compression plates
Figure 9. Clamping system with Plexiglas®
window
Baseplate without plates
Baseplate with plates

FLEXCELL®INTERNATIONAL CORPORATION
6
Carefully slide the baseplate/plate assembly
into the clamping system so that the four
BioPress
™
plates are centered underneath the
eight clamping pads (Fig. 10). Check the
Plexiglas
window and move as necessary to
center it under the baseplate. Turn the wing
nuts on the clamping pads until they are finger
tight. This will compress the plates downward
onto the gaskets, creating a seal.
Figure 10. Clamping system with baseplate
and culture plates
NOTE: If using less than 4 plates in an
experiment, use an old plate or support in place of
the missing plate(s) and tighten the clamping pads
onto this surface. This will ensure that the
baseplate is seeing an even and sufficient pressure
across its surface and will prevent baseplate
blowout.
Place the entire assembly into the incubator.
Attach the FLEX IN and FLEX OUT quick
disconnect fittings to the fittings on the
compression baseplate (Fig. 1 & 4).
2.6 C
ONNECTING THE
S
YSTEM
P
OSITIVE
P
RESSURE
L
INES
Connect a minimal length of the blue ⅜” (9.5
mm) tubing to the positive pressure source.
The pressure source should be capable of
maintaining a pressure of 12-15 psi (83-104
kPa) when the FlexLink
®
is running. Most
house pressure systems will be capable of
maintaining this pressure. If a floor pump is
to be used, the following specifications are
recommended as a minimum:
Max Pressure: 60 psi (414 kPa)
Max Free Airflow Rate: 1.1 cfm (31
L/min)
If the pump does not meet one of the above
specifications, there is still a possibility that
it will have the capability of providing the
necessary pressure and flow rate
combination to run the FX-5000
™
Compression System. If the pump is capable
of producing a minimum of 0.9 cfm (25.5
L/min) at 12 psi (83 kPa), the pump can be
used with the FX-5000
™
Compression
System. Check with the pump manufacturer
to determine if the pump is capable of
meeting these specifications.
NOTE: Flexcell
®
highly recommends the use of
a pressure reservoir when using a floor pump as
the positive pressure source. Contact Flexcell
®
for information on purchasing a pressure
reservoir.
Keep the length of tubing between the
pressure source and FlexLink
®
as short as
possible (4’ or 1.2 m minimum). If the
pressure source does not have an adjustable
regulator built into it, a pressure regulator
will likely required to keep the input
pressure to the system at an acceptable level
(recommended at 12-15 psi (83-104 kPa),
no greater than 20 psi [140 kPa]). Most
house pressure systems will produce
Baseplate slides into
clamping system (Plexiglas
window on bottom) and then
tighten the clamps down over
the compression plates. Do
not over tighten.
Plexiglas window must fit
under the baseplate to
keep seal.

FLEXCELL®INTERNATIONAL CORPORATION
7
pressures up to several hundred pounds per
square inch (1 MPa or more). Such pressure
levels will damage the pressure transducers
in the FX5K
™
Compression FlexLink
®
.
To be sure that the proper input pressure level
is achieved, when running the system, first
adjust the pressure level to 15 psi (103 kPa)
when the unit is not yet running a regimen.
This can be done using a pressure regulator, or
by adjusting the relief valve on the pressure
output side of the pump (if using a small floor
pump). Once the regimen has begun, check to
see how much the pressure drops on the
gauge. Readjust the pressure regulator or
relief valve as necessary to get the input
pressure between 12 and 15 psi (83 and 104
kPa) while the regimen is running. This will
assure a proper pressure level for the unit to
function correctly.
NOTE: With optimal pressure settings, there will
still be some system limitations due to airflow.
Combinations of high frequencies and forces may
not be achievable due to the high pressure level in
the short period of time requested. An example
would be a regimen programmed to run from 0-12
pounds at 1.0 Hz. The system is not able to achieve
the pressure required to reach 12 pounds in 0.5
seconds because of airflow limitations. Therefore
the output may only reach 9 or 10 pounds. The
exact output is dependent on several system
variables such as tubing and overall system
volume. To maximize system performance, use the
shortest tubing lengths possible (see section 2.2).
2.7 F
LEX
S
OFT
®
FX-5000
S
OFTWARE
AND
S
YSTEM
P
OWER
-
UP
The FlexSoft
®
FX-5000
™
software
(Flexcell
Copyright Protected Software,
Property of Flexcell
®
International
Corporation, 2730 Tucker Street, Suite
200, Burlington, NC 27215 has been pre-
installed on the hard drive.
Keep the CD package included with the
system and store it in a safe place. Be sure
to shutdown Windows
properly by using
the Shut Down command activated by the
Start button. Failure to follow the above
directions can cause software and
hardware malfunctions.
The computer has Windows
XP installed
on the hard drive. All backup software is
provided with the system. Check all
connections and connect the surge protector
into an appropriate power outlet (115 VAC
or 230 VAC). Turn ON the surge protector
strip and check that the indicator light on the
strip is lit. If the power light does not come
on, the surge protector has failed. Replace
the surge protector and attempt to determine
what caused the surge protector to fail. Turn
ON the power switch on the computer,
monitor and FX5K
™
Compression
FlexLink
®
. The system should then boot and
load Windows
®
. Select and double click on
the FX-5000
™
icon.
NOTE: Flexcell
®
recommends that the power
saving or screen saver features in the Windows
software are disabled. Allowing the hard drive
to power down while an experiment is running
may create the need to reboot the computer
before data can be viewed, or before a regimen
can be downloaded again. It is recommended
that the monitor be turned OFF when not in use
and that the computer be allowed to run at full
power during an experiment.
2.8 LCD
D
ISPLAY ON THE
FX5K™
C
OMPRESSION
F
LEX
L
INK
®
The front of the FX5K
™
Compression
FlexLink
®
box has an LCD graphic display.
When the FX5K
™
Compression FlexLink
®
is turned ON, the LCD will display the
FlexLink
®
number (i.e., #1, #2, #3, or #4)
and the regimen status (i.e., Idle, Ready, or
Left (the time remaining, in minutes, of a
running regimen). When a regimen has been

FLEXCELL®INTERNATIONAL CORPORATION
8
downloaded and/or is running, the LCD will
also display the user name, platform, and
regimen name. See Table 1, below, for the
display messages with various FlexLink
®
statuses.
Table 1. Messages displayed on the FX5K
™
Compression FlexLink
®
LCD.
FlexLink Status LCD message
Power ON #1 Regimen: IDLE
Flexcell International Corp.
www.flexcellint.co
m
Regimen
downloaded
#1 Regimen: READY
User name
Platform
Regimen Name
Flexcell International Corp.
www.flexcellint.co
m
Regimen is
running
or being
simulated
#1 Regimen: LEFT 5 min
User name
Platform
Regimen Name
Flexcell International Corp.
www.flexcellint.co
m
Regimen has
stopped
#1 Regimen: IDLE
User name
Platform
Regimen Name
Flexcell International Corp.
www.flexcellint.co
m
2.9 U
SING
A
DDITIONAL
F
LEX
L
INKS
®
Using additional FX5K
™
Compression
FlexLinks
®
will allow two or more baseplates
(platforms) with different regimens to run
simultaneously. All tubing connections made
to the first FlexLink
®
should be made exactly
the same with any additional FlexLinks
®
.
Each FlexLink
®
will have its own separate
FLEX IN and FLEX OUT tubing for each
baseplate. However, the pressure or
SYSTEM tubing can be shared between
FlexLinks
®
with "T" fittings as long as the
pressure source is capable of running two or
more FlexLinks
®
with the programmed
regimens. Regimens with a combination of
high frequencies and force levels will
require a more powerful pressure source.
The capability of the pressure source with
more than one FlexLink
®
will need to be
tested experimentally with the particular
setup. FlexLinks
®
must be placed side-by-
side during use.
To connect additional FlexLink
®
(s) to the
computer, connect the Ethernet cable from
each FlexLink
®
to an Ethernet hub. Then,
connect the hub to the Ethernet port on the
back of the computer using the Ethernet
communications cable provided. The LCD
on the front of the FlexLink
®
will display the
number (#1-4) that the FX5K
™
Compression
FlexLink
®
has been assigned at the time of
production.
NOTE: The numbering of each FX5K
™
Compression FlexLink
®
will not depend on what
order it appears in the connection chain, but
according to the configuration of each
FlexLink
®
as "FlexLink #1, FlexLink #2…etc"
during production.
When powering up the FlexLink
®
(s) and
computer, turn the FlexLink
®
(s) ON before
the computer. To use a particular FlexLink
®
,
select the appropriate FlexLink
®
number
(#1, 2, 3, or 4) from the Controllers menu.
Assign, download, and run regimens just as
would be done when using one FlexLink
®
.

FLEXCELL®INTERNATIONAL CORPORATION
9
3. OPERATION INSTRUCTIONS
3.1 S
TARTING THE
FX-5000™
P
ROGRAM
The Flexcell
system should now be set up
and ready for operation. Be sure that the
system positive pressure supply is adequate to
operate the instrument(s) (see section 2.6).
Turn ON the power switch on the computer,
monitor and FX5K
™
Compression FlexLink
®
.
The system should then boot and load
Windows
®
. Select and double click on the FX-
5000
™
icon (Fig. 11) on the desktop to start
the FlexSoft
®
FX-5000
™
software. A main
display window will appear (see Fig. 13).
Figure 11. FX-5000
™
icon
3.2 U
SING THE
FX-5000™
T
UTORIAL
In the Help menu, click on View Tutorial to
view the FX-5000
™
tutorial at any time (Fig.
12). The tutorial will appear on the left side of
the screen. The tutorial explains the main
steps involved in configuring users, creating
regimens, and starting regimens. The tutorial
will start automatically, as a default setting,
when the software is opened. To turn OFF this
feature, uncheck the box marked “Show
Tutorial at Startup”.
3.3 M
AIN
D
ISPLAY
W
INDOW
The main display window (Fig. 13) for each
FX5K
™
Compression FlexLink
®
has several
features that allow more precise monitoring of
the regimen. To access this window, select the
appropriate FlexLink
®
(FlexLink#n) from the
Controllers menu, where “n” is the
FlexLink
®
number to which the regimen will
be downloaded. The FlexLink
®
number can
be found on the LCD screen on the front of
the FlexLink
®
controller box.
Figure 12. FX-5000
™
tutorial
Figure 13. Main display window
All of the remaining information and
command button states in the main
window display reflect the current state of
the system for the currently selected
FX5K
™
Compression FlexLink
®
.
It is possible to simultaneously assign and
run a different regimen for each of the
attached FlexLinks
®
.

FLEXCELL®INTERNATIONAL CORPORATION
10
In the upper left hand corner of the window is
a section labeled Plot Units. This function
allows users to change the units of the y-axis:
force (lbs) or kPa. To select a particular unit,
click on the appropriate button beside the unit
label.
The next block to the right is a section labeled
Smoothing. One expects data patterns to
represent normal distributions of a function
describing a straight line, sinusoidal curve,
etc. Therefore, the plotted points of a
mathematical function should be a predictable
data set that is “smooth” (i.e., a curve
comprised of points whose coordinates are
predicted by the function). For a straight line,
the equation would be y = mx + b; for a power
function, the equation may be y = x
2
or some
derivative thereof. In general, data patterns
may be confounded with noise. For the case of
the pressure plot as a function of voltage from
the FX-5000
™
Compression System pressure
transducer, the rough data yield a plot with a
coefficient of variation of only 0.01%.
Therefore, the signal to noise ratio for the
combined Flexcell
®
system of circuits,
hardware and transducers is high, lending
confidence in the displayed plot.
Nevertheless, the user can select a data
smoothing option that is a simple weighted
average of the points. The Smoothing section
contains the option of either applying no
smoothing (None) to the data points returned
from the FlexLink
®
or of applying a three-
point moving average filter (Moving
Average) to the incoming data. Choose the
desired affect by clicking on the appropriate
button.
Below the box for Smoothing is a section used
to show the current Xand Y coordinates for
the waveform. These are displayed when the
left mouse button is clicked and held down in
the graph area. When this is done, a pair of
crosshairs appears and the coordinates at the
intersection of the crosshairs are shown in the
X and Y spaces. The crosshairs and values
will track the mouse as long as the left mouse
button is held down.
The next block to the right is a section used
to display the current User, Regimen,
Platform, and Run time. Run time has two
blocks. The one on the left displays the
elapsed regimen time, and the one on the
right displays the remaining regimen time,
using the following format: dd:hh:mm:ss
(days:hours:minutes:seconds).
The block at the top right contains the
current regimen Step, Cycle, Jump (when a
regimen step is using the Jump Back to
option), minimum level (Min), and
maximum level (Max). The minimum and
maximum levels will be listed according to
the units specified under the Plot Units
section as the minimum and maximum
points at which the membrane stretches with
each cycle.
The major portion of the main display
window is taken up with a plot designed to
show the current state of a simulated or
running regimen. This plot is generated from
the data returned by the FlexLink
®
during
regimen activity. When using a platform
configuration that uses positive pressure to
generate an upward movement of the
membrane, resulting in compression, the
vertical scale represents increasing
compression/force. When the selected unit
of display is kPa, the vertical scale will start
at 0.0 and move upwards as an increasing
positive level, indicating that positive
pressure is being applied to the membrane to
compress it upwards against an immovable
barrier, the platen.
The scale on the x- and y-axes can be
changed by clicking on one of the two small
double-arrow buttons at either end of the
axis. The button with arrows pointing away

FLEXCELL®INTERNATIONAL CORPORATION
11
from each other increases the axis scale, while
the button with arrows pointing toward each
other decreases the scale.
Below the plot is a timeline that displays the
percentage of the regimen that has been
completed.
To the right of the plot is a set of command
buttons which allow the user to:
1) Start a regimen.
2) Stop a regimen.
3) Pause a regimen.
4) Resume a paused regimen.
5) Simulate a regimen.
6) Reset the controller.
7) Access Help.
8) Cancel the program.
3.4 C
ONFIGURING
U
SERS
Prior to creating and downloading a regimen,
a user needs to be registered. Once this task is
completed, regimens can be personalized
under the registered user name.
In the Configure menu, select User Editor. A
new window will appear entitled Users (Fig.
14).
To add a user, type in a user name (must be at
least 4 characters) in the provided space and
click on Add User. The new name should
appear in the Existing Users box.
To delete a user, click on the appropriate user
name in the Existing Users box so that it is
highlighted in blue, then click on Delete User.
The program will ask for a confirmation and
issue a warning, click Yes to confirm deletion.
The user and any of the user's defined
regimens will be deleted.
To exit the Users window, click on Close.
Figure 14. FX-5000
™
user editor
3.5 C
REATING
R
EGIMENS
Before beginning, a regimen must be created
for downloading. In the Regimen menu,
select Create new. A new window will
appear entitled Regimens with a list of the
existing users and their regimens (Fig. 15).
In the Existing Users box, click on the user
name under which the regimen is to be
created. A list of current regimens created
under this user will appear in the Regimens
for Selected User box, unless no regimens
have been saved under this user, in which
case, this box will be empty.
Figure 15. FX-5000
™
regimen editor
To create a new regimen, click on Run
Wizard in the bottom left hand corner. This
option will bring up a step by step process of

FLEXCELL®INTERNATIONAL CORPORATION
12
creating a new regimen. Alternatively, follow
the sequence of steps below:
1) Type a regimen name in the box labeled
Regimen Name.
2) Choose the desired waveform shape under
Shape by clicking on the downward arrow
and selecting an entry from the drop-down
list.
3) Enter the desired minimum and maximum
force (in lbs) for the plate membranes (0-
15 lbf) in the boxes under Min and Max.
4) Enter the frequency for the waveform
(0.01-5 Hz) in the box under Freq.
5) If a static regimen is required, enter the
desired force at which the membrane is to
be held in the Max box. Enter 0 in the Min
box, and 1.0 in the Freq box (Min and
Freq are irrelevant for static regimens).
6) If a duty cycle for the waveform is to be
defined, enter the desired value in the box
under DC %. The duty cycle is the percent
of time that the waveform shape remains
on at the high (square wave) or rising
(triangle) part of the waveform. Duty
cycle only affects the triangle and square
waves.
7) Enter the number of times for the regimen
to repeat (0-65,535) in the box under
Cycles. When moving out this box, the
box underneath dd:hh:mm:ss will update
to the calculated regimen time according
to the set parameters. The format for this
entry is days:hours:minutes:seconds.
However, if the time is entered first, the
program will calculate the number of
cycles.
8) To make a regimen step (except for the
first step) return (jump back) to a previous
regimen step, enter the return step
number in the box under Back To. Then,
type the number of times to repeat this
process in the box under Repeat.
For instance, if the user was entering
Step 4 and wanted to return to Step 2 and
repeat Steps 2 through 4 three times,
enter 2 under Back To and 3 under
Repeat when inputting Step 4
9) When the regimen step is complete, click
on Add Step at the bottom. Every time a
new/edited step is saved, the overall
duration of the regimen will be
calculated and displayed in the box
labeled Duration next to the Step
number box. If the total duration exceeds
the maximum allowable duration, this
value will be MAXIMUM, and the
regimen cannot be saved. Adjust the
time and/or cycle number to decrease the
total duration time.
10) To add other steps to a regimen, click in
the box labeled Step and type in the next
step number.
For example, the first step will
automatically be Step 1. To add another
step, delete the 1 and replace it with a 2.
After this is completed, change the
parameters as needed for the new step
according to steps 2 to 9 above.
11) To delete a step that has already been
added, click on the step in the window
labeled Regimen Steps, which contains
the list of steps. This will cause the step
to be highlighted. Then click on Remove
Step at the bottom of the window.
Confirm the deletion by clicking on Yes
when prompted.
12) After all steps and parameters have been
entered, click on Save Regimen.

FLEXCELL®INTERNATIONAL CORPORATION
13
13) To delete a regimen, simply double-click
on the desired regimen name in the
Regimens for Selected User box, and
then click on Delete Regimen. Confirm
the deletion by clicking on Yes.
NOTE: If the regimen to be deleted is currently
assigned, the regimen must be removed from
assignment before deleting.
14) When finished with regimen editing, click
on Close.
3.6 C
REATING A
R
EGIMEN WITH A
C
USTOM
W
AVEFORM
S
HAPE
In the top row of an Excel spreadsheet, enter
the force values for the desired waveform
shape for one cycle. Enter one value per cell.
Values should be chosen along a curve at even
time intervals, i.e. every 100 msec
(milliseconds). Save this spreadsheet as a .csv
file (comma delimited file format) in the
C:/FlexSyst directory.
Example Custom waveform shape: Ramp
waveform shape
Example Excel file: Ramp waveform shape
1 1.
5
2 2.
5
3 3.
5
4 4.
5
55.
5
0
Example CSV file viewed in Notepad: Ramp
waveform shape
1,1.5,2,2.5,3,3.5,4,4.5,5,5.5,0
In the Regimen menu of the FX-5000
™
software, select Create new. A new window
will appear entitled Regimens with a list of
the existing users and their regimens. In the
Existing Users box, click on the user name
under which the regimen is to be created. A
list of current regimens created under this
user will appear in the Regimens for
Selected User box, unless no regimens have
been saved under this user in which case, this
box will be empty.
To create a new regimen, click on Run
Wizard in the bottom left hand corner. This
option will bring up a wizard to create a new
regimen. Or, follow the sequence of steps
below:
1) Choose Custom from the list of
waveform shapes under Shape by
clicking on the downward arrow and
selecting this entry from the drop-down
list.
2) Choose the appropriate file name under
File by clicking on the downward arrow
and selecting an entry from the drop-
down list
3) Type a regimen name in the box labeled
Regimen Name.
4) Enter the time interval in milliseconds
between two force values in the box
under Time.
5) Enter the number of times for the
regimen to repeat (0-65,535) in the box
under Cycles.
6) When the regimen step is complete, click
on Add Step at the bottom. Every time a
new/edited step is saved, the overall
duration of the regimen will be
0
1
2
3
4
5
6
0 100 200 300 400 500 600 700 800 900 1000
Time (msec)
% Elongation
Other manuals for FX-5000
1
Table of contents
Other flexcell Laboratory Equipment manuals
Popular Laboratory Equipment manuals by other brands
Quantum
Quantum Q9000VOIP Series Programming manual
Next Advance
Next Advance Bullet Blender 50 Operator's manual
Welch Allyn
Welch Allyn RetinaVue 700 Directions for use
VS Security Products
VS Security Products DATAGAUSS LG operating manual
Arctiko
Arctiko FLEXA LRE 120 operating instructions

AGICO
AGICO JR6 user manual
