HyQuest Solutions Pty Ltd
TBRG Calibrator TB340A © Copyright Page - 4 Issue 7 : 28 Apr, 2017
TABLE OF FIGURES
Figure 1-1 TBRG Calibrator overview...................................................................5
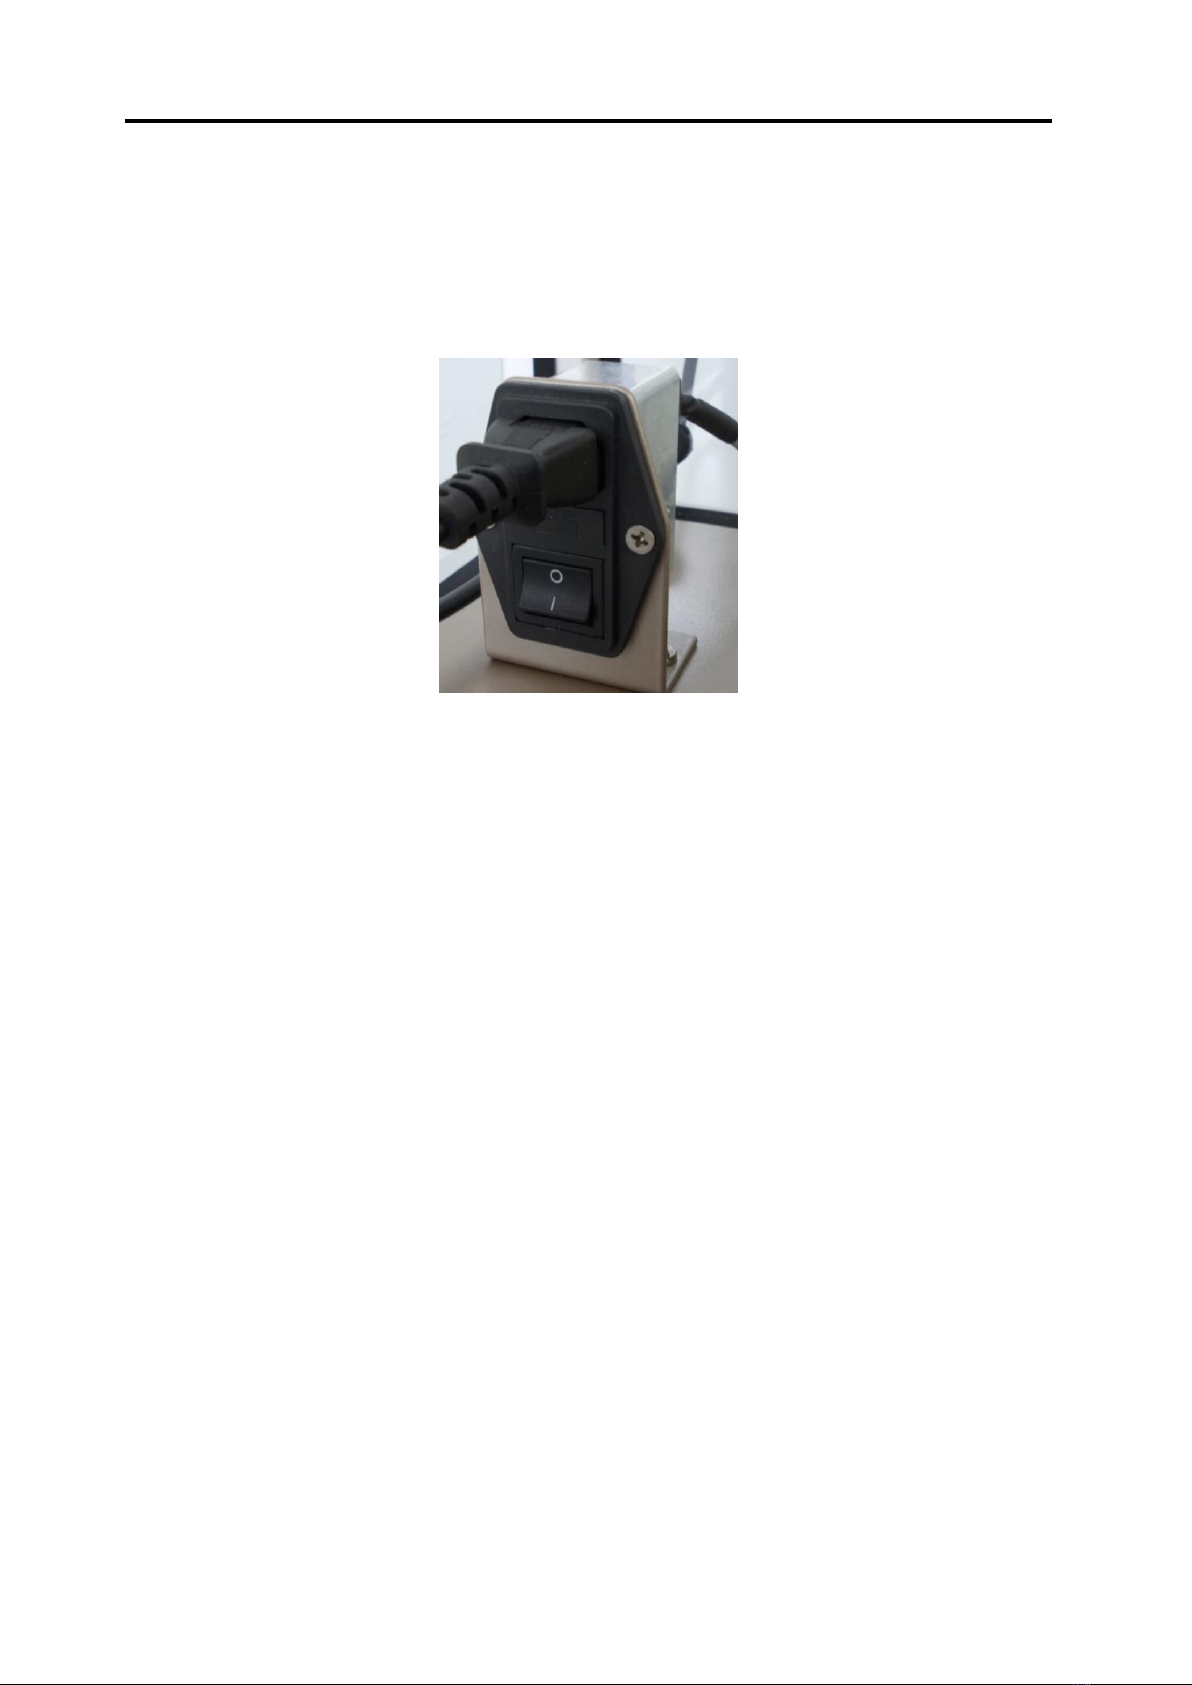
Figure 3-1 Power switch in cabinet of TBRG Calibrator ........................................... 10
Figure 3-2 Device Manager in Control Panel (Windows 7) ......................................... 11
Figure 3-3 USB to RS-485 adapter in Device Manger ............................................... 12
Figure 4-1 Reed switch connections .................................................................. 14
Figure 4-2 Test setup selection........................................................................ 15
Figure 4-3 Tipping bucket rain gauge options in test setup ....................................... 16
Figure 4-4 Test options in test setup ................................................................. 17
Figure 4-5 Nozzle setup in test setup ................................................................ 18
Figure 4-6 Test process setup in test setup ......................................................... 19
Figure 4-7 Main testing screen ........................................................................ 21
Figure 4-8 Unit list in main testing screen........................................................... 22
Figure 4-9 Unit details in main testing screen ...................................................... 23
Figure 4-10 Test overview and control in main testing screen ................................... 24
Figure 4-11 Current test in main testing screen .................................................... 25
Figure 4-12 Test history in main testing screen..................................................... 26
Figure 4-13 Reporting screen .......................................................................... 27
Figure 4-14 Unit list in reporting...................................................................... 28
Figure 4-15 Filter for unit list in reporting .......................................................... 28
Figure 4-16 Test data table in reporting ............................................................. 29
Figure 4-17 Staged test data in reporting............................................................ 30
Figure 4-18 Test details in reporting ................................................................. 32
Figure 4-19 Program options dialog................................................................... 33
Figure 4-20 Report plain text header in program options ......................................... 34
Figure 4-21 Report image header in program options.............................................. 34
Figure 4-22 Communications in program options ................................................... 35
Figure 4-23 Print and auto-print in program options............................................... 36
Figure 4-24 PDF and auto-PDF in program options ................................................. 36
Figure 4-25 Configure PLC in program Options...................................................... 37
Figure 4-26 Model management dialog ............................................................... 38
Figure 4-27 Model list in model management ....................................................... 39
Figure 4-28 Bucket list in model management ...................................................... 40
Figure 4-29 Catch size in model management ...................................................... 41
Figure 4-30 Theoretical and practical values in model management............................ 41
Figure 4-31 Tolerances in model management...................................................... 42
Figure 4-32 Adding a new tolerance in model management ...................................... 43
Figure 4-33 Editing a tolerance in model management............................................ 44
Figure 4-34 Load cell calibration dialog.............................................................. 45
Figure 4-35 Load cell calibration dialog 2 and 3 –Selecting Station and Nozzle............... 46
Figure 4-36 Load cell calibration dialog 4 and 5 –Nozzle Rate ................................... 46
Figure 4-37 Load cell calibration dialog 6 - Taring container..................................... 46
Figure 4-38 Load cell calibration dialog 7 - Container to collect water......................... 47
Figure 4-39 Load cell calibration dialog 8 and 9 - Filling and Draining .......................... 47
Figure 4-40 Load cell calibration dialog 10 –Weigh the water collected ....................... 48
Figure 4-41 Load cell calibration dialog 11 –Repeated process 5 times –then test........... 48
Figure 5-1 Switches on the relay module ............................................................ 49