Lasermet ADM-1000 User manual

Advanced Digital Meter ADM-1000
Operating Instructions
Including
PC Interface Software for the
Remote Operation of Meter (Part 2 of manual)
June 2012

2 of 49 June 2012
Issue Notes
Issue 1.5 18/06/2012
Lasermet reserves the right to change the design, modify the operation of functions,
add new features, or make any other changes at any time without prior notice.
This document is copyright. All rights reserved.
PC Interface. This feature is documented in Part 2 of this manual
The PC Interface Program extends the user interface of the meter:
The meter can be operated remotely
Waveforms can be observed in more detail and saved as images or data
Logging can be used to observe laser performance over long periods
Log files can be saved in Excel-compatible format and recalled for display
The program requires a PC running Windows XP or Windows 7, with at least 25MB
of hard disk space available. A USB port should be available. The program requires
an ADM-1000 loaded with firmware version 0.0.0.59 or later.

3 of 49 June 2012
Contents
Issue Notes.................................................................................................................2
Contents.....................................................................................................................3
Introduction.................................................................................................................5
Safety .........................................................................................................................5
ADM1000 equipment..................................................................................................6
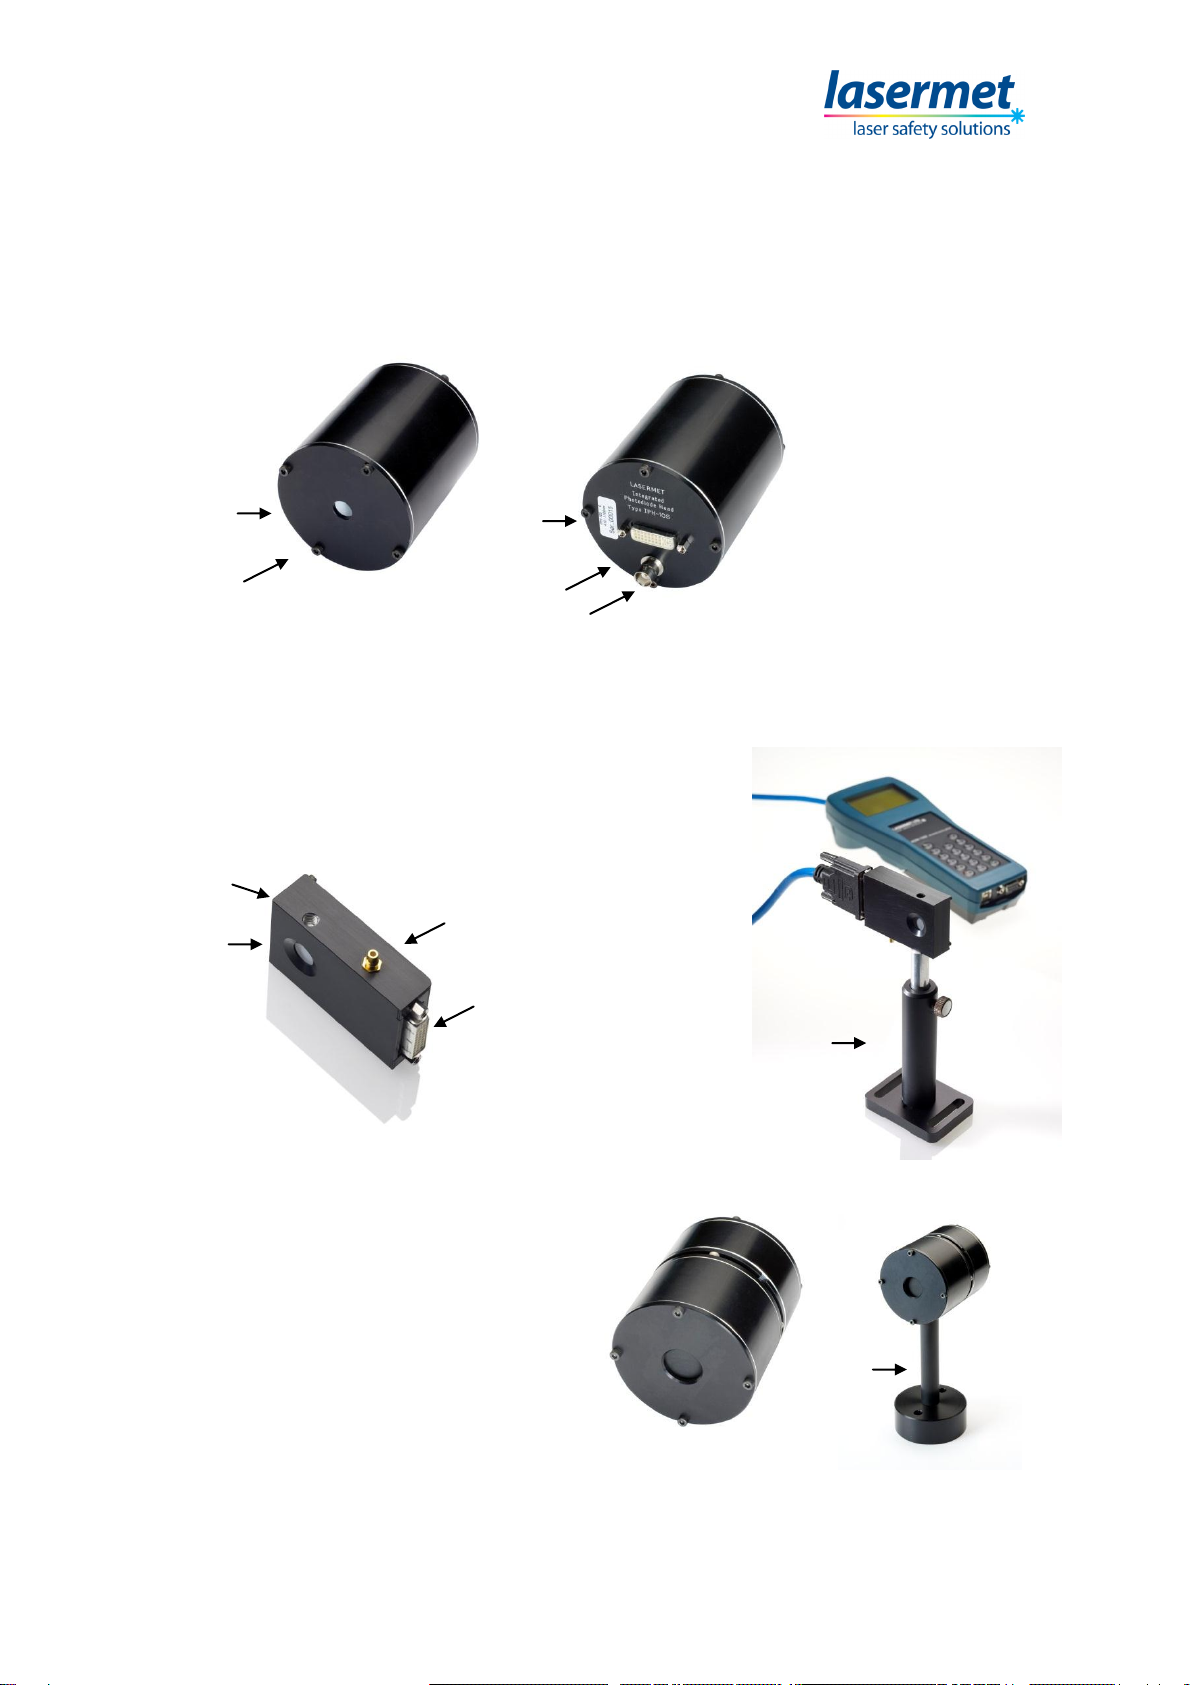
Detector Heads...........................................................................................................7
Specifications for Detector Heads .......................................................................8
Power Sources...........................................................................................................9
DC Power Supply................................................................................................9
Battery Pack......................................................................................................10
USB...................................................................................................................10
Switching On ............................................................................................................11
Display Mode Summary ...........................................................................................13
Digital Display Features........................................................................................13
Graphical Display Features...................................................................................13
Operation..................................................................................................................14
Display Mode........................................................................................................14
Range ...................................................................................................................14
Manual Range Setting ..........................................................................................14
Auto-Range...........................................................................................................15
Wavelength...........................................................................................................15
Peak/Average Measurement.................................................................................16
Setting Average and Peak Hold Periods ...........................................................16
Trend Bargraph.................................................................................................16
Zero Offset............................................................................................................17
Backlight ...............................................................................................................17
Display Contrast....................................................................................................18
Graphical Mode Functions........................................................................................19
Setting X and Y scales..........................................................................................19
Timebase (Horizontal Scale) setting .....................................................................20
Start Acquisition ................................................................................................20
Rolling Display...................................................................................................20
Y-scale (Range) setting.........................................................................................20
Bandwidth Limit.................................................................................................21
Trigger setting.......................................................................................................21
Auto Mode.........................................................................................................23
Normal Mode.....................................................................................................24
Manual Mode.....................................................................................................24
Cursor Function ....................................................................................................25
Setting the Cursors............................................................................................25
Other Functions........................................................................................................28
Detector Temperature .......................................................................................28
Head Information...............................................................................................28
Instrument Information.......................................................................................28
Specifications ...........................................................................................................29
Connecting the ADM-1000 to a P.C. ........................................................................30
Data output ...........................................................................................................32
ADM-1000 Firmware Update ................................................................................33

4 of 49 June 2012
PC Interface Program User Manual (Part 2).............................................................35
Introduction...............................................................................................................36
Installation ................................................................................................................36
Removing the program..........................................................................................37
Running the program................................................................................................37
Basic controls........................................................................................................39
Power range......................................................................................................39
Meter mode.......................................................................................................39
Zeroing the meter..................................................................................................39
Wavelength display...............................................................................................39
Capturing a log file....................................................................................................40
Viewing a log file.......................................................................................................41
Using Excel...........................................................................................................41
Using the internal viewer.......................................................................................42
Graphical (waveform) display...................................................................................43
Cursor measurements...........................................................................................44
Screen appearance...............................................................................................45
Saving a waveform...................................................................................................45
Saving a waveform as an image...........................................................................45
Saving a waveform as data...................................................................................47
Reading the ADM-1000 firmware version.................................................................48
Note on USB time-outs.............................................................................................48
Trademarks ..............................................................................................................48

5 of 49 June 2012
Introduction
The ADM-1000 is an advanced hand-held or bench Digital Meter. It is used in
conjunction with one of a range of detector heads for measuring and displaying
optical power and waveforms.
The ADM-1000 may only be used with compatible Lasermet detector heads. The
range of heads available includes photodiode and thermal types covering a range of
sensitivities and wavelengths.
The input power ranges are from 1nW to 20W and the wavelength ranges are from
180 –20,000nm.
Safety
The ADM-1000, its battery pack, and mains power adaptor are intended for indoor or
occasional dry outdoor use. Do not expose this apparatus to rain, moisture or
extremes of temperature or humidity.
Do not attempt to dismantle the meter, power supply or battery pack –no user-
serviceable parts inside. Hazardous voltages are present inside the mains power
adaptor.
Use of this equipment outside its intended purpose may invalidate warranty.
Please refer to the Detector Head specification to determine which head to use.
No liability is accepted by Lasermet or its agents for any injury or damage howsoever
caused by the use or misuse of this equipment.

6 of 49 June 2012
ADM1000 equipment
The ADM1000 system comprises of the following items included with the meter
Description Part number/Order Code
ADM1000 hand held meter ADM-1000
Integral battery pack
ADM Cable Meter-Head Interface ADM-C-1.2
Mains power lead
The following optional items are selected by the user
Standard ABS carry case ADM-CA-S
(Designed for ADM1000, 2 Heads, Power Supply, Cables)
Standard Photodiode Head IPDH-10S
Compact Photodiode Head IPDH 10C
Thermal Head ITDH-100P
All of the heads have standard threads so that optical table posts can be used.
The above photo shows the ADM1000 Laser Power Meter in its carry case with two
detector heads, detector connection cable and mains power supply.

7 of 49 June 2012
Detector Heads
Standard Photodiode Head IPDH-10S (Integrating Photo Diode Head)
This is supplied complete with an integrating sphere for maximum reduction of
reflections, easy alignment and high accuracy.
Compact Photodiode Head IPDH-10C
Designed for limited spaces with no integrating sphere,
this head has a depth of only 17mm.
Thermal Head ITDH-100P
This is designed with performance and
ease of use in mind and includes:
• patented advanced speed-up circuitry
giving a response time of 20 ms
• patented advanced integrated
temperature stabilisation circuitry to
reduce drift & thermal interference
Patent numbers
(Peltier Temperature Compensation UK Patent number 2447294, European Patent
Number 08250712.0 and ADI Head Interface Patent Number 09250671.6).
Integrating
sphere within
unit
Laser light
aperture.
Analogue output socket to
connect to oscilloscope etc.
An adapter cable is available
to connect using a BNC
Connector
Connector
to meter
Laser light
aperture.
M6 Screw
thread for
stand
Head mounted
on typical post
ITDH on
typical
mounting
stand
Serial No.
Connector
to meter
Analogue output coax socket
to connect to oscilloscope,
datalogger etc

8 of 49 June 2012
Specifications for Detector Heads
Integrating Sphere Thermal Head Compact Photodiode
Photodiode Head Head
Part No. IPDH-10S ITDH-100P IPDH-10C
Wavelength Range (nm) 400 –1100 180 –20,000 400 - 1100
Detector Type Si Peltier Si
Response Time
(E-folding) 700 ns 20 ms 700 ns
Max Input Power 1 W 20 W 10 mW
Min Input Power 0.1 μW 1 mW 1 nW
for Useable Reading
Dimensions (mm) 76 ∅x 86.5 (d) 76 ∅x 86.5 (d) 64 x 41 x 17
Aperture Diameter (mm) 11 20 10
All Lasermet detector heads have an M6 thread in order mount them on standard
posts on an optical table. For posts using ¼” UNC thread an optional adaptor can be
ordered.
Warning
You must select the appropriate head for the laser you are measuring. The
specification of the laser or markings on the laser machine should indicate the laser
power.
If the heads are subjected to laser power exceeding the above figures, the meter will
show “Over Range” on the display and heads may become damaged or go out of
calibration depending on the amount of excess power they are subjected to.
Potential damage is also dependent on power density.
IPDH-10S
For the Integrating Sphere Photo Diode head a maximum input power density of 1W
per mm beam diameter is the limit. This head is very robust.
ITDH-100P
For the Thermal head a maximum input power density of 4W per mm beam diameter
is the limit.
IPDH-10C
For the Compact Photodiode head a maximum input power density of 1mW per mm
beam diameter is the limit.
See also the Detector Temperature section of this manual

9 of 49 June 2012
Power Sources
The ADM-1000 may be powered from
either a detachable rechargeable
battery pack, a Mains-DC power
supply or from a P.C. through a USB
connection.
The options are shown in the diagram
opposite and described below.
DC Power Supply
A DC power supply is included with the ADM-1000. The lead is connected to the
6VDC IN socket on the end of the ADM-1000, the power supply is then plugged into
the mains. The ADM-1000 will operate from the power supply regardless of whether
the battery pack is fitted or not.
The use of unapproved power sources should be avoided to prevent damage to the
unit.
If the battery pack is fitted to the ADM-1000, the power supply will charge the battery
as well as operate the ADM-1000.

10 of 49 June 2012
Battery Pack
The supplied NiMH battery pack fits to the rear of the unit. It is released by pressing
the tab at the back, and slid off.
The battery pack may be charged when it is attached to the ADM-1000 by plugging
in the DC power supply into the 6VDC IN socket on the ADM-1000. So long as the
power supply is connected and operating, the battery is charged even if the ADM-
1000 is switched off via its keypad.
It typically takes 12 hours to fully charge the battery. To maximise the life of the
battery pack, avoid charging it for more than 24 hours.
New battery packs may only have a small amount of charge in them and will require
charging before use. Note that new battery packs or packs which haven’t been used
for a long time will require several charge/discharge cycles before they reach full
capacity.
The ADM-1000 will typically run for 5 hours or more on a good, fully charged battery
pack. A longer operating time will be achieved if the backlight is used less. When the
battery is low, a flashing ‘Low Battery’ symbol appears in the top right corner of the
display, see Diagram 2.
Additional battery packs are available from Lasermet.
USB
The ADM-1000 will operate from the power available from a USB port. Refer to the
section ‘PC Installation’. Note that in this mode the battery is not charged.

11 of 49 June 2012
Switching On
Connect the ADM-1000 to a suitable Lasermet detector head using the supplied
lead.
To turn the unit on, press and hold the
‘I’ button at the top of the keypad (refer
to the keypad layout diagram 1 below)
for 1 second until the unit beeps.
The meter will set itself to the last used
settings depending on the connected
head.
If no head is connected, the message
‘No Head’ flashes on the display and
the meter should be turned off before
attaching a head.
If powering the unit from a P.C. using a USB port, the unit will turn itself on as
soon as the P.C. enables the USB port.
To turn the unit off, press and hold the ‘O’ button at the top of the keypad until
the unit turns off.
If the ADM-1000 is connected to a USB port, turn it off by pressing the ‘O’
button until the progress bar fills up (this ensures the settings are saved),
then unplug the USB lead to turn the unit off.

12 of 49 June 2012
Diagram 1
OI
79
4 5 6
12 3
0ACQ
8
Power Off Power On
Backlight
Menu
Display Mode
Enter
Undo
Keypad Layout

13 of 49 June 2012
Display Mode Summary
The ADM-1000 can operate in digital (numerical) or graphical (waveform)
display mode.
Digital Display Features
Manual or auto ranging numerical display.
This display shows the measured value in numerals with units.
A bargraph trend indicator beneath the digits shows the current value relative
to the full scale on the selected range.
Depending on the head type, other information may be displayed such as
wavelength and detector temperature.
Diagram 2: Digital Display
Graphical Display Features
Dot matrix graphical display of actual value over time with indications of X
(time) and Y (magnitude) scales.
User operable cursors may be turned on to make measurements on the
waveform.
In either mode, pressing the Menu button (see the keypad diagram) will result
in a list of options being displayed, the user being able to select one as
desired.

14 of 49 June 2012
Operation
Refer to the keypad diagram 1 to identify the keys.
Connect the ADM-1000 to the head using the supplied cable, and switch the
unit on by holding the ‘I’ button at the top of the keypad until the unit beeps.
The unit sets itself to the last used settings.
If a photodiode head is connected, the wavelength of incident radiation will
need to be entered to get the correct reading. See the section ‘Wavelength’
below.
Display Mode
To switch between digital and graphical display modes, press the Display
Mode button (see diagram 1). The last used range settings are used in
each mode.
Range
In the digital display mode, the full-scale range can be set manually or
automatically (auto-range).
The auto-range function is not available in the waveform display mode.
Manual Range Setting
If the word ‘AUTO’ is shown at the bottom right corner of the display, this
indicates that the meter is in auto-range mode. Press the ‘5’ key to remove
the ‘AUTO’ indication and enable manual range setting.
To set the full scale range, press the down arrow (2) to increase sensitivity or
up arrow (8) to reduce it.
Alternatively press Menu, scroll down to Range using the up arrow (8) or
down arrow (2) buttons, press (Enter), scroll down the list and press to
select the desired range or Undo (X) to revert to the original display.
Note that the range setting on the digital display is independent of the range
set on the graphical display, and more ranges may be available on the
graphical display.

15 of 49 June 2012
Auto-Range
The ADM-1000 has an auto-range capability in the digital display mode. In
this mode, the meter will automatically switch to a higher (less sensitive)
range when the measurement exceeds the present range.
Similarly the meter will switch to a more sensitive range when the
measurement is less than about 9% of full scale.
To turn on the auto-range function, press the ‘5’ button. The word ‘Auto’
appears at the bottom right corner of the display. Alternatively, auto mode
may be selected through the menus. Press Menu, scroll down to Range,
press , select ‘Auto’ and press .
To turn off the auto-range function, press the ‘5’ button again. The ‘Auto’
indication is removed from the display and the range can now be selected
manually using the up and down arrow keys. To turn off the auto-ranging
function using the menus, press Menu, scroll down to Range, press , scroll
down to select the desired range and press .
The ‘Auto’ indication will flash if an attempt is made to manually change the
range while in auto-range mode.
Note that auto-range facility is not available in the graphical display mode.
Wavelength
Photodiode heads do not have a linear response and the wavelength of the
incident radiation must be entered by the operator for meaningful
measurements to be made. The wavelength response of each detector head
is stored in the head at calibration and the correction factor is automatically
applied once the wavelength has been entered.
To enter the wavelength of incident radiation, press Menu, scroll to
Wavelength using the up arrow (8) or down arrow (2) buttons, press and
use the numeric keypad to type in the wavelength in nanometres (nm). The
entered value must be within the displayed range.
Press when done. Press Xinstead of and the data entry is removed
ready for re-entry. Press Xagain and the display reverts to the main display
with the previous value being retained.
Note that for thermal detector heads the wavelength is not required to be
known and this menu option is not available.

16 of 49 June 2012
Peak/Average Measurement
There are two types of measurement mode that can be selected for the digital
display- Average or Peak.
In average measurement mode, the measured signal is averaged over a
period set by the user and will give a useful average (mean) value for steady
(CW) sources or pulse periods which are less than the user-set average time
period.
In peak measurement mode, the user sets a peak hold period and the display
indicates the maximum value that was reached in each period. Peak mode
will capture and display even very fast or short-duration peaks depending on
the type of head connected.
To switch between peak and average measurement in the digital display
mode, press menu, scroll to Measure Mode using the up arrow (8) or down
arrow (2) buttons, press , scroll down the list to select Average or Peak
and press .
The selected mode is shown as ‘Av’ or ‘Pk’ on the display, see diagram 2.
In waveform display mode, the actual instantaneous level is displayed and
there is no option to set peak or average mode.
Setting Average and Peak Hold Periods
For more accurate mean measurements a longer average period is
recommended. A short average period will result in a less accurate value but
with a faster response time. To set the Average Period, press Menu and
scroll to Measurement Mode. Select Average Period. The current Average
Period is displayed. Use the Up/Down arrow buttons to choose the desired
average period over the range 0.25 –10 seconds.
In Peak Measurement mode, the user can select the time period over which
the peak is measured. For example, if the peak hold period is set to 1 second,
the display will show the maximum value that is recorded in every 1 second
period. To set the Peak Hold Period, press Menu and scroll to Measurement
Mode, press . Select Peak Hold Period and press . The current setting
is displayed. Use the Up/Down arrow buttons to select the desired Peak Hold
Period in the range 0.25 –10 seconds.
Trend Bargraph
There is a fast-responding trend bargraph under the numerical value which is
useful for laser tuning or alignment purposes. The bargraph always responds
instantaneously and is not affected by averaging or peak hold functions.

17 of 49 June 2012
Zero Offset
For accurate measurements it may be necessary to set the point at which
zero light is displayed. This is achieved by blocking off all light to the detector
and then zeroing the meter.
To set the zero point, press the menu button, scroll down to Zero, press .
The options Set and Clear are presented. Ensure that the detector optical
input port is totally blocked by an opaque object which is at room
temperature, or all light is prevented from entering the detector by some
means. To avoid damage or injury ensure any powerful optical source is
switched off. Do not use a finger as some detectors will detect the infra-red
from the finger.
When ready, select Set and press . The zero value on the meter is now
set to the level corresponding to darkness.
The display then returns to the main display and the obstruction at the
detector port can be removed. All displayed values will be relative to the value
set when the detector input was obscured.
To restore the zero value that was set at the last calibration, press the menu
button, scroll down to Zero, press . Select the Clear option and press .
The zero facility may be used to make relative (offset) measurements. This
might be useful for example where a steady background or reference light
level exists and it is desired to measure any increase above the background.
In this instance the zero value is set with the desired reference/background
light present at the detector. Note however that the meter does not give
negative values and light levels lower than the set reference level are shown
as 0.00.
Backlight
To turn the backlight on or off, press the backlight button (refer to the
keypad diagram 1).
To set the backlight brightness, press menu, scroll down to Display, press
. Backlight is already selected, so press . The message ‘Backlight on’
and the current brightness percentage appears. Use the up arrow (8) and
down arrow(2) buttons to adjust the brightness from 10% (dim) to 100%
(bright). Press when done. The display returns to the main display.
Note that if running the unit from the battery pack, the battery life will be
reduced depending on how much the backlight is used and how brightly it is
set.

18 of 49 June 2012
Display Contrast
To set the display contrast, press Menu, scroll down to Display, press .
Scroll down to Contrast, press . The current contrast level is displayed.
Use the up/down buttons to change the contrast over the range 0 - 30 for best
viewing. Press when done. The display returns to main display.

19 of 49 June 2012
Graphical Mode Functions
The ADM-1000 has a sophisticated graphical display mode which can show
the variation of the measured value with time. Various trigger modes allow the
capturing of difficult waveforms, and comprehensive cursor functions allow for
calculation of parameters such as time, power, frequency and energy.
An advanced pulse-capture technique ensures that the narrowest pulses are
displayed right down to the slowest timebases to allow the measurement of
pulse repetition frequency and period.
To switch to Graphical Mode press the display mode button . In graphical
display mode there are two modes which enable quick selection of the most
commonly used commands. The mode is indicated by the label ‘Rng’ or ‘Trg’
in the bottom right corner of the display, and the mode can be switched
between the two by pressing the ‘5’ button. The ‘Rng’ mode allows quick
selection of the operating ranges, the ‘Trg’ mode allows quick adjustment of
the trigger settings.
Diagram 3: Graphical Display
Setting X and Y scales
Using the ‘5’ key, ensure that ‘Rng’ is shown in the bottom right corner of the
display as shown in Diagram 3.

20 of 49 June 2012
Timebase (Horizontal Scale) setting
Press the left arrow (4) button to reduce the timebase speed. Press the right
arrow button (6) to increase the timebase speed.
The timebase can also be set by pressing Menu, scrolling down to X Scale
and pressing to select, then choosing the desired timebase setting.
The available timebases are dictated by the type of head connected.
The chosen setting is displayed on the screen and represents the time
between each division on the horizontal axis.
Start Acquisition
To stop and start the acquisition, press the ACQ (0) button. When the
acquisition is stopped, cursors are provided which can be moved to perform
various calculations on the displayed waveform, see Cursor Function.
Rolling Display
At slow timebases (<500ms/div) the trace will travel across the display until it
reaches the right hand side, whereupon the waveform will start scrolling to
the left as new data is added to the right (Stripchart mode). Press the Acquire
button (0) to manually start/stop the stripchart display.
Y-scale (Range) setting
Press the down arrow (2) button to increase the sensitivity (make the
waveform taller). Press the up arrow (8) button to decrease the sensitivity.
The Y-Scale can also be set by pressing Menu, scrolling down to Y Scale and
pressing to select, then choosing the desired sensitivity.
The chosen setting is displayed on the screen and represents the magnitude
per division on the vertical axis.
The available ranges are dictated by the type of head connected.
Table of contents
Other Lasermet Measuring Instrument manuals