Lauterbach TRACE32-ICD User manual

MANUAL
Release 02.2022
StarCore Debugger and Trace

StarCore Debugger and Trace | 2
©1989-2022 Lauterbach
StarCore Debugger and Trace
TRACE32 Online Help
TRACE32 Directory
TRACE32 Index
TRACE32 Documents ......................................................................................................................
ICD In-Circuit Debugger ................................................................................................................
Processor Architecture Manuals ..............................................................................................
StarCore ...................................................................................................................................
StarCore Debugger and Trace ............................................................................................ 1
Introduction ....................................................................................................................... 6
Brief Overview of Documents for New Users 6
Warning .............................................................................................................................. 7
Quick Start ......................................................................................................................... 8
Troubleshooting ................................................................................................................ 11
SYStem.Up Errors 11
Memory Access Errors 12
NEXUS Flow Errors and FIFO Overflow Messages 13
FAQ ..................................................................................................................................... 14
Configuration ..................................................................................................................... 15
CPU specific SYStem Settings and Restrictions ........................................................... 16
SYStem.CLOCK Setup core clock 16
SYStem.CONFIG.state Display target configuration 16
SYStem.CONFIG Configure debugger according to target topology 17
Daisy-Chain Example 19
TapStates 20
SYStem.CONFIG.CORE Assign core to TRACE32 instance 21
SYStem.CPU Select the used CPU 22
SYStem.LOCK Lock and tristate the debug port 22
SYStem.MemAccess Real-time memory access (non-intrusive) 22
SYStem.Mode Establish the communication with the target 24
SYStem.Option.BASE Sets the SUI base address 24
SYStem.Option.DCFLUSH Data cache flush before step/run 25
SYStem.Option.DTM Enables data trace messages 25
SYStem.Option.EnReset Allow the debugger to drive nRESET/nSRST 25
SYStem.Option.EnTrst Allow debugger to drive TRST 26
SYStem.Option.HalfRate Enable Nexus DDR mode 26

StarCore Debugger and Trace | 3
©1989-2022 Lauterbach
SYStem.Option.ICFLUSH Instruction cache flush before step/run 27
SYStem.Option.IMASKASM Disable interrupts while single stepping 27
SYStem.Option.IMASKHLL Disable interrupts while HLL single stepping 27
SYStem.Option.IPLDI Sets interrupt mask strategy 28
SYStem.Option.LittleEnd Switches between endian modes 28
SYStem.Option.MCKO Nexus output clock ratio 28
SYStem.Option.MPU MPU disabled 29
SYStem.Option.Nexus Nexus port width 29
SYStem.Option.OCEBASE Base address for OnCE registers 29
SYStem.Option.OCECORE OnCE selection 30
SYStem.Option.OVC Trace message overrun control 30
SYStem.Option.PTM Enables program trace messages 30
SYStem.Option.SAMPLE Adjust NEXUS sample point 31
SYStem.Option.SLOWPOLL Change timing of JTAG during runtime 31
SYStem.Option.SLOWRESET Expand reset time for additional reset module 31
SYStem.Option.VBA Set up VBA value for analysis 32
SYStem.Option.WaitReset Halt the core after reset 33
SYStem.Option.WATCHDOG Enable WATCHDOG 34
SYStem.JtagClock Define JTAG clock 34
CPU specific MMU Commands ........................................................................................ 38
MMU.DUMP Page wise display of MMU translation table 38
MMU.List Compact display of MMU translation table 38
MMU.SCAN Load MMU table from CPU 39
BenchMarkCounter ........................................................................................................... 40
TrOnchip ............................................................................................................................ 41
TrOnchip Control of on-chip resources 44
TrOnchip.CONVert Automatically convert range to single address 45
TrOnchip.REGister Shows custom on-chip trigger registers 45
TrOnchip.RESet Set on-chip trigger to default state 45
TrOnchip.VarCONVert Automatically convert range to single address 45
TrOnchip.state Opens configure panel 46
On-chip Trace .................................................................................................................... 47
Onchip.Mode Select mode to control trace buffer and contents 47
Onchip.VTBA Set the destination address of the onchip trace 48
General Restrictions ......................................................................................................... 49
Floating Point Formats ..................................................................................................... 50
Integer Access Keywords ................................................................................................. 50
File I/O Support .................................................................................................................. 51
Metrowerks MSLIO Support 51
JTAG Connection .............................................................................................................. 52

StarCore Debugger and Trace | 4
©1989-2022 Lauterbach
Mechanical Description of the 20-pin Debug Cable 52
Electrical Description of the 20-pin Debug Cable 53
JTAG Connector 14-pin 54
Memory Classes ................................................................................................................ 56
StarCore Debugger and Trace | 5
©1989-2022 Lauterbach
StarCore Debugger and Trace
Version 09-Mar-2022

StarCore Debugger and Trace | 6
©1989-2022 Lauterbach
Introduction
This document describes the processor specific settings and features for TRACE32-ICD for the following
CPU families:
• MSC8XXX, MSC711X, MXC91XXX from FreeScale
• TC1XXX, TC2XXX from StarCoreLLC
• SC1000, SC2000, SC3000 (Custom Chips with unknown peripherals)
Please keep in mind that only the Processor Architecture Manual (the document you are reading at the
moment) is CPU specific, while all other parts of the online help are generic for all CPUs supported by
Lauterbach. So if there are questions related to the CPU, the Processor Architecture Manual should be your
first choice.
If some of the described functions, options, signals or connections in this Processor Architecture Manual are
only valid for a single CPU or for specific families, the name(s) of the family(ies) is added in brackets.
Brief Overview of Documents for New Users
Architecture-independent information:
•“Training - Debugger Basics” (training_debugger.pdf): Get familiar with the basic features of a
TRACE32 debugger.
•“T32Start” (app_t32start.pdf): T32Start assists you in starting TRACE32 PowerView instances
for different configurations of the debugger. T32Start is only available for Windows.
•“General Commands” (general_ref_<x>.pdf): Alphabetic list of debug commands.
Architecture-specific information:
•“Processor Architecture Manuals”: These manuals describe commands that are specific for the
processor architecture supported by your Debug Cable. To access the manual for your processor
architecture, proceed as follows:
- Choose Help menu > Processor Architecture Manual.
•“OS Awareness Manuals” (rtos_<os>.pdf): TRACE32 PowerView can be extended for operating
system-aware debugging. The appropriate OS Awareness manual informs you how to enable the
OS-aware debugging.

StarCore Debugger and Trace | 7
©1989-2022 Lauterbach
Warning
WARNING: To prevent debugger and target from damage it is recommended to connect or
disconnect the Debug Cable only while the target power is OFF.
Recommendation for the software start:
1. Disconnect the Debug Cable from the target while the target power is
off.
2. Connect the host system, the TRACE32 hardware and the Debug
Cable.
3. Power ON the TRACE32 hardware.
4. Start the TRACE32 software to load the debugger firmware.
5. Connect the Debug Cable to the target.
6. Switch the target power ON.
7. Configure your debugger e.g. via a start-up script.
Power down:
1. Switch off the target power.
2. Disconnect the Debug Cable from the target.
3. Close the TRACE32 software.
4. Power OFF the TRACE32 hardware.

StarCore Debugger and Trace | 8
©1989-2022 Lauterbach
Quick Start
Starting up the debugger is done as follows:
1. Select the device prompt for the ICD Debugger and reset the system.
The device prompt B:: is normally already selected in the TRACE32 command line. If this is not the
case, enter B:: to set the correct device prompt. The RESet command is only necessary if you do
not start directly after booting the TRACE32 development tool.
2. Specify the CPU specific settings.
The default values of all other options are set in such a way that it should be possible to work without
modification. Please consider that this is probably not the best configuration for your target.
3. Set up data for electrical interface
Normally the default value is 1.0 MHz, but the it can be increased up to 80.0 MHz.
b::
RESet
SYStem.CPU <cpu_type>
SYStem.JtagClock <frequency>
SYStem.Option.EnReset
SYStem.Option.EnTrst
SYStem.Option.WaitReset

StarCore Debugger and Trace | 9
©1989-2022 Lauterbach
4. Inform the debugger about read only and none-readable address ranges (ROM, FLASH).
The B(reak)on-chip information is necessary to decide where on-chip breakpoints must be used. On-
chip breakpoints are necessary to set program breakpoints to FLASH/ROM. The sections of FLASH
and ROM depend on the specific CPU and its chip selects. Accesses to invalid addresses can cause
unrecoverable bus errors. To avoid bus errors from the debugger side use the subcommands of MAP
to define inaccessible memory areas. Bus errors can be removed by executing SYStem.Up. Make
sure that there isn’t any TRACE32 window open which accesses to a inaccessible memory that is not
masked out, otherwise the bus error can occur again.
5. Enter debug mode.
This command resets the CPU and enters debug mode. After this command is executed, it is possible
to access memory and registers.
6. Configure chip according application.
Before loading binary data into the processor memory, the memory should be made writable for the
debugger. Therefore processor configuration registers have to be set e.g. chip select register.
7. Load the program.
The format of the Data.LOAD command depends on the file format generated by the compiler. It is
recommended to use the option /Verify that verifies all written data. This test discovers a problem with
the electrical connection, wrong chip configurations or linker command file settings.
A detailed description of the Data.LOAD command and all available options is given in the “General
Commands Reference”.
MAP.DenyAccess
MAP.NoDenyAccess <range>
MAP.BOnchip <range>
SYStem.Up
Data.LOAD.Elf program.elf /Verify ; ELF specifies the format,
; program.elf is the file name

StarCore Debugger and Trace | 10
©1989-2022 Lauterbach
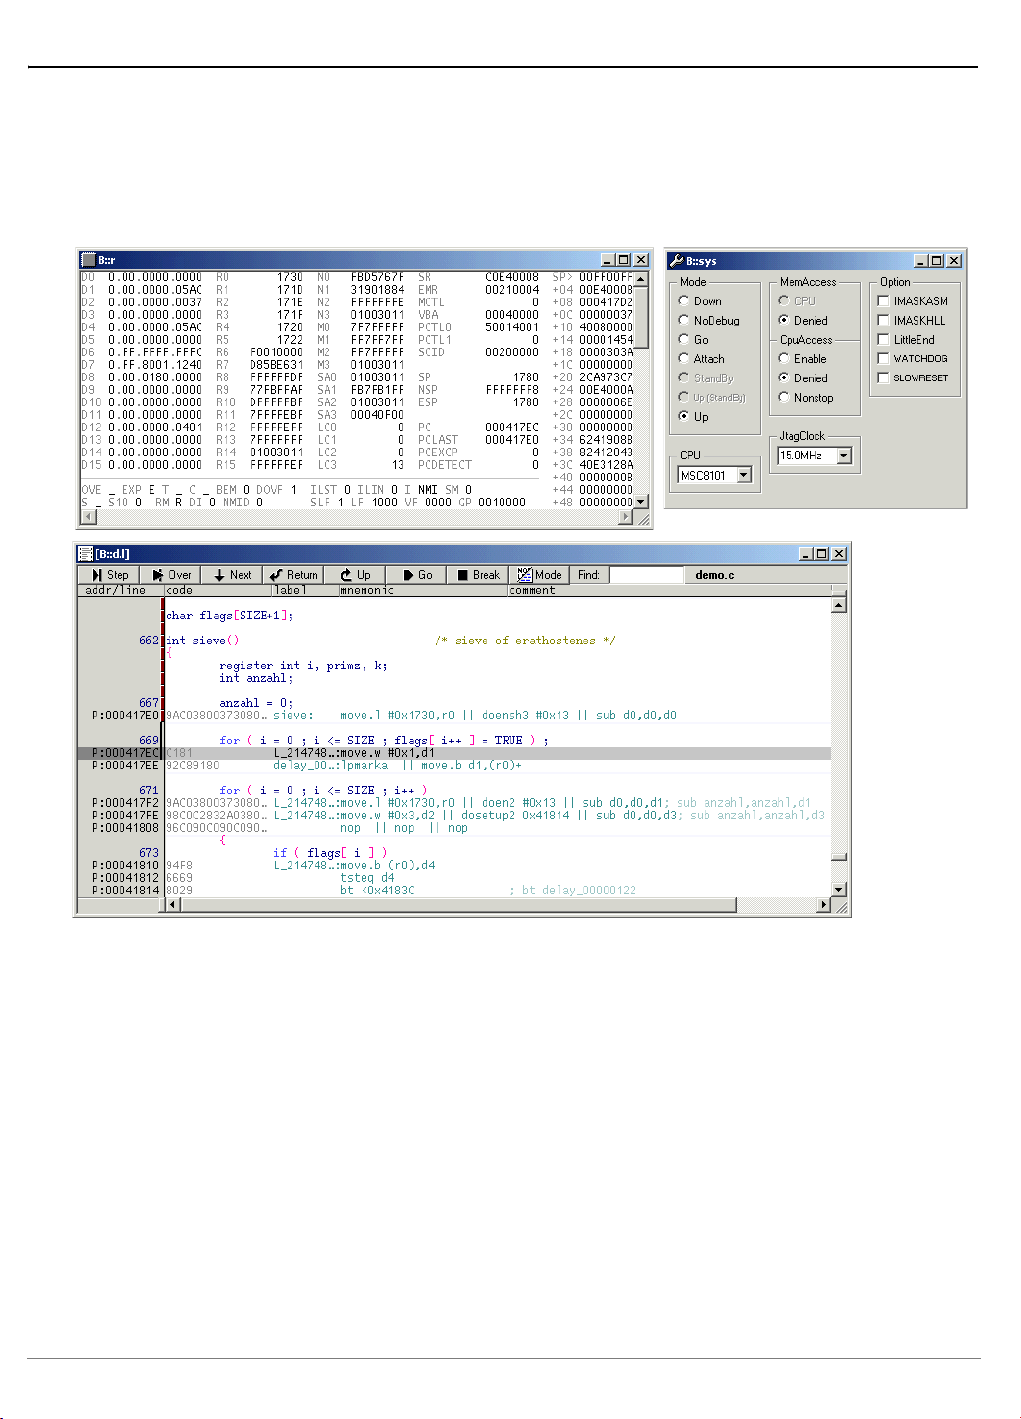
A typical start sequence for the MSC8101 is shown below. This sequence can be written to a PRACTICE
script file (*.cmm, ASCII format) and executed with the command DO <file>. Other sequences can be found
in the ~~/demo/ directory.
b:: ; Select the ICD device prompt
WinClear ; Clear all windows
SYS.CPU MSC8101 ; Select CPU
SYS.JC 15000000. ; Choose JTAG frequency
SYStem.Up ; Reset the target and enter debug mode
MAP.DENYACCESS ; Forbid any access to the memory in
; general
MAP.NODENYACCESS 0x00000000--0x0007FFFF
MAP.NODENYACCESS 0x00000000--
0x0007FFFF ;SRAM 515KB
; SRAM 515KB
; Allows access to a memory area
MAP.NODENYACCESS 0x00EFFE00--
0x00EFFEFF ;EOnce
; Allows access to a memory area
MAP.NODENYACCESS 0x00F80000--
0x00F807FF ;ROM
; Allows access to a memory area
MAP.NODENYACCESS
IOBASE()++13FFF; 60x BUS
; Allows access to a memory area.
; IOBASE() is the base address of the
; internal memory space. It is derived
; from the EMR register bits 21-19.
MAP.BONCHIP 0x00F80000--
0x00F807FF ;ROM
; Specifies the program memory where
; on-chip breakpoints must be used.
Data.LOAD.ELF demo_be.eld
/VERFY
; Load the application, verify the
; process
Go main ; Run and break at main()
List.Mix ; Open source window
Register.view /SpotLight ; Open register window
Var.Local ; Open window with local variables

StarCore Debugger and Trace | 11
©1989-2022 Lauterbach
Troubleshooting
SYStem.Up Errors
The SYStem.Up command is the first command of a debug session where communication with the target is
required. If you receive error messages while executing this command open the AREA window by the
command “AREA”. This will show some further information. There are different type problem that may occur:
Basic electrical problems with the JTAG interface
• The target has no power.
• The JTAG lines are not connected correctly.
• The pull-up resistor between the JTAG[VCCS] pin and the target VCC is too large.
• There are additional loads or capacities on the JTAG lines.
• There is logic added to the JTAG state machine:
By default the debugger supports only one processor in one JTAG chain. If the processor is only
one member of a JTAG chain the debugger has to be informed about the target JTAG chain
configuration. Use the SYS.CONFIG to specify the position of the device in the JTAG-chain.
• The target is in reset:
The debugger controls the processor reset and use the RESET line to reset the CPU on every
SYStem.Up. Therefore no external R-C combination or external reset controller is allowed.
• /TRST is connected with /RESET. If this is the case try System.Option.WaitReset <time>
• The TDO and/or RTCK line is not active while /RESET. System.Option.WaitReset <time>
provides a workaround for this, but there can be unpredictable problems after using the option.
Advanced problems
• The wrong CPU is selected or the multicore settings are wrong.
• The clock of the onchip-peripheral is not running or the core has no clock.
• The JTAG frequency is too high or no RTCK is available.
• The external bus is not released by the bus master. In this case it is possible to execute a
SYStem.Mode.Attach command to attach to the core and wait until the bus becomes ready.

StarCore Debugger and Trace | 12
©1989-2022 Lauterbach
Multi-Core configuration problems
• The most important option is SYStem.CONFIG.Slave. One debugger is the Master which must
set SYStem.CONFIG.Slave to OFF. All Slaves must set this option to ON. To bring the system up,
the Master needs to execute the command SYStem.Mode.Up first then the all slaves. Only the
Master will assert the /RESET line and initialize the JTAG interface which is necessary for all
further communication.
• If multiple debug boxes are used with the help of a JTAG-Join adaptor, consider the option
SYStem.CONFIG.TriState (must be ON) and SYStem.CONFIG.TCKLEVEL (must be set to level
of TCK line).
• The JTAG chain settings IRPRE, IRPOST, DRPRE and DRPOST must be set correctly according
to the core position within the JTAG chain.
AREA Diagnostics
• Open the AREA window and type “DIAG 0x16001” to see which JTAG devices are in the JTAG
chain. If this JTAG chain analysis works fine, it can be assumed that the electrical conditions are
correct and the JTAG tap controllers are working.
• By “DIAG 0x10008” the multicore configuration is show in the AREA window
Memory Access Errors
After system up is completed successfully, data can be written to or read from memory. Trying to access
memory not belonging to the memory map of the processor will be refused with the error message
and
When a unrecoverable bus error occurs the target processor has to be reset.
no memory mapped at address D:XXXXXXXX
bus error generated by CPU

StarCore Debugger and Trace | 13
©1989-2022 Lauterbach
NEXUS Flow Errors and FIFO Overflow Messages
Flow Errors
• Flow Errors can be internal processing errors of the TRACE32 software. The analysis of the
NEXUS message is not clear in some rare situations. If Flow Errors occur the LAUTERBACH
support has to be contacted in order to fine tune to software to detect this situations.
• Flow Errors can occur if the recorded data is damaged. Various reasons can lead to that
problem. Most probably there are electrical problems with the probe or target. The probe can be
fine tuned by the commands SYStem.Option.MCKO, SYStem.Option.HalfRate, SYStem.CLOCK
and SYStem.Option.Sample to adjust the timing and bandwidth of the NEXUS signals as well as
Trace .THreshold to adjust the signal level detection. The target can be often also tuned to
produce better signals e.g. by set up the slew rate and driver strength of the pins.
• Due to the analysis uses also the disassembler and internal simulator, Flow Errors will also
occur, if the code is damaged or has changed. Using a memory class VM: based analysis
prevents from this problem as well as a post analysis in the simulator mode. The code and VBA
register must exactly match with the conditions when the trace was recorded.
Advanced program flow analysis will not show valid results with Flow Errors or
FIFO Overflow Messages. The concerning dialogs will show an indicator if they
have processed with Flow Errors or FIFO Overflow Messages.
; VM: Based analysis
; Load the ELF-File into virtual RAM at Host and do all code patches
Data.Load.Elf TheElfFile.eld /VM
; Set the VM: based analysis
Trace.ACCESS VM:0x0
; Open the flow trace window
Trace.List
enddo
; Simulator based analysis
; Setup Simulator
System.CPU MyCPU
System.Up
; Load the ELF-File and do all code patches
Data.Load.Elf TheElfFile.eld
; Restore the VBA address (used for interrupt detection)
Register.Set.VBA 0x0
; Load Stored Trace Data
Trace.Load TheTraceData.ad
; Open the flow trace window
Trace.List
enddo

StarCore Debugger and Trace | 14
©1989-2022 Lauterbach
FIFO Overflows
• FIFO Overflow NEXUS messages are released if the chip internal trace FIFO is full and program
flow messages get lost. This issue can be solved by increasing the amount of data that is
transferred via the NEXUS lines by increasing the MCKO clock with the command
SYStem.Option.MCKO. Unfortunately the clock is limited to the bandwidth of the NEXUS data
and clock lines. Another way to prevent the FIFO from becoming full is stalling the core or
suppressing less important trace data trace messages. The option SYStem.Option.OVC can be
used to specify this behavior.
FAQ
Please refer to our Frequently Asked Questions page on the Lauterbach website.

StarCore Debugger and Trace | 15
©1989-2022 Lauterbach
Configuration
The processor type must be selected by the SYStem.CPU command before issuing any other target related
commands.
PODBUS Cable
PODPC
PODPAR Power Debug
PODETH Interface
Debug Cable
JTAG Connector
Basic configuration for the BDM Interface
Dongle

StarCore Debugger and Trace | 16
©1989-2022 Lauterbach
CPU specific SYStem Settings and Restrictions
SYStem.CLOCK Setup core clock
Default: 0.
The option is used to calculate the timestamp in simulator mode and to set up the PLL of the Nexus
preprocessor.
Nexus Preprocessor PLL ranges
The selection of the PLL range is based to the System Clock multiplied by the SYStem.Option.MCKO ratio.
1. 24.0 MHz < (SYStem.Clock * SYStem.Option.MCKO) < 50.0 MHz
2. 50.0 MHz <= (SYStem.Clock * SYStem.Option.MCKO) < 100.0 MHz
3. 100.0 MHz <= (SYStem.Clock * SYStem.Option.MCKO) < 200.0 MHz
SYStem.CONFIG.state Display target configuration
Opens the SYStem.CONFIG.state window, where you can view and modify most of the target
configuration settings. The configuration settings tell the debugger how to communicate with the chip on
the target board and how to access the on-chip debug and trace facilities in order to accomplish the
debugger’s operations.
Alternatively, you can modify the target configuration settings via the TRACE32 command line with the
SYStem.CONFIG commands. Note that the command line provides additional SYStem.CONFIG
commands for settings that are not included in the SYStem.CONFIG.state window.
Format: SYStem.CLOCK [<frequency>]
Format: SYStem.CONFIG.state [/<tab>]
<tab>: DebugPort |Jtag
<tab> Opens the SYStem.CONFIG.state window on the specified tab. For tab
descriptions, see below.
StarCore Debugger and Trace | 17
©1989-2022 Lauterbach
SYStem.CONFIG Configure debugger according to target topology
The four parameters IRPRE, IRPOST, DRPRE, DRPOST are required to inform the debugger about the
TAP controller position in the JTAG chain, if there is more than one core in the JTAG chain (e.g. Arm + DSP).
The information is required before the debugger can be activated e.g. by a SYStem.Up. See Daisy-chain
Example.
For some CPU selections (SYStem.CPU) the above setting might be automatically included, since the
required system configuration of these CPUs is known.
TriState has to be used if several debuggers (“via separate cables”) are connected to a common JTAG port
at the same time in order to ensure that always only one debugger drives the signal lines. TAPState and
TCKLevel define the TAP state and TCK level which is selected when the debugger switches to tristate
mode. Please note: nTRST must have a pull-up resistor on the target, TCK can have a pull-up or pull-down
resistor, other trigger inputs need to be kept in inactive state.
DebugPort Lets you configure the electrical properties of the debug connection, such
as the communication protocol or the used pinout.
Jtag Informs the debugger about the position of the Test Access Ports (TAP) in
the JTAG chain which the debugger needs to talk to in order to access the
debug and trace facilities on the chip.
Format: SYStem.CONFIG <parameter> <number_or_address>
SYStem.MultiCore <parameter> <number_or_address> (deprecated)
<parameter>:CORE <core>
<parameter>:
(JTAG):
DRPRE <bits>
DRPOST <bits>
IRPRE <bits>
IRPOST <bits>
TAPState <state>
TCKLevel <level>
TriState [ON | OFF]
Slave [ON | OFF]
Multicore debugging is not supported for the DEBUG INTERFACE (LA-7701).

StarCore Debugger and Trace | 18
©1989-2022 Lauterbach
CORE For multicore debugging one TRACE32 PowerView GUI has to be started
per core. To bundle several cores in one processor as required by the
system this command has to be used to define core and processor
coordinates within the system topology.
Further information can be found in SYStem.CONFIG.CORE.
DRPRE (default: 0) <number> of TAPs in the JTAG chain between the core of
interest and the TDO signal of the debugger. If each core in the system
contributes only one TAP to the JTAG chain, DRPRE is the number of
cores between the core of interest and the TDO signal of the debugger.
DRPOST (default: 0) <number> of TAPs in the JTAG chain between the TDI signal
of the debugger and the core of interest. If each core in the system
contributes only one TAP to the JTAG chain, DRPOST is the number of
cores between the TDI signal of the debugger and the core of interest.
IRPRE (default: 0) <number> of instruction register bits in the JTAG chain
between the core of interest and the TDO signal of the debugger. This is
the sum of the instruction register length of all TAPs between the core of
interest and the TDO signal of the debugger.
IRPOST (default: 0) <number> of instruction register bits in the JTAG chain
between the TDI signal and the core of interest. This is the sum of the
instruction register lengths of all TAPs between the TDI signal of the
debugger and the core of interest.
TAPState (default: 7 = Select-DR-Scan) This is the state of the TAP controller when
the debugger switches to tristate mode. All states of the JTAG TAP
controller are selectable.
TCKLevel (default: 0) Level of TCK signal when all debuggers are tristated.
TriState (default: OFF) If several debuggers share the same debug port, this
option is required. The debugger switches to tristate mode after each
debug port access. Then other debuggers can access the port. JTAG:
This option must be used, if the JTAG line of multiple debug boxes are
connected by a JTAG joiner adapter to access a single JTAG chain.
Slave (default: OFF) If more than one debugger share the same debug port, all
except one must have this option active.
JTAG: Only one debugger - the “master” - is allowed to control the signals
nTRST and nSRST (nRESET).

StarCore Debugger and Trace | 19
©1989-2022 Lauterbach
Daisy-Chain Example
Below, configuration for core C.
Instruction register length of
• Core A: 3 bit
• Core B: 5 bit
• Core D: 6 bit
SYStem.CONFIG.IRPRE 6. ; IR Core D
SYStem.CONFIG.IRPOST 8. ; IR Core A + B
SYStem.CONFIG.DRPRE 1. ; DR Core D
SYStem.CONFIG.DRPOST 2. ; DR Core A + B
SYStem.CONFIG.CORE 0. 1. ; Target Core C is Core 0 in Chip 1
Core A Core B Core C Core D TDOTDI
Chip 0 Chip 1

StarCore Debugger and Trace | 20
©1989-2022 Lauterbach
TapStates
0 Exit2-DR
1 Exit1-DR
2 Shift-DR
3 Pause-DR
4 Select-IR-Scan
5 Update-DR
6Capture-DR
7Select-DR-Scan
8 Exit2-IR
9 Exit1-IR
10 Shift-IR
11 Pause-IR
12 Run-Test/Idle
13 Update-IR
14 Capture-IR
15 Test-Logic-Reset
Other manuals for TRACE32-ICD
2
Table of contents
Other Lauterbach Computer Accessories manuals

Lauterbach
Lauterbach MicroBlaze Debugger User manual

Lauterbach
Lauterbach XC800 User manual

Lauterbach
Lauterbach STM8 User manual

Lauterbach
Lauterbach AVR8 User manual

Lauterbach
Lauterbach MMDSP User manual

Lauterbach
Lauterbach C6000 User manual

Lauterbach
Lauterbach TRACE32 User manual

Lauterbach
Lauterbach TRACE32-ICD User manual

Lauterbach
Lauterbach dsPIC33 User manual

Lauterbach
Lauterbach TRACE32 User manual


