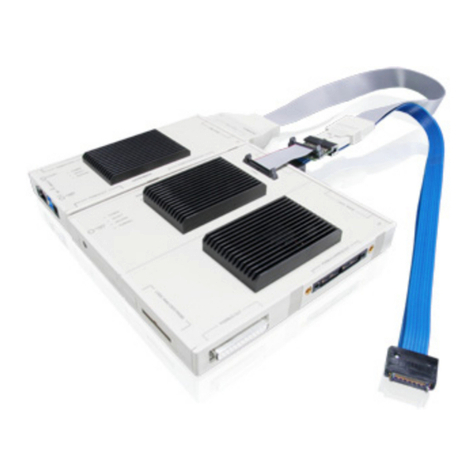
Lauterbach MMDSP User manual

MMDSP Debugger 1
©1989-2019 Lauterbach GmbH
MMDSP Debugger
TRACE32 Online Help
TRACE32 Directory
TRACE32 Index
TRACE32 Documents ......................................................................................................................
ICD In-Circuit Debugger ................................................................................................................
Processor Architecture Manuals ..............................................................................................
MMDSP .....................................................................................................................................
MMDSP Debugger ................................................................................................................ 1
Introduction ....................................................................................................................... 3
Brief Overview of Documents for New Users 3
Warning .............................................................................................................................. 4
Quick Start ......................................................................................................................... 5
Troubleshooting ................................................................................................................ 7
SYStem.Up Errors 7
FAQ ..................................................................................................................................... 7
Configuration ..................................................................................................................... 8
System Overview 8
CPU specific Implementations ......................................................................................... 9
Breakpoints 9
Software Breakpoints 9
On-chip Breakpoints 10
On-chip Breakpoints on instructions 10
Downloading Program Code to the Video Core 11
Changing the FLAG Register 11
Memory Classes 12
CPU specific SYStem Commands ...................................................................................14
SYStem.CONFIG Configure debugger according to target topology 14
Daisy-chain Example 16
TapStates 17
SYStem.CONFIG.CORE Assign core to TRACE32 instance 18
SYStem.CPU Select the used CPU 19
SYStem.CpuAccess Run-time memory access (intrusive) 20
SYStem.DictionaryReset Reset dictionary memory STN8810V 20
SYStem.JtagClock Define JTAG frequency 21
SYStem.LOCK Lock and tristate the debug port 21

MMDSP Debugger 2
©1989-2019 Lauterbach GmbH
SYStem.MemAccess Real-time memory access (non-intrusive) 22
SYStem.Mode Establish the communication with the target 22
SYStem.Option 8810compatible Set the compatibility mode 8810 23
SYStem.Option.DCUMode Select the “DCU” mode 23
SYStem.Option DIAG System diagnosis command 23
SYStem.Option EnReset Control activation of the reset line 24
SYStem.Option IMASKASM Disable interrupts while single stepping 24
SYStem.Option IMASKHLL Disable interrupts while HLL single stepping 24
SYStem.Option ICFLUSH Flush instruction cache (ST8810A) 25
SYStem.Option NMF Retrieves the value of pThis 25
SYStem.Option OP9compatible Compatibility mode OP9 25
SYStem.RESet Reset the system settings 26
SYStem.Softreset Soft reset of the core 26
CPU specific Commands .................................................................................................. 27
Data.LOAD.Elf Load ELF file 27
Register.RESet Soft reset 27
SNoop.PC Enable PC snooping 28
CPU specific TrOnchip Commands .................................................................................29
TrOnchip.CONVert Adjust range breakpoint in on-chip resource 29
TrOnchip.VarCONVert Adjust complex breakpoint in on-chip resource 29
TrOnchip.state Display on-chip trigger window 29
TrOnchip.RESet Set on-chip trigger to default state 30
JTAG Connection .............................................................................................................. 31
Mechanical Description of the 20-pin Debug Cable 31
Electrical Description of the 20-pin Debug Cable 32
Operation Voltage ............................................................................................................. 33
Support ............................................................................................................................... 34
Available Tools 34
Compilers 34
Target Operating Systems 34
3rd-Party Tool Integrations 35
Products ............................................................................................................................. 36
Product Information 36
Order Information 36

MMDSP Debugger 3
©1989-2019 Lauterbach GmbH
MMDSP Debugger
Version 16-Apr-2019
Introduction
This documentation describes the processor specific settings and features for the TRACE32 debugger.
Please keep in mind that only the Processor Architecture Manual (the document you are reading at the
moment) is CPU specific, while all other parts of the online help are generic for all CPUs supported by
Lauterbach. So if there are questions related to the CPU, the Processor Architecture Manual should be your
first choice.
Brief Overview of Documents for New Users
Architecture-independent information:
•“Debugger Basics - Training” (training_debugger.pdf): Get familiar with the basic features of a
TRACE32 debugger.
•“T32Start” (app_t32start.pdf): T32Start assists you in starting TRACE32 PowerView instances
for different configurations of the debugger. T32Start is only available for Windows.
•“General Commands” (general_ref_<x>.pdf): Alphabetic list of debug commands.
Architecture-specific information:
•“Processor Architecture Manuals”: These manuals describe commands that are specific for the
processor architecture supported by your debug cable. To access the manual for your processor
architecture, proceed as follows:
- Choose Help menu > Processor Architecture Manual.
•“OS Awareness Manuals” (rtos_<os>.pdf): TRACE32 PowerView can be extended for operating
system-aware debugging. The appropriate OS Awareness manual informs you how to enable the
OS-aware debugging.

MMDSP Debugger 4
©1989-2019 Lauterbach GmbH
Warning
NOTE: To prevent debugger and target from damage it is recommended to
connect or disconnect the debug cable only while the target power is
OFF.
Recommendation for the software start:
1. Disconnect the debug cable from the target while the target
power is off.
2. Connect the host system, the TRACE32 hardware and the
debug cable.
3. Power ON the TRACE32 hardware.
4. Start the TRACE32 software to load the debugger firmware.
5. Connect the debug cable to the target.
6. Switch the target power ON.
7. Configure your debugger e.g. via a start-up script.
Power down:
1. Switch off the target power.
2. Disconnect the debug cable from the target.
3. Close the TRACE32 software.
4. Power OFF the TRACE32 hardware.

MMDSP Debugger 5
©1989-2019 Lauterbach GmbH
Quick Start
1. Start the ARM debugger (for details see “Quick Start of the JTAG Debugger” in “ARM
Debugger” (debugger_arm.pdf)) of the Nomadik, and set local memory bus frequency to
10 MHz:
2. Only required for Tracing via NEXUS: Enable NEXUS via ARM debugger
3. Start the MMDSP debugger, select the device prompt B:, if the device prompt is not active after
the TRACE32-Software is started.
4. Select the core on your target, if automatic detection is not possible:
5. Configure the Debugger to use on-chip breakpoints in memory areas that are read-only (e.g.
FLASH/ROM):
If a program breakpoint is set within the specified address range, on-chip breakpoints are now used
instead of software breakpoints. A list of all available on-chip breakpoints for your architecture can be
found under On-chip Breakpoints.
6. Enter the debug mode.
This command resets the CPU and enters the debug mode. After SYStem.Up it is possible to access
the registers and the memory.
; set local memory bus frequency = 10 MHz
d.s 0x10000014 %l 0x000a05f
d.s 0x10000008 %l 0x090c12a
d.s 0x10000014 %l 0x0
D.S 0xE0000024 %be %b 0x40 ; only Audio MMDSP (STN8810A)
D.S 0xE0000024 %be %b 0x80 ; only Video MMDSP (STN8810V)
B::
SYStem.CPU STN8810A
MAP.BOnchip 0xC00000++0x1fffff
SYStem.Up

MMDSP Debugger 6
©1989-2019 Lauterbach GmbH
7. Audio DSP only: Set the base and top address of program and data memory using the CacheCtrl
registers. Default values can be seen in the example below for COB-10 and MEK Evaluation
Boards. Alternatively the values can be set via a script for the ARM core at system power-up.
Refer also to the PER command.
COB-10 Evaluation Board:
MEK FPGA Evaluation Board:
8. Load your application.
The load command depends on the file format generated by your compiler. Be sure to load a file
compiled for the correct core. A full description of the Data.Load command is given in the “General
Commands Reference”.
Data.Set DBG:0x1038 %quad 0x0000000000200000
Data.Set DBG:0x1050 %quad 0x0080000000400000
Data.Set DBG:0x1058 %quad 0x0000000000C00000
; PROG_BASE_ADR
; DATA_AHB_BASE
; DATA_AHB_TOP
Data.Set DBG:0x1038 %QUAD 0x00000000800a0000
Data.Set DBG:0x1050 %QUAD 0x802A0000801A0000
Data.Set DBG:0x1058 %QUAD 0x80320000803A0000
; PROG_BASE_ADR
; DATA_AHB_BASE
; DATA_AHB_TOP
Data.LOAD.Elf cppdemo.elf

MMDSP Debugger 7
©1989-2019 Lauterbach GmbH
Troubleshooting
SYStem.Up Errors
No information available.
FAQ
No information available
No information available

MMDSP Debugger 8
©1989-2019 Lauterbach GmbH
Configuration
System Overview
POWER DEBUG / ETHERN ET
PODBUS IN
TRIG
POWER
7-9 V
USB
LAUTERBACH
PODBUS OUT
DEBUG CABLE
Target
PC or
Workstation
Ethernet
Cable
POWER
SELECT
EMULATE
RECORDING
TRIGGER
ETHERNET
CON ERR
TRANSMIT
RECEIVE
COLLISION
HUB
100 MBit Ethernet
Debug Cable
JTAG
Connector
DEBUG CABLE
LAUTERBACH
RESERVED FOR POWER TRACE
CBA
POWER DEBUG / ETHERNET
AC/DC Adapter

MMDSP Debugger 9
©1989-2019 Lauterbach GmbH
CPU specific Implementations
Breakpoints
There are two implementations for breakpoints:
• Software breakpoints
• On-chip breakpoints
For MMDSP it is only possible to set breakpoints when the clock is stopped. This applies to both software
and on-chip breakpoints.
Software Breakpoints
In order to stop the program execution at a selected instruction, the code at the break location is patched by
a software break instruction. If the software break instruction comes to the execution stage of the
pipeline, the program execution is stopped and the debug mode becomes active.
Software breakpoints can be set to instructions in RAM and with some preparations also to instructions in
FLASH (see FLASH.Create and FLASH.AUTO). Software breakpoints on instructions in FLASH should
only be used, if the number of on-chip breakpoints is insufficient.
The number of software breakpoints is unlimited.
STN8810A (Audio): note that modifications to the program memory like setting and removing a SW
breakpoint require to flush the instruction cache to guarantee that the CPU sees the updated data. This
cache flush is executed before program execution is resumed. To avoid these cache flushes resort to on-
chip breakpoints. The STN8810V (Video) is not affected as it does not have an instruction cache.

MMDSP Debugger 1 0
©1989-2019 Lauterbach GmbH
On-chip Breakpoints
This implementation is called on-chip, because the debugger uses resources provided by the processor to
set a breakpoint. The MMDSP core is equipped with 2 watchpoint/breakpoint units.
The following list gives an overview of the usage of the on-chip breakpoints by TRACE32-ICD:
•On-chip breakpoints: Total amount of available on-chip breakpoints.
•Instruction breakpoints: Number of on-chip breakpoints that can be used for program
breakpoints.
•Read/Write breakpoints: Number of on-chip breakpoints that can be used as Read or Write
breakpoints.
•Data breakpoints: Number of on-chip data breakpoints that can be used to stop the program
when a specific data value is written to an address or when a specific data value is read from an
address.
On-chip Breakpoints on instructions
On-chip breakpoints are handled by the CPU internally and do not require to modify the program memory.
Therefore they can be used to set a breakpoint on an instruction in FLASH or ROM.
With the command MAP.BOnchip <range> it is possible to instruct the debugger to use On-chip
breakpoints for the specified range as default (it is still possible to override this with parameters like /SOFT
for the break.set command). Typically it is used for FLASH/ROM memories. If a breakpoint is set within the
specified address range, the debugger uses automatically the available on-chip breakpoints.
Use the command MAP.List to see for which address ranges the debugger uses on-chip breakpoints.
CPU Family On-chip
Breakpoints
Instruction
Breakpoints
Read/Write
Breakpoints
Data
Breakpoints
MMDSP 3 2 1 1

MMDSP Debugger 1 1
©1989-2019 Lauterbach GmbH
Example for Breakpoints
Assume you have a target with FLASH from 0to 0xFFFFF and RAM from 0x100000 to 0x11FFFF. The
command to configure TRACE32 correctly for this configuration is:
The following breakpoint combinations are possible.
Software breakpoints:
On-chip breakpoints:
Downloading Program Code to the Video Core
The STN8810A and STN8810V are not object code compatible. When loading a program that was compiled
for the wrong core, the message “file not compiled for this processor” is displayed.
The Video Core employs a compression algorithm based on a dictionary. The dictionary is dynamically
created while downloading the object code to the target. The algorithm exploits the fact that some
instructions do not use all fields of the opcode to obtain better compression. While the functionality of an
instruction is not affected by compression/decompression, a reconstructed opcode will not be necessarily
binary identical to the original opcode. Therefore the /verify option for the data.load command may
produce false error message when used for download code to the video core.
Changing the FLAG Register
Changing the FLAG register through the debugger is not supported.
Map.BOnchip 0x0--0x0FFFFF
Break.Set 0x100000 /Program ; Software Breakpoint 1
Break.Set 0x101000 /Program ; Software Breakpoint 2
Break.Set 0xx /Program ; Software Breakpoint 3
Break.Set 0x100 /Program ; On-chip Breakpoint 1
Break.Set 0x0ff00 /Program ; sOn-chip Breakpoint 2

MMDSP Debugger 1 2
©1989-2019 Lauterbach GmbH
Memory Classes
The following DSP specific memory classes are available.
The Video core STN8810V uses a dictionary for compressing its program memory. When writing code to the
program memory (e.g. by downloading a program to the target via Data.LOAD.Elf or by writing to a P:
memory location), the debugger automatically adds necessary dictionary entries derived from the written
program data. This is hidden from the user, who accesses program memory always in 64bit words (one
VLIW instruction). The compressed program and dictionary memories can be accessed via the DBG:
memory class (see below). Downloading a program to the target via Data.LOAD.Elf deletes the old
dictionary and therefore may invalidate instructions, even if their are not physically overwritten by the new
program.
The DBG memory class gives access to memory resources like host register, indirect host registers, and
dictionary ram (Video core only). The mapping of these resources to addresses is arbitrary and does
not relate to any MMDSP or system address mappings. The mapping is only valid in the context of the
DBG memory class.
To access a memory class, write the class specifier in front of the address:
For accessing indirect host registers (DBG: 0x1000--0x1FFF), the 64-bit access width needs to be specified:
Memory Class Description
PProgramMemory
X Data Memory (X-Bus)
Y Data Memory (Y-Bus)
DBG Debug Memory
Address Range Mapped Resource
DBG: 0x0000--0x007f host registers, 8-bit width
DBG: 0x1000--0x1FFF indirect host registers, up to 64-bit wide
DBG: 0x2000--0x5FFF dictionary memory, 53-bit wide (Video)
DBG: 0x6000--*: compressed instructions, 24-bit wide (Video)
Data.dump p:0--3
d.in dbg:0x1015 /quad
print data.quad(dbg:0x1015)
d.out dbg:0x1015 %quad 0x1122334455667788

MMDSP Debugger 1 3
©1989-2019 Lauterbach GmbH
Note that for MMDSP it is not possible to access memory through the debugger while the core is executing
code.
For not CPU-specific keywords, see non-declarable input variables in “ICE/FIRE Analyzer Trigger Unit
Programming Guide” (analyzer_prog.pdf).

MMDSP Debugger 1 4
©1989-2019 Lauterbach GmbH
CPU specific SYStem Commands
SYStem.CONFIG Configure debugger according to target topology
The four parameters IRPRE, IRPOST, DRPRE, DRPOST are required to inform the debugger about the
TAP controller position in the JTAG chain, if there is more than one core in the JTAG chain (e.g. ARM +
DSP). The information is required before the debugger can be activated e.g. by a SYStem.Up. See Daisy-
chain Example.
For some CPU selections (SYStem.CPU) the above setting might be automatically included, since the
required system configuration of these CPUs is known.
TriState has to be used if several debuggers (“via separate cables”) are connected to a common JTAG port
at the same time in order to ensure that always only one debugger drives the signal lines. TAPState and
TCKLevel define the TAP state and TCK level which is selected when the debugger switches to tristate
mode. Please note: nTRST must have a pull-up resistor on the target, TCK can have a pull-up or pull-down
resistor, other trigger inputs need to be kept in inactive state.
Format: SYStem.CONFIG <parameter> <number_or_address>
SYStem.MultiCore <parameter> <number_or_address> (deprecated)
<parameter>:CORE <core>
<parameter>:
(JTAG):
DRPRE <bits>
DRPOST <bits>
IRPRE <bits>
IRPOST <bits>
TAPState <state>
TCKLevel <level>
TriState [ON | OFF]
Slave [ON | OFF]
Multicore debugging is not supported for the DEBUG INTERFACE (LA-7701).
CORE For multicore debugging one TRACE32 GUI has to be started per core.
To bundle several cores in one processor as required by the system this
command has to be used to define core and processor coordinates within
the system topology.
Further information can be found in SYStem.CONFIG.CORE.

MMDSP Debugger 1 5
©1989-2019 Lauterbach GmbH
DRPRE (default: 0) <number> of TAPs in the JTAG chain between the core of
interest and the TDO signal of the debugger. If each core in the system
contributes only one TAP to the JTAG chain, DRPRE is the number of
cores between the core of interest and the TDO signal of the debugger.
DRPOST (default: 0) <number> of TAPs in the JTAG chain between the TDI signal
of the debugger and the core of interest. If each core in the system
contributes only one TAP to the JTAG chain, DRPOST is the number of
cores between the TDI signal of the debugger and the core of interest.
IRPRE (default: 0) <number> of instruction register bits in the JTAG chain
between the core of interest and the TDO signal of the debugger. This is
the sum of the instruction register length of all TAPs between the core of
interest and the TDO signal of the debugger.
IRPOST (default: 0) <number> of instruction register bits in the JTAG chain
between the TDI signal and the core of interest. This is the sum of the
instruction register lengths of all TAPs between the TDI signal of the
debugger and the core of interest.
TAPState (default: 7 = Select-DR-Scan) This is the state of the TAP controller when
the debugger switches to tristate mode. All states of the JTAG TAP
controller are selectable.
TCKLevel (default: 0) Level of TCK signal when all debuggers are tristated.
TriState (default: OFF) If several debuggers share the same debug port, this
option is required. The debugger switches to tristate mode after each
debug port access. Then other debuggers can access the port. JTAG:
This option must be used, if the JTAG line of multiple debug boxes are
connected by a JTAG joiner adapter to access a single JTAG chain.
Slave (default: OFF) If more than one debugger share the same debug port, all
except one must have this option active.
JTAG: Only one debugger - the “master” - is allowed to control the signals
nTRST and nSRST (nRESET).

MMDSP Debugger 1 6
©1989-2019 Lauterbach GmbH
Daisy-chain Example
Below, configuration for core C.
Instruction register length of
• Core A: 3 bit
• Core B: 5 bit
• Core D: 6 bit
SYStem.CONFIG.IRPRE 6 ; IR Core D
SYStem.CONFIG.IRPOST 8 ; IR Core A + B
SYStem.CONFIG.DRPRE 1 ; DR Core D
SYStem.CONFIG.DRPOST 2 ; DR Core A + B
SYStem.CONFIG.CORE 0. 1. ; Target Core C is Core 0 in Chip 1
Core A Core B Core C Core D TDOTDI
Chip 0 Chip 1

MMDSP Debugger 1 7
©1989-2019 Lauterbach GmbH
TapStates
0 Exit2-DR
1 Exit1-DR
2 Shift-DR
3 Pause-DR
4 Select-IR-Scan
5 Update-DR
6Capture-DR
7Select-DR-Scan
8 Exit2-IR
9 Exit1-IR
10 Shift-IR
11 Pause-IR
12 Run-Test/Idle
13 Update-IR
14 Capture-IR
15 Test-Logic-Reset

MMDSP Debugger 1 8
©1989-2019 Lauterbach GmbH
SYStem.CONFIG.CORE Assign core to TRACE32 instance
Default coreindex: depends on the CPU, usually 1. for generic chips
Default chipindex: derived from CORE= parameter of the configuration file (config.t32). The CORE
parameter is defined according to the start order of the GUI in T32Start with ascending values.
To provide proper interaction between different parts of the debugger the systems topology must be mapped
to the debuggers topology model. The debugger model abstracts chips and sub-cores of these chips. Every
GUI must be connect to one unused core entry in the debugger topology model. Once the SYStem.CPU is
selected a generic chip or none generic chip is created at the default chipindex.
None Generic Chips
None generic chips have a fixed amount of sub-cores with a fixed CPU type.
First all cores have successive chip numbers at their GUIs. Therefore you have to assign the coreindex and
the chipindex for every core. Usually the debugger does not need further information to access cores in
none generic chips, once the setup is correct.
Generic Chips
Generic chips can accommodate an arbitrary amount of sub-cores. The debugger still needs information
how to connect to the individual cores e.g. by setting the JTAG chain coordinates.
Start-up Process
The debug system must not have an invalid state where a GUI is connected to a wrong core type of a none
generic chip, two GUI are connected to the same coordinate or a GUI is not connected to a core. The initial
state of the system is value since every new GUI uses a new chipindex according to its CORE= parameter
of the configuration file (config.t32). If the system contains fewer chips than initially assumed, the chips must
be merged by calling SYStem.CONFIG.CORE.
Format: SYStem.CONFIG.CORE <coreindex> <chipindex>
SYStem.MultiCore.CORE <coreindex> <chipindex> (deprecated)
<chipindex>:1…i
<coreindex>:1…k

MMDSP Debugger 1 9
©1989-2019 Lauterbach GmbH
SYStem.CPU Select the used CPU
Selects the processor type. Default selection: STN8810A.
STN881xA is the Audio DSP, STN881xV is the Video DSP.
Format: SYStem.CPU <cpu>
<cpu>:ST8810A | ST8810V | STN8815A | STN8815V | STN8820A | STN8820V |
STN8820 I …

MMDSP Debugger 2 0
©1989-2019 Lauterbach GmbH
SYStem.CpuAccess Run-time memory access (intrusive)
The SYStem.CpuAccess command controls if the debugger may use the CPU to perform intrusive memory
operations while the clock is running. If enabled, these memory operations are performed by briefly stopping
the CPU, performing the access and activating the CPU again.
SYStem.DictionaryReset Reset dictionary memory STN8810V
Logically resets the program dictionary memory. This command does not actually clear the dictionary
memory in the target. It simply resets the buffer in the debugger. Therefore the dictionary will be overwritten
if new instructions are written to program memory.
Only relevant for STN8810V (Video core).
Format: SYStem.CpuAccess <mode>
<mode>: Enable
Denied
Nonstop
Enable For performing a memory access (r/w) while the CPU is executing, the
debugger interrupts program execution briefly. Each interruption takes
1 … 100 ms depending on the speed of the debug interface and on the
number of the read/write accesses required. Window updates e.g. for
data.dump windows are on default performed 10 times/s.
Denied The debugger is not allowed to interrupt program execution for
performing memory accesses.
Default setting.
Nonstop Nonstop ensures that the debugger will not affect the real-time behavior
of the system in any way. This includes blocking of the break command
and of other intrusive features like performance analysis via StopAndGo,
conditional breakpoints etc.
For MMDSP the option NonStop reduces the functionality to tracing the
program flow as no memory access can be performed by the debugger
while the clock is running.
Format: SYStem.DictionaryReset
Table of contents
Other Lauterbach Computer Accessories manuals

Lauterbach
Lauterbach C6000 User manual
Lauterbach
Lauterbach AVR8 User manual

Lauterbach
Lauterbach TRACE32 User manual
Lauterbach
Lauterbach XC800 User manual

Lauterbach
Lauterbach dsPIC33 User manual

Lauterbach
Lauterbach TRACE32-ICD User manual
Lauterbach
Lauterbach MicroBlaze Debugger User manual
Lauterbach
Lauterbach TRACE32-ICD User manual
Lauterbach
Lauterbach TRACE32 User manual
Lauterbach
Lauterbach STM8 User manual
