Lauterbach STM8 User manual

STM8 Debugger 1
©1989-2019 Lauterbach GmbH
STM8 Debugger
TRACE32 Online Help
TRACE32 Directory
TRACE32 Index
TRACE32 Documents ......................................................................................................................
ICD In-Circuit Debugger ................................................................................................................
Processor Architecture Manuals ..............................................................................................
STM8 .........................................................................................................................................
STM8 Debugger .................................................................................................................... 1
History ................................................................................................................................ 3
Introduction ....................................................................................................................... 4
Brief Overview of Documents for New Users 4
Demo and Start-up Script 4
Configuration ..................................................................................................................... 5
System Overview 5
Warning .............................................................................................................................. 6
Quick Start ......................................................................................................................... 7
Troubleshooting ................................................................................................................ 9
FAQ ..................................................................................................................................... 10
Debugger 10
STM8 specific SYStem Settings ....................................................................................... 12
SYStem.CPU Select the used CPU 12
SYStem.CpuAccess Run-time memory access (intrusive) 12
SYStem.MemAccess Real-time memory access (non-intrusive) 13
SYStem.Mode Establish the communication with the target 13
SYStem.LOCK Lock and tristate the debug port 13
SYStem.Option IMASKASM Disable interrupts while single stepping 14
SYStem.Option IMASKHLL Disable interrupts while HLL single stepping 14
STM8 specific TrOnchip Command .................................................................................15
TrOnchip.VarCONVert Adjust complex breakpoint in on-chip resource 15
Breakpoints ........................................................................................................................ 16
Software breakpoints 16
On-chip breakpoints for instructions 16
On-chip breakpoints for data 16
Memory Classes ................................................................................................................ 17

STM8 Debugger 2
©1989-2019 Lauterbach GmbH
Target Adaption ................................................................................................................. 18
Connector Type and Pinout 18
Support ............................................................................................................................... 18
Available Tools 19
Compilers 22
Products ............................................................................................................................. 23
Product Information 23
Order Information 23

STM8 Debugger 3
©1989-2019 Lauterbach GmbH
STM8 Debugger
Version 16-Apr-2019
History
14-Feb-18 New manual.

STM8 Debugger 4
©1989-2019 Lauterbach GmbH
Introduction
This document serves as a guideline for debugging STM8 MCUs and describes all MCU-specific
TRACE32 settings and features.
Please keep in mind that only the Processor Architecture Manual (the document you are reading at the
moment) is CPU specific, while all other parts of the online help are generic for all CPUs supported by
Lauterbach. So if there are questions related to the CPU, the Processor Architecture Manual should be your
first choice.
Brief Overview of Documents for New Users
Architecture-independent information:
•“Debugger Basics - Training” (training_debugger.pdf): Get familiar with the basic features of a
TRACE32 debugger.
•“T32Start” (app_t32start.pdf): T32Start assists you in starting TRACE32 PowerView instances
for different configurations of the debugger. T32Start is only available for Windows.
•“General Commands” (general_ref_<x>.pdf): Alphabetic list of debug commands.
Architecture-specific information:
•“Processor Architecture Manuals”: These manuals describe commands that are specific for the
processor architecture supported by your debug cable. To access the manual for your processor
architecture, proceed as follows:
- Choose Help menu > Processor Architecture Manual.
•“OS Awareness Manuals” (rtos_<os>.pdf): TRACE32 PowerView can be extended for operating
system-aware debugging. The appropriate OS Awareness manual informs you how to enable the
OS-aware debugging.
Demo and Start-up Script
The on-chip FLASH and the EEProm memory can be programmed via the stm8.cmm script:
Please be aware that you should check the Flash and EEProm size specified for your MCU in the stm8.cmm
before executing this script.
CD.DO ~~/demo/stm8/flash/stm8.cmm
STM8 Debugger 5
©1989-2019 Lauterbach GmbH
Configuration
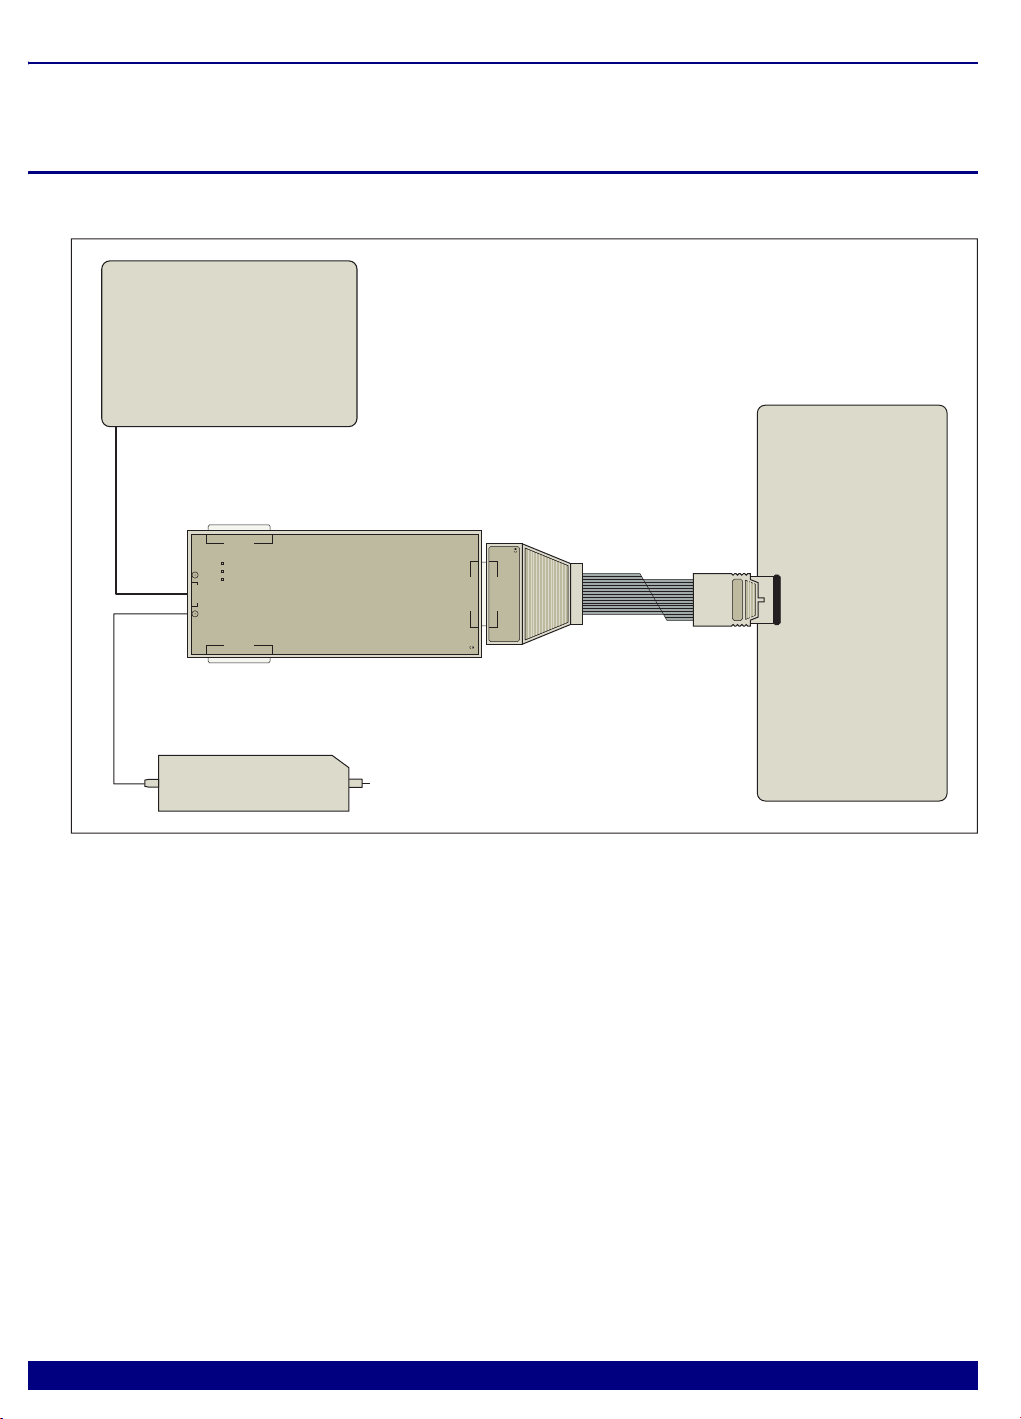
System Overview
Example configuration for an STM8 debugger.
Target
DEBUG CABLE
LAUTERBACH
Debug Cable
POWER DEBUG INTERFACE / USB 3
AC/DC Adapter
PC
USB
Cable
LAUTERBACH
POWER
SELECT
EMULATE
PODBUS OUT
USB
PODBUS IN
DEBUG CABLE
POWER
7-9V
TRIG
POWER DEBUG USB INTERFACE / USB 3
Debug
Connector
Windows / Linux / Mac OS

STM8 Debugger 6
©1989-2019 Lauterbach GmbH
Warning
NOTE: To prevent debugger and target from damage it is recommended to connect or
disconnect the debug cable only while the target power is OFF.
Recommendation for the software start:
1. Disconnect the debug cable from the target while the target power is
off.
2. Connect the host system, the TRACE32 hardware and the debug
cable.
3. Power ON the TRACE32 hardware.
4. Start the TRACE32 software to load the debugger firmware.
5. Connect the debug cable to the target.
6. Switch the target power ON.
7. Configure your debugger e.g. via a start-up script.
Power down:
1. Switch off the target power.
2. Disconnect the debug cable from the target.
3. Close the TRACE32 software.
4. Power OFF the TRACE32 hardware.

STM8 Debugger 7
©1989-2019 Lauterbach GmbH
Quick Start
Starting up the debugger is done as follows:
1. Select the device prompt B (BDM debugger) and reset TRACE32.
The device prompt B:: is normally already selected in the TRACE32 command line. If this is not the
case enter B:: to set the correct device prompt. The RESet command is only necessary if you do not
start directly after booting the TRACE32 development tool.
2. Specify the CPU specific settings.
This command selects the CPU type.
3. Inform the debugger about cashable address range (FLASH/EEPROM)..
This is important to speed up the T32 GUI responsiveness. The specified address range will be
accesses only once after a break, thus avoiding unnecessary memory accesses.
4. Reset the target and enter debug mode.
This command resets the CPU on the target, enables On-Chip-Debug Mode and issues a breakpoint
right after the reset interrupt routine.The CPU stops executing any instruction, and the user is able to
download the code and test. After this command is executed, it is possible to access memory and
registers.
B::
RESet
SYStem.CPU STM8S005K6
MAP.UpdateOnce p:0x8000--0xffff
SYStem.Mode Up

STM8 Debugger 8
©1989-2019 Lauterbach GmbH
5. Load the program into the flash.
A typical start sequence of the STM8 is shown below. This sequence can be written to a PRACTICE script
file (*.cmm, ASCII file format) and executed with the command DO <filename>.
*) These commands open windows on the screen. The window position can be specified with the WinPOS
command.
DO ~~/demo/stm8/flash/stm8.cmm
B:: ; Select the ICD device prompt
RESet ; Reset the TRACE32 software
MAP.UpdateOnce p:0x8000--
0xffff
; Specify the address range for caching
WinCLEAR ; Clear all windows
SYStem.Up ; Reset the target and enter debug mode
DO
~~/demo/stm8/flash/stm8.cmm
; Load the target application into the
Flash
PER.view ; Show clearly arranged peripherals
; in window *)
List.Mix ; Open source code window *)
Register.view /SpotLight ; Open register window *)
Frame.view /Locals /Caller ; Open the stack frame with
; local variables *)
Var.Watch %SpotLight flags ast ; Open watch window for variables *)
Break.Set 0x1000 /Program ; Set software breakpoint to address
; 1000 (address 1000 is within RAM
; address range)
Break.Set 0x101000 /Program ; Set on-chip breakpoint
; to address 101000 (address 101000 is
; within Flash address range)
STM8 Debugger 9
©1989-2019 Lauterbach GmbH
Troubleshooting
Typically the SYStem.Up command is the first command of a debug session where communication with the
target is required. If you receive error messages like “debug port fail” or “debug port time out” while executing
this command, this may have the reasons below. “target processor in reset” is just a follow-up error
message.
• Open the AREA.view window to display all error messages.
• If the target has no power or the debug cable is not connected to the target, this results in the
error message “target power fail”.
• Did you select the correct core type SYStem.CPU <type>?
• There is an issue with the SWD interface. Maybe there is the need to set jumpers on the target to
connect the correct signals to the SWD connector.
• The target is in an unrecoverable state. Re-power your target and try again.
• The core is kept in reset.
• There is a watchdog which needs to be deactivated.
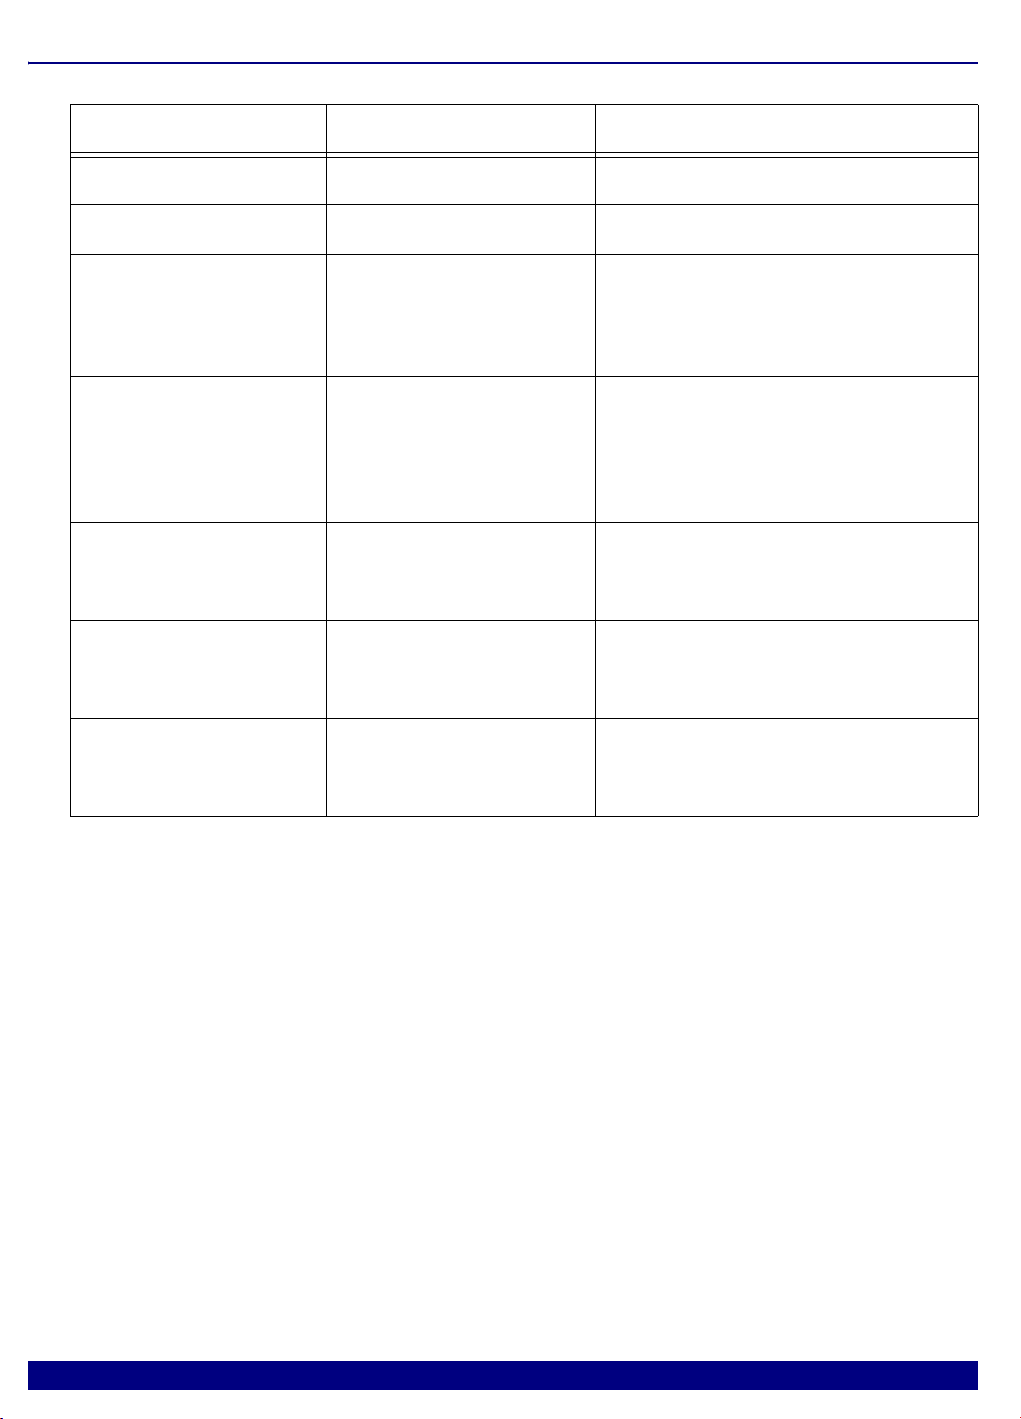
Error Message Event Reason
target power fail SYStem.Mode.Up See below.
target processor in reset SYStem.Down See below.
Target is not connected
or the SWD Interface is
returning an error.
SYStem.Mode.Up
SYStem.Mode.Go
The debugger expects to receive a
confirmation for each command sent to
the target. An error occurs in case the
confirmation is not received.
The number of
<number> accessed
bytes in memory is not a
multiple of the access
<size> bytes.
No special event Internal error, please consult your
Lauterbach representative.
Memory <address> is
not aligned to access
<size>.
No special event Internal error, please consult your
Lauterbach representative.
Invalid memory access
size: <size> bytes (@
<address>)
No special event Internal error, please consult your
Lauterbach representative.
Memory access timeout:
Reading from
<address>
No special event Corrupted JTAG connection. Check
JTAG hardware and settings.

STM8 Debugger 1 0
©1989-2019 Lauterbach GmbH
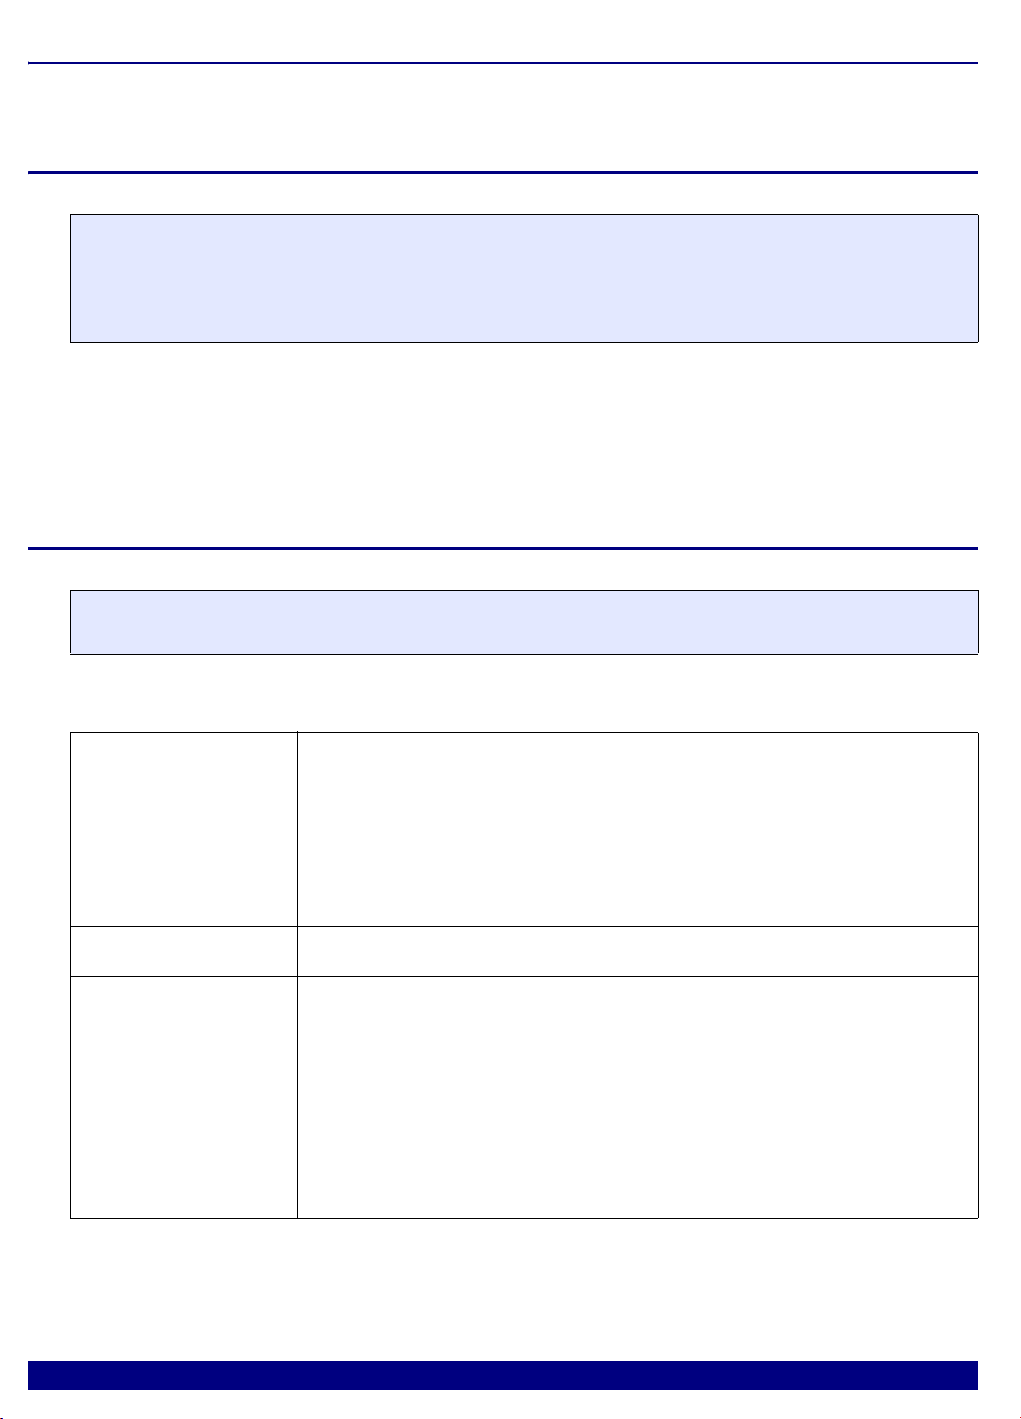
FAQ
Debugger
Debugging via
VPN
Ref: 0307
The debugger is accessed via Internet/VPN and the performance is very
slow. What can be done to improve debug performance?
The main cause for bad debug performance via Internet or VPN are low data
throughput and high latency. The ways to improve performance by the debugger
are limited:
In PRACTICE scripts, use "SCREEN.OFF" at the beginning of the script
and "SCREEN.ON" at the end. "SCREEN.OFF" will turn off screen
updates. Please note that if your program stops (e.g. on error) without exe-
cuting "SCREEN.OFF", some windows will not be updated.
"SYStem.POLLING SLOW" will set a lower frequency for target state
checks (e.g. power, reset, jtag state). It will take longer for the debugger to
recognize that the core stopped on a breakpoint.
"SETUP.URATE 1.s" will set the default update frequency of
Data.List/Data.dump/Variable windows to 1 second (the slowest possible
setting).
prevent unneeded memory accesses using "MAP.UPDATEONCE
[address-range]" for RAM and "MAP.CONST [address--range]" for
ROM/FLASH. Address ranged with "MAP.UPDATEONCE" will read the
specified address range only once after the core stopped at a breakpoint or
manual break. "MAP.CONST" will read the specified address range only
once per SYStem.Mode command (e.g. SYStem.Up).

STM8 Debugger 1 1
©1989-2019 Lauterbach GmbH
Setting a
Software
Breakpoint fails
Ref: 0276
What can be the reasons why setting a software breakpoint fails?
Setting a software breakpoint can fail when the target HW is not able to
implement the wanted breakpoint.
Possible reasons:
The wanted breakpoint needs special features that are only possible to
realize by the trigger unit inside the controller.
Example: Read, write and access (Read/Write) breakpoints ("type" in Break.Set
window). Breakpoints with checking in real-time for data-values ("Data").
Breakpoints with special features ("action") like TriggerTrace, TraceEnable,
TraceOn/TraceOFF.
TRACE32 can not change the memory.
Example: ROM and Flash when no preparation with FLASH.Create,
FLASH.TARGET and FLASH.AUTO was made. All type of memory if the
memory device is missing the necessary control signals like WriteEnable or
settings of registers and SpecialFunctionRegisters (SFR).
Contrary settings in TRACE32.
Like: MAP.BOnchip for this memory range. Break.SELect.<breakpoint-type>
Onchip (HARD is only available for ICE and FIRE).
RTOS and MMU:
If the memory can be changed by Data.Set but the breakpoint doesn't work it
might be a problem of using an MMU on target when setting the breakpoint to a
symbolic address that is different than the writable and intended memory
location.
STM8 Debugger 1 2
©1989-2019 Lauterbach GmbH
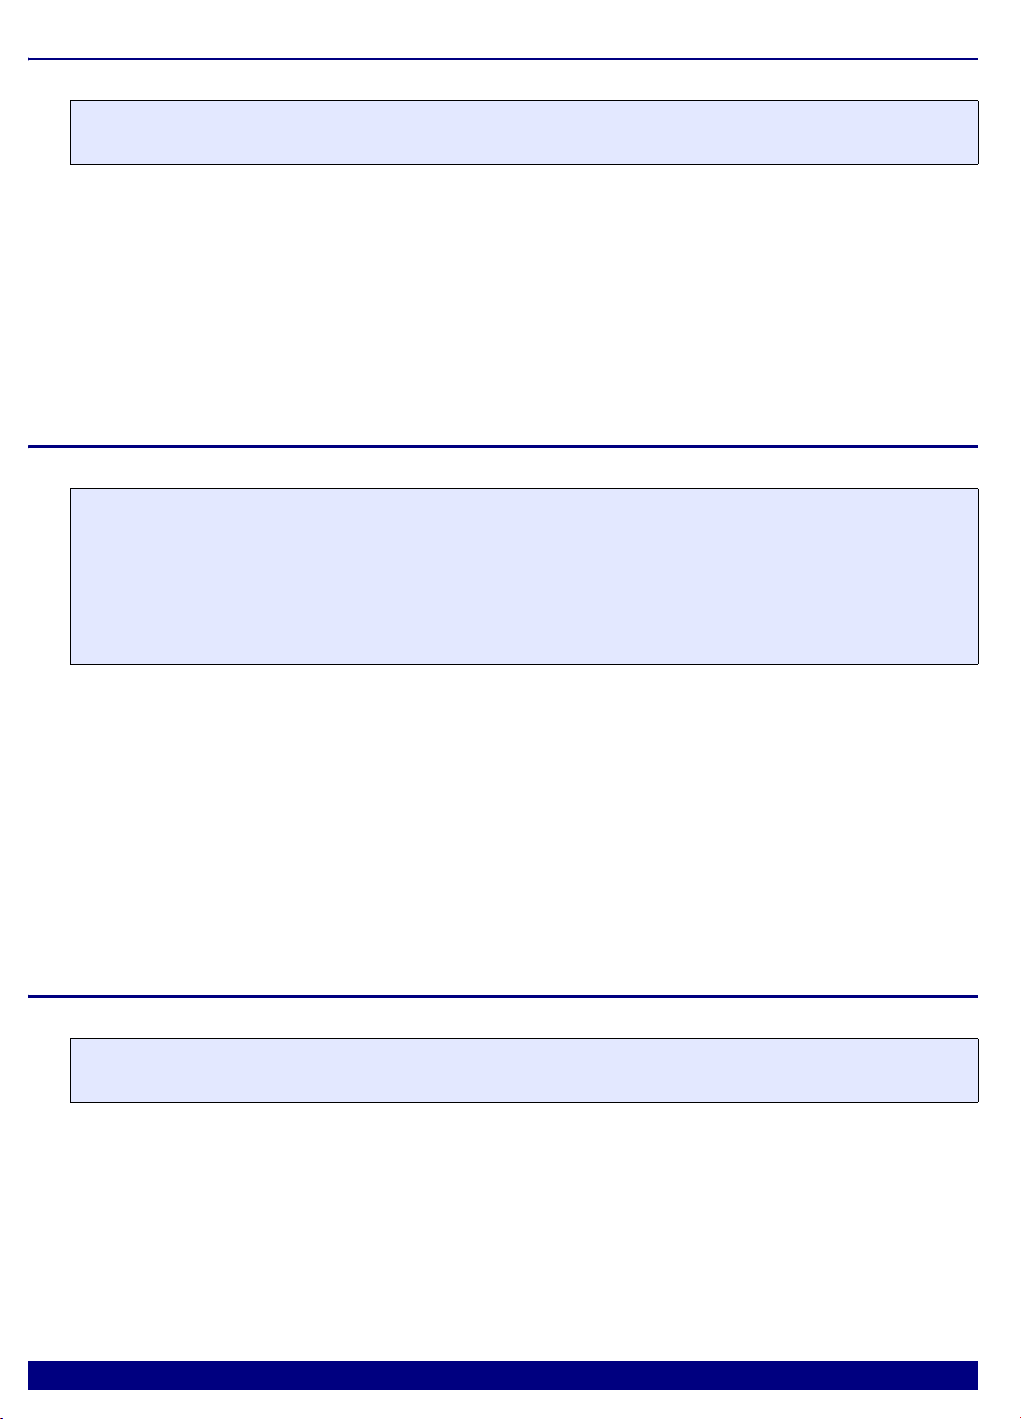
STM8 specific SYStem Settings
SYStem.CPU Select the used CPU
Default: STM8xxx.
Selects the processor type. All of the STM8 MCU cores with SWD Interface are supported.
SYStem.CpuAccess Run-time memory access (intrusive)
Default: Denied.
Format: SYStem.CPU <cpu>
<cpu>:STM8S005K6 |STM8S003K3 |STM8S001J3 |…
Format: SYStem.CpuAccess Enable | Denied | Nonstop
Enable Allow intrusive run-time memory access.
In order to perform a memory read or write while the CPU is executing a
program, the debugger stops the program execution shortly. Each short
stop takes 1 … 100 ms depending on the speed of the debug interface
and on the number of the read/write accesses required.
A red S in the state line of the TRACE32 screen indicates this intrusive
behavior of the debugger.
Denied Do not allow intrusive run-time memory access.
Nonstop Lock all features of the debugger that affect the run-time behavior.
Nonstop reduces the functionality of the debugger to:
• Run-time access to memory and variables
• Trace display
The debugger inhibits the following:
• To stop the program execution
• All features of the debugger that are intrusive (e.g. action Spot for
breakpoints, performance analysis via StopAndGo mode, condi-
tional breakpoints etc.)
STM8 Debugger 1 3
©1989-2019 Lauterbach GmbH
SYStem.MemAccess Real-time memory access (non-intrusive)
Default: Denied.
SYStem.Mode Establish the communication with the target
Default: Down.
SYStem.LOCK Lock and tristate the debug port
Default: OFF
If the system is locked, no access to the debug port will be performed by the debugger. While locked, the
debug connector of the debugger is tristated. The main intention of the SYStem.Lock command is to give
debug access to another tool.
Format: SYStem.MemAccess CPU | Denied
CPU This option is not available at the moment.
Denied Real-time memory access during program execution to target is disabled.
Format: SYStem.Mode <mode>
<mode>: Down
Go
Up
Down Disables the debugger. The state of the CPU remains unchanged.
Go Resets the target and starts execution.
Up Resets the target and stops the CPU at the reset vector.
Format: SYStem.LOCK [ON | OFF]

STM8 Debugger 1 4
©1989-2019 Lauterbach GmbH
SYStem.Option IMASKASM Disable interrupts while single stepping
Default: OFF.
If enabled, the interrupt enable flag of the EFLAGS register will be cleared during assembler single-step
operations. After the single step, the interrupt enable flag is restored to the value it had before the step. It is
turned on to make sure that no interrupt routine is serviced between break and go states.
SYStem.Option IMASKHLL Disable interrupts while HLL single stepping
Default: OFF.
If enabled, the interrupt enable flag of the EFLAGS register will be cleared during HLL single-step
operations. After the single step, the interrupt enable flag is restored to the value it had before the step.
Format: SYStem.Option IMASKASM [ON | OFF]
Format: SYStem.Option IMASKHLL [ON |OFF]

STM8 Debugger 1 5
©1989-2019 Lauterbach GmbH
STM8 specific TrOnchip Command
TrOnchip.VarCONVert Adjust complex breakpoint in on-chip resource
The on-chip breakpoints can only cover specific ranges. If you want to set a marker or breakpoint to a
complex variable, the on-chip break resources of the CPU may be not powerful enough to cover the whole
structure. If the option TrOnchip.VarCONVert is set to ON, the breakpoint will automatically be converted
into a single address breakpoint. This is the default setting. Otherwise an error message is generated.
Format: TrOnchip.VarCONVert [ON | OFF]

STM8 Debugger 1 6
©1989-2019 Lauterbach GmbH
Breakpoints
Software breakpoints
The Microchip STM8 architecture does not support software breakpoints.
On-chip breakpoints for instructions
The STM8 MCUs support a total of two on-chip breakpoint registers which can be used as program
breakpoints to stop and debug the program which executes always in the Flash.
On-chip breakpoints for data
Data breakpoints are used to analyze the read and write accesses to global variables. The data breakpoints
can be triggered with respect to the data address or access type, i.e. read, write or both, or the data value.
The two instruction breakpoints of STM8 MCUs can be used as data breakpoints
In case of an on-chip data breakpoint, every load and store instruction is checked with respect to the
breakpoint address, access type and the value. The data breakpoints are especially useful to find out when
a global variable is written with a certain value. It is not possible to implement a similar breakpoint in software
without affecting the real-time behavior of the system. Since the load and store instructions work on RAM,
data breakpoints always point to addresses on RAM.

STM8 Debugger 1 7
©1989-2019 Lauterbach GmbH
Memory Classes
The following memory access classes are available:
To access a memory class, write the class in front of the address. For example, use D to access the data
memory
The memory class P is used to denote the Flash memory.
Since the STM8 architecture uses a Unified Memory Architecture, the following two examples return the
same results.
Access Class Description
DData
PProgram
Data.dump D:0x00
Data.dump P:0x00
Data.dump D:0x100
Data.dump P:0x100

STM8 Debugger 1 9
©1989-2019 Lauterbach GmbH
Available Tools
CPU
ICE
FIRE
ICD
DEBUG
ICD
MONITOR
ICD
TRACE
POWER
INTEGRATOR
INSTRUCTION
SIMULATOR
STM8AF5268 YES
STM8AF5269 YES
STM8AF5286 YES
STM8AF5288 YES
STM8AF5289 YES
STM8AF528A YES
STM8AF52A6 YES
STM8AF52A8 YES
STM8AF52A9 YES
STM8AF52AA YES
STM8AF6213 YES
STM8AF6213A YES
STM8AF6223 YES
STM8AF6223A YES
STM8AF6226 YES
STM8AF6246 YES
STM8AF6248 YES
STM8AF6266 YES
STM8AF6268 YES
STM8AF6269 YES
STM8AF6286 YES
STM8AF6288 YES
STM8AF6289 YES
STM8AF628A YES
STM8AF62A6 YES
STM8AF62A8 YES
STM8AF62A9 YES
STM8AF62AA YES
STM8AF6366 YES
STM8AF6388 YES
STM8AL3136 YES
STM8AL3138 YES
STM8AL3146 YES
STM8AL3148 YES
STM8AL3166 YES
STM8AL3168 YES
STM8AL3188 YES
STM8AL3189 YES
STM8 Debugger 2 0
©1989-2019 Lauterbach GmbH
STM8AL318A YES
STM8AL31E88 YES
STM8AL31E89 YES
STM8AL31E8A YES
STM8AL3L46 YES
STM8AL3L48 YES
STM8AL3L66 YES
STM8AL3L68 YES
STM8AL3L88 YES
STM8AL3L89 YES
STM8AL3L8A YES
STM8AL3LE88 YES
STM8AL3LE89 YES
STM8AL3LE8A YES
STM8L001J3 YES
STM8L051F3 YES
STM8L052C6 YES
STM8L052R8 YES
STM8L101F1 YES
STM8L101F2 YES
STM8L101F3 YES
STM8L101G2 YES
STM8L101G3 YES
STM8L101K3 YES
STM8L151C2 YES
STM8L151C3 YES
STM8L151C4 YES
STM8L151C6 YES
STM8L151C8 YES
STM8L151F2 YES
STM8L151F3 YES
STM8L151G2 YES
STM8L151G3 YES
STM8L151G4 YES
STM8L151G6 YES
STM8L151K2 YES
STM8L151K3 YES
STM8L151K4 YES
STM8L151K6 YES
STM8L151M8 YES
STM8L151R6 YES
CPU
ICE
FIRE
ICD
DEBUG
ICD
MONITOR
ICD
TRACE
POWER
INTEGRATOR
INSTRUCTION
SIMULATOR
Other manuals for STM8
1
Table of contents
Other Lauterbach Computer Accessories manuals

Lauterbach
Lauterbach TRACE32 User manual

Lauterbach
Lauterbach MMDSP User manual

Lauterbach
Lauterbach AVR8 User manual

Lauterbach
Lauterbach XC800 User manual

Lauterbach
Lauterbach TRACE 32 Original operating instructions

Lauterbach
Lauterbach C6000 User manual

Lauterbach
Lauterbach PowerTrace Serial User manual

Lauterbach
Lauterbach TRACE32 User manual

Lauterbach
Lauterbach TRACE32-ICD User manual

Lauterbach
Lauterbach TRACE32-ICD User manual


