Lauterbach TRACE 32 Original operating instructions

TRACE 32
In-Circuit Debugger
Quick Installation
and
Tutorial

TRACE32: In-Circuit Debugger (ICD)
August 1998
Copyright (C) 1989-1998 Lauterbach Datentechnik GmbH
All rights reserved. No part of this publication may be reproduced, transmitted, transcribed, stored in a
retrieval system or translated into any language in any form by any means without the written permission of
Lauterbach Datentechnik GmbH.
TRACE32 is a registered trademark of Lauterbach Datentechnik GmbH.
Lauterbach Datentechnik GmbH
Fichtenstrasse 27
D-85649 Hofolding
Germany
telephone: ++49 8104/8943-50
facsimile: ++49 8104/8943-49
e-mail: support@lauterbach.com

In-Circuit Debugger iii Table of Contents
Table of Contents
TRACE32-ICD Preface ________________________ Page PRE-1
What is an In-Circuit Debugger? PRE-1
About this Guide PRE-2
Where to Look for More Information PRE-4
Quick Installation for TRACE32-ICD _____________ Page INST-1
About the Installation Guide INST-1
Product Overview INST-2
System Concepts INST-4
Host Interfaces INST-4
The Debug Module INST-11
Hardware Installation INST-12
Installation with ISA Interface Card (PODPC) INST-12
Installation with Parallel Interface Card (PODPAR) INST-15
Installation with Ethernet Interface (PODETH) INST-18
Software Installation INST-20
PODPC or PODPAR on MS-WINDOWS (PC) INST-21
PODETH on MS-WINDOWS (PC) INST-26
PODETH on SunOS, Solaris (SUN) INST-29
PODETH on HP-UX 10.X (HP-9000) INST-31
Troubleshooting INST-33

Table of Contents iv In-Circuit Debugger
Tutorial for TRACE32-ICD _____________________ Page TUT-1
About the Tutorial TUT-1
Start TRACE32-ICD TUT-2
Setup the Application Properties TUT-3
The Online Help TUT-4
Setup the Debug Environment TUT-7
Batch Jobs TUT-11
The User Interface TUT-13
How to Debug the Program TUT-15
How to Display and Modify CPU Registers TUT-25
How to Display and Modify the Special Function Registers TUT-27
How to Display and Modify Memory TUT-29
How to Set Breakpoints TUT-31
Software Breakpoints TUT-31
Breakpoints in ROM, Flash, EEPROM TUT-35
Breakpoints on Data Accesses TUT-36
Onchip Breakpoints (Overview) TUT-38
Display and Modify HLL Variables TUT-39
Format HLL-Variables TUT-42
Exit TRACE32 TUT-44

1 TRACE32-ICD Preface
TRACE32-ICD Preface
What is an In-Circuit Debugger?
Most CPUs provide an onchip debug system implemented in the CPU. Typical examples
are the BDM interface from Motorola, the JTAG interface for the ARM7 or the JTAG
interface for the PowerPC family. The debug interface usually requires a few CPU pins that
are used for the communication between the onchip debug system and a third party
development tool. The onchip debug system provides the following basic features:
• Read/write memory
• Read/write CPU register
• Single step and real time execution
• Hardware breakpoints and trigger features (not supported by all CPUs)
The In-Circuit Debugger TRACE32-ICD uses these basic features of the onchip debug
system to provide a powerful debug tool that offers:
• Easy high-level and assembler debugging
• Display of internal and external peripherals on a logical level
• Onchip break and trigger support
• RTOS awareness
• Flash programming
• Powerful script language
• Multiprocessor debugging
TRACE32-ICD Preface 2
TRACE32-ICD is part of the TRACE32 microprocessor development tool product line.
This product line also includes a trace extension for some ICD-Debuggers and the full
featured In-Circuit Emulators TRACE32-ICE for all CISCs and TRACE32-FIRE for the fast
RISC processors.
All TRACE32 development tools use a common user interface. So the look and feel stays
the same no matter what system you are using.
About this Guide
The purpose of this guide is:
• To get your In-Circuit Debugger installed.
(See Quick Installation for TRACE32-ICD).
• To help you to write the proper start up sequence.
(See
Tutorial for TRACE32-ICD
).
• To make you familiar with the basic functions of TRACE32-ICD.
(See
Tutorial for TRACE32-ICD
).
In-Circuit Debugger
TRACE32-ICD In-Circuit Emulator
TRACE32-ICE/FIRE

3 TRACE32-ICD Preface
Since an In-Circuit Debugger always needs a working target system, we also offer
Simulators for some major CPU families, that allow you to get familiar with our debugging
tools even before your target hardware is available.
Simulator:
A simulator can run without a target processor. The work of the CPU is simulated by
software. So real time debugging is not possible.
You can download our simulators from our web page http://www.lauterbach.com
or from our CD
TRACE32 Product Information
by using the link Download Demo
Software in the main menu.

TRACE32-ICD Preface 4
Where to Look for More Information
The common TRACE32 user interface contains a detailed Online-Help, that offers the
most current description of all debug features.
If you have installed the TRACE32 software The Online Help on how to start the Online
Help.
The Online Help can also be called without installing the TRACE32 software:
• On WINDOWS systems simply call the help file \DOS\MAN.HLP on the CD.
• Or use the PDF file TRACE32-MANUAL.PDF in the PDF directory of the CD to open
the Online help in PDF format.
The following books contain the most relevant information for the use of TRACE32-ICD:
ICD Targets
Since the Quick Installation for TRACE32-ICD and the Tutorial for TRACE32-ICD are
generic for all supported CPUs, we strongly recommand to read the ICD Target Guide for
your CPU. This guide describes all CPU specific settings and features.
ICD Debugger User´s Guide
ThisbookprovidesinformationaboutthebasicconceptsfortheIn-CircuitDebuggersandthe
other PODBUS devices (e.g. ICD Trace, ICD Risc Trace, EPROM Simulator).

5 TRACE32-ICD Preface
Reference
In the Reference book you can find an alphabetical list of all debug commands for the
TRACE32 development tools and a detailed description of their syntax and function. All
commands not available for TRACE32-ICD are marked with (E−TRACE32-ICE only) or
(F− TRACE32-FIRE only).
The following books contain information for advanced users.
Installation Guide General Installation Guide for all TRACE32
development tools.
Operation System User´s Guide Gives an overview of the features for the
TRACE32 Operating System e.g. windows
management, file management, printer etc.
Operation System Reference Provides a detailed description of the
TRACE32 Operating System e.g. windows
management, file management, printer etc.
Practice User´s Guide Introduction into the batch language
PRACTICE.
Practice Reference Alphabetical list of all PRACTICE com-
mands.

1 Quick Installation for TRACE32-ICD
Quick Installation for TRACE32-ICD
About the Installation Guide
This Installation Guide describes the basic installation and configuration for all
TRACE32-ICD In-Circuit Debuggers that are implemented using their onchip debug
interface. Typical examples for onchip debug interfaces are BDM, JTAG, ONCE …
For the installation and configuration of the ROM monitors or for special system
configurations (e.g. additional devices, multiprocessor debugging etc.) refer to the
Installation Guide.

Quick Installation for TRACE32-ICD 2
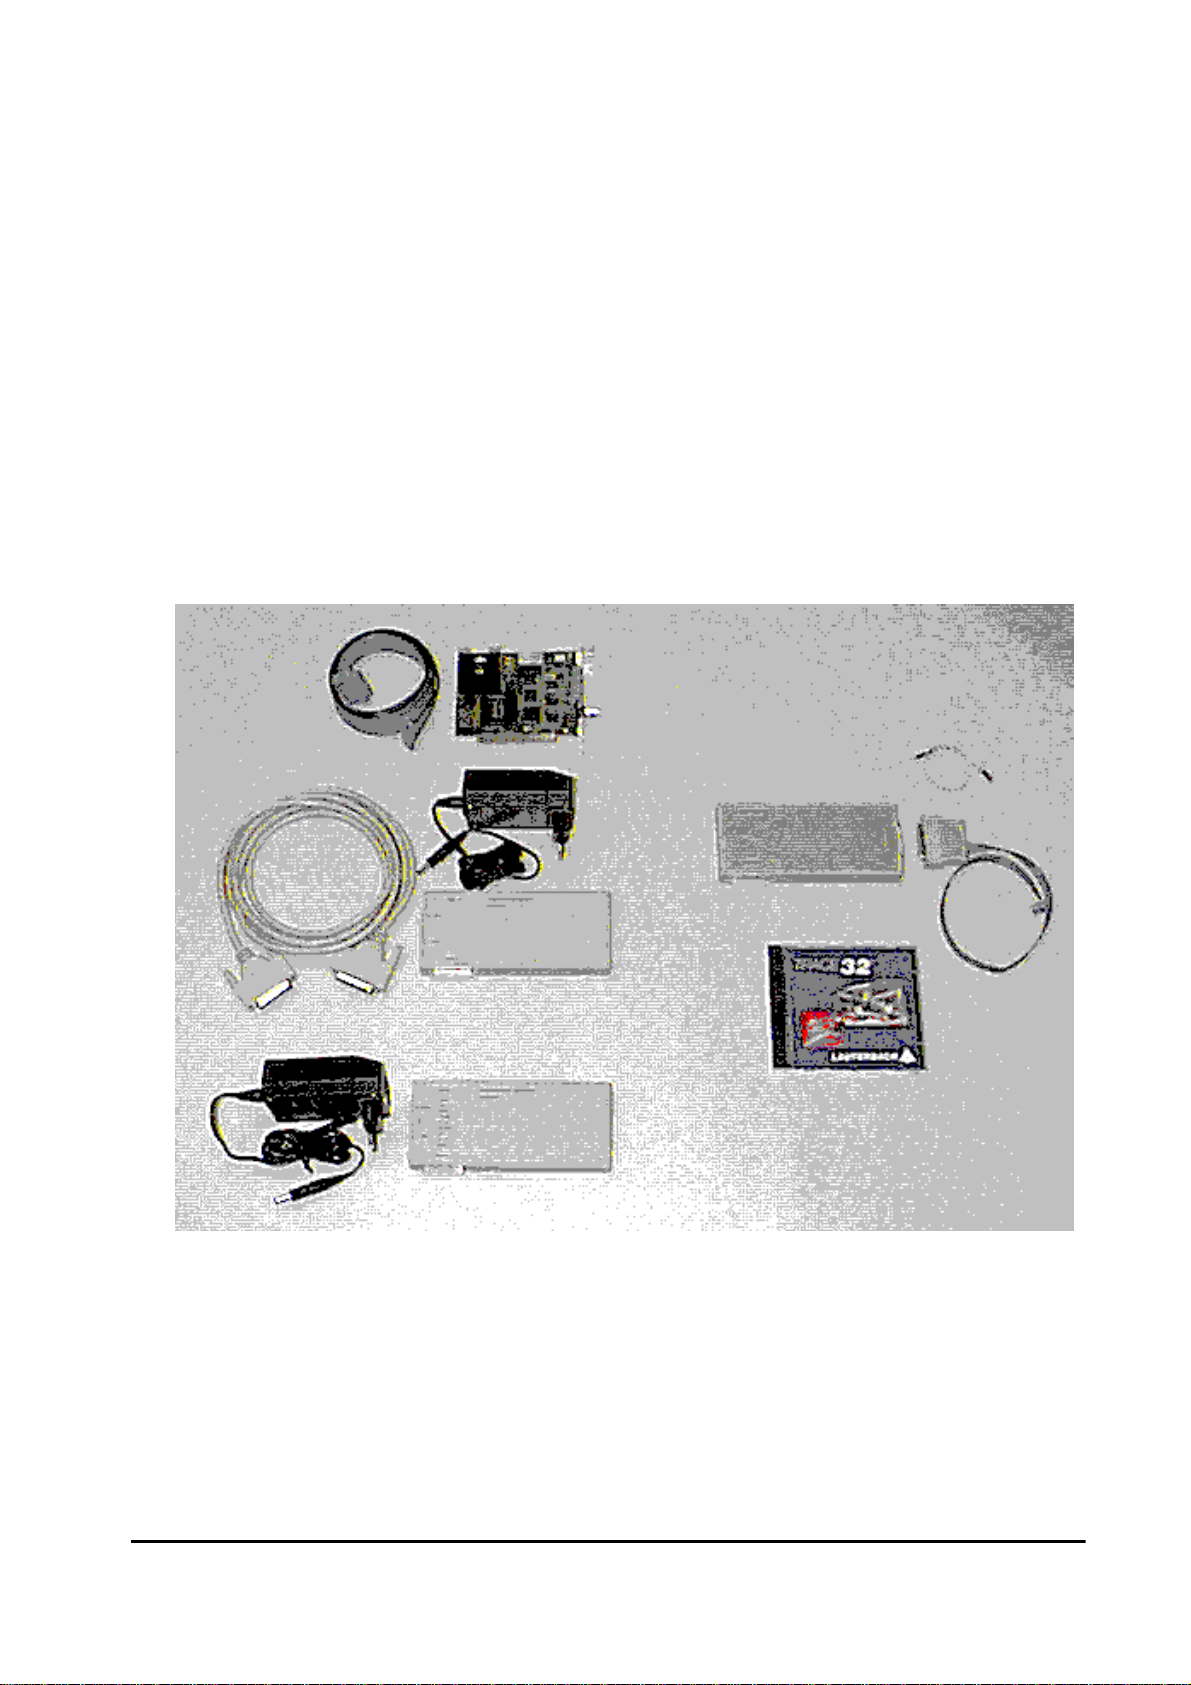
Product Overview
A complete TRACE32-ICD configuration consists of:
• A PODBUS interface to the host (PODPC, PODPAR or PODETH)
•A Debug Module
Lauterbach offers two different debug modules: the Standard Debug Module and the
Power Debug Module. Both modules can be used all CPUs that are supported by
TRACE32-ICD.
Some CPUs like the PPC603 or the MPC740/750 need the Power Debug Module,
since their complex debug interface requires the transfer of huge amounts of data. To
guarantee a fast data transfer rate the Power Debug Module has its own RISC
controller.
• A Debug Cable
The Debug Cable connects the Debug Module to the debug interface on your target.
For the connector pinout of your debug interface refer to the
ICD Target Guide
for your
CPU.
3 Quick Installation for TRACE32-ICD
• A Clock Cable
By default TRACE32-ICD uses a fixed clock to run the debug interface. A clock range
from 100KHz up to 5 MHz can be used.
We also provide a clock cable to allow you the use of the divided CPU clock as clock for
the debug interface. The relation between the CPU clock and the debug interface clock
is specific for your CPU. Refer to your
ICD Target Guide
for detailed information. The
use of the divided CPU clock has the following advantages:
• The max. speed for the debug interface can be used. However we recom-
mend 10MHz as the max. speed.
• The clock for the debug interface is automatically adapted if the CPU clock is
changed by your application program.
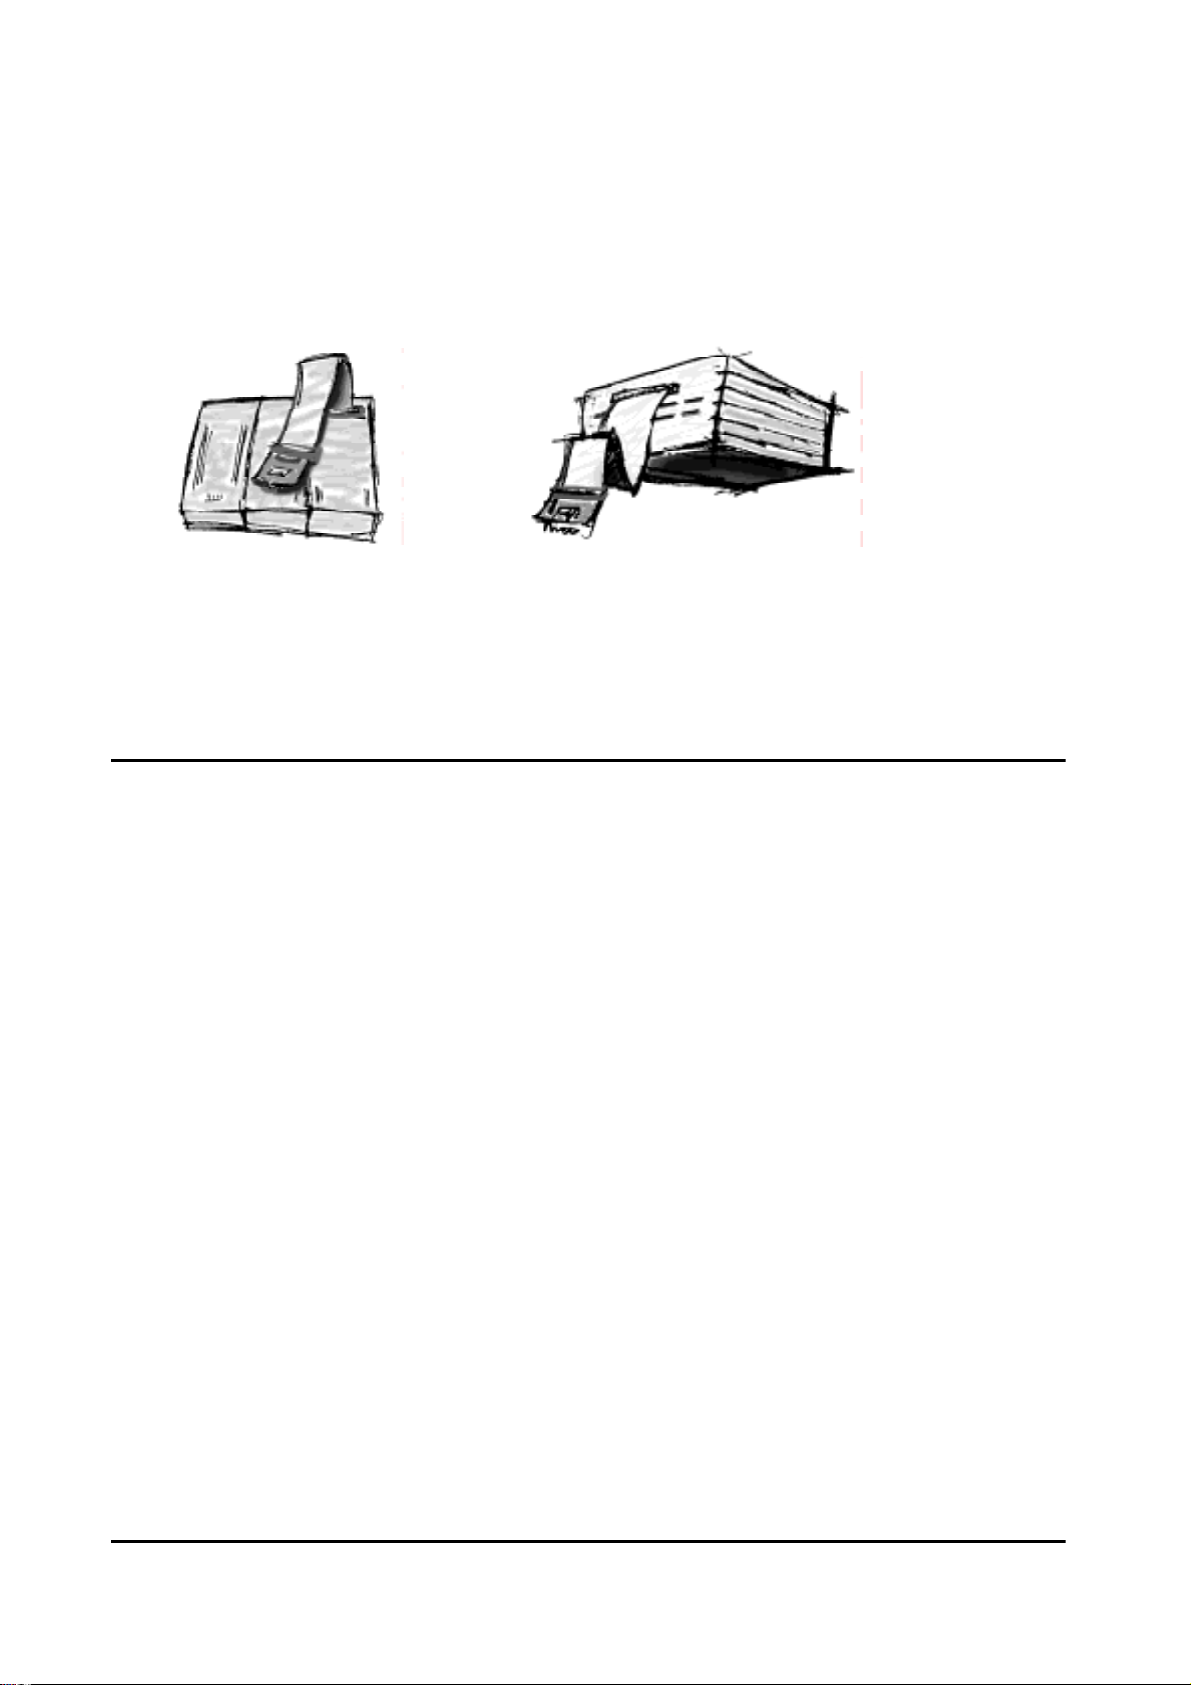
•The TRACE32 debugger software
TRACE32
Debugger Software
Debug Cable
to Target
PODBUS Ethernet Converter (PODETH)
PODBUS Interface Card for ISA (PODPC)
PODBUS Interface for Printer Port (PODPAR) Debug Module
Clock Cable

Quick Installation for TRACE32-ICD 4
System Concepts
The TRACE32 Debugger Software runs on a host (PC or workstation). The host
communicates with the target via the Debug Module.
• For the fast communication between the host and the debug module a special bus
interface is used: PODBUS (Processor Oriented Device Bus).
An advantage of the PODBUS is that your debug environment can be easily expanded
by additional PODBUS devices, to provide a powerful tool configuration. Additional
PODBUS devices are ICD Trace, ICD RISC Trace, EPROM Simulator, Stimuli
Generator etc.
• The connection between the target and the debug module is done by a processor
specific debug interface cable.
Host Interfaces
Three different interfaces are available to connect the host system to the PODBUS:
• PODPC interface card for ISA bus
•PODPAR converter for printer port (LPTx:)
•PODETH converter to Ethernet (Twisted Pair)
Host ------------------------- Debug Module -------------------------------- Target
PODBUS Debug Interface

5 Quick Installation for TRACE32-ICD
PODBUS
DEBUG
MODULE
Target
PC
ISA card
PODPC
clock
cable
System configuration with ISA card (PODPC)
parallel
PODPAR
trigger
in/out
standard
parallel
cable
AC/DC-adapter
supply
power
DEBUG
MODULE
Target
Printer
Port
(LPTx:)
PC
PODBUS
clock
cable
System configuration with printer port interface (PODPAR)
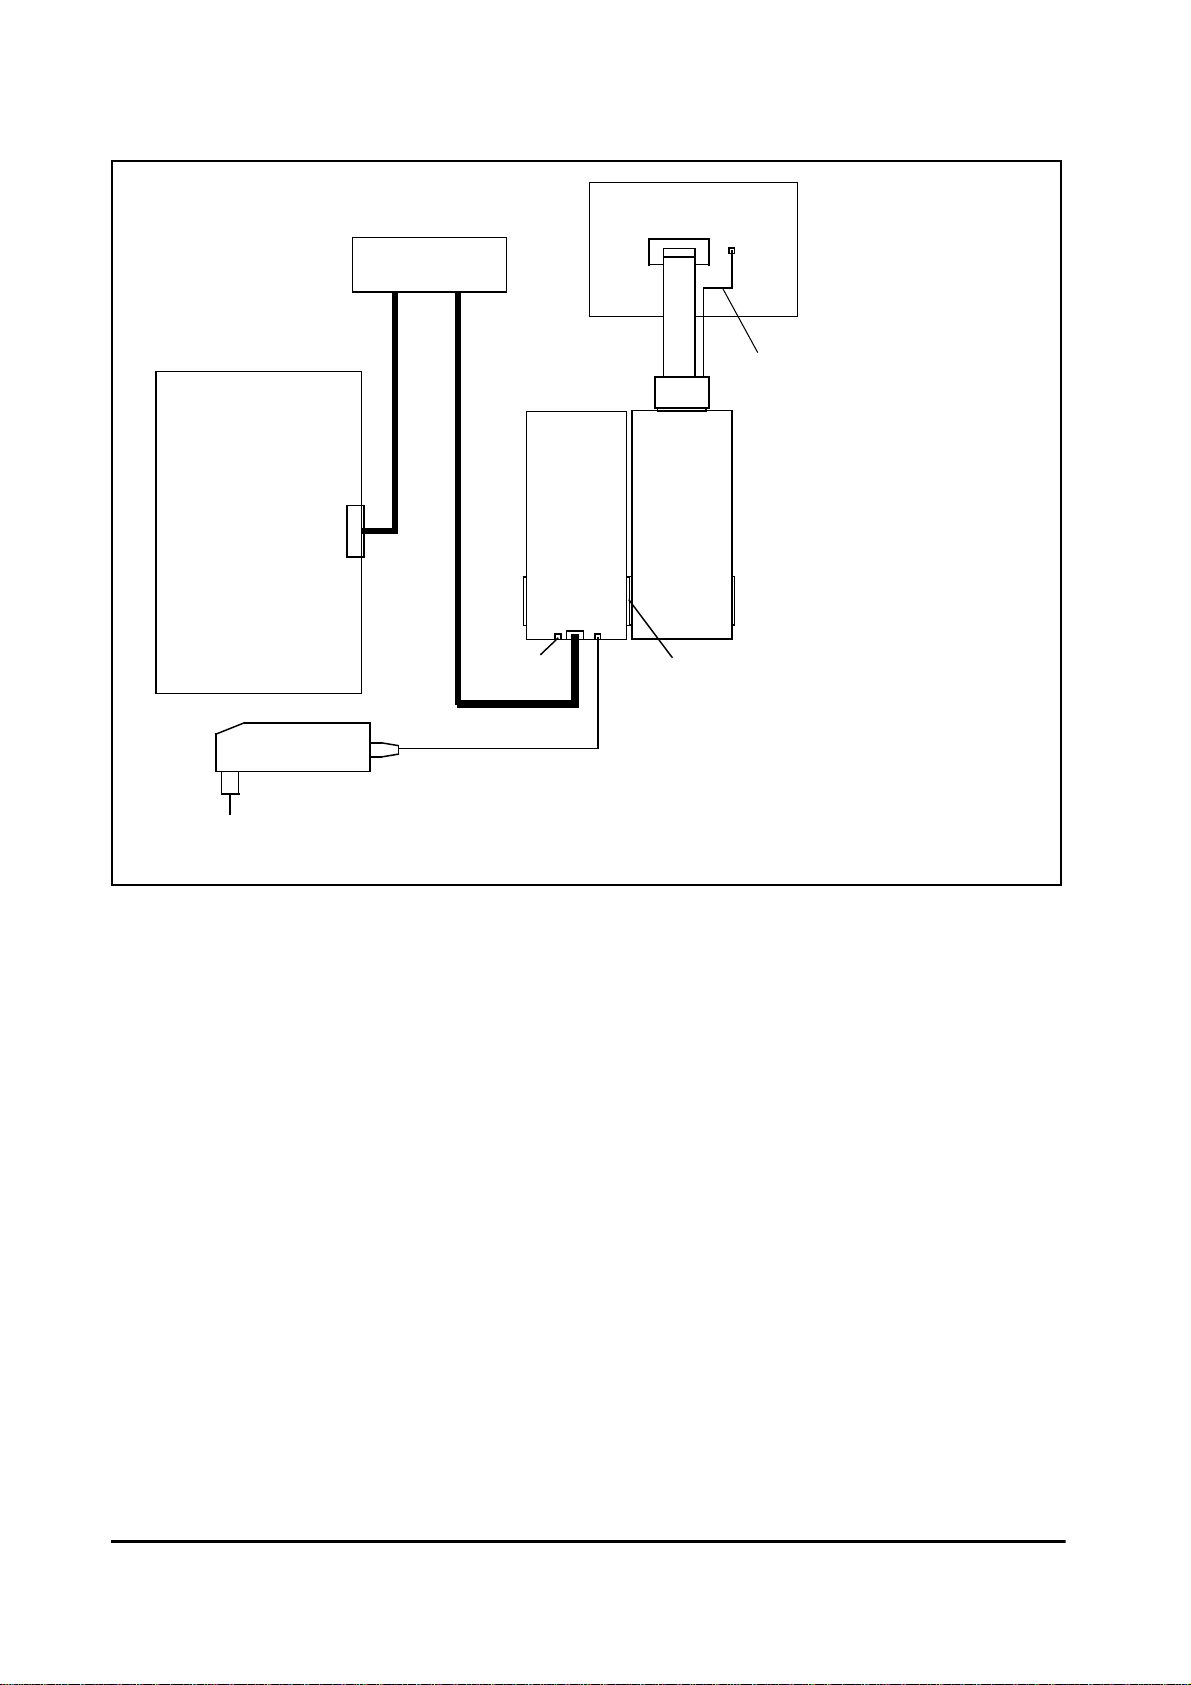
Quick Installation for TRACE32-ICD 6
Workstation
PC or
PODETH
Ethernet
AC/DC-adapter
trigger
in/out
HUB
DEBUG
MODULE
Target
PODBUS
Ethernet 10 MHz, Twisted Pair
clock
cable
System configuration with ethernet interface (PODETH)

7 Quick Installation for TRACE32-ICD
PODPC Interface Card for ISA bus
When a PODPC interface card is used no additional power supply is required for
additional PODBUS devices.
Address select jumpers on the ISA card:
JP3 must always be on.
The BNC connector is used to input/output a trigger signal to/from the Debug Module.For
more information on this Trigger feature refer to Trigger in the
ICD Users Guide
.
JP0 JP1 JP2 Address (hex) Address (dec)
on on on 350 848
off on on 250 592
on off on 260 608
off off on 280 640
on on off 300 768
off on off 330 816
on off off 340 832
off off off 390 912
Jumper
PODBUS
ISA BUS
BNC connector
trigger in/out
Quick Installation for TRACE32-ICD 8
PODPAR Converter for Printer Port (LPTx:)
External power supply is required for the PODPAR (Plug: 7-9V; inner negative, outer
positive). Please use only the enclosed AC/DC-Adapter.
The BNC connector is used to input/output a trigger signal to/from the Debug Module.For
more information on this Trigger feature refer to Trigger in the
ICD Users Guide
.
trigger in/out
power supply
PODBUS OUT
Printer Port
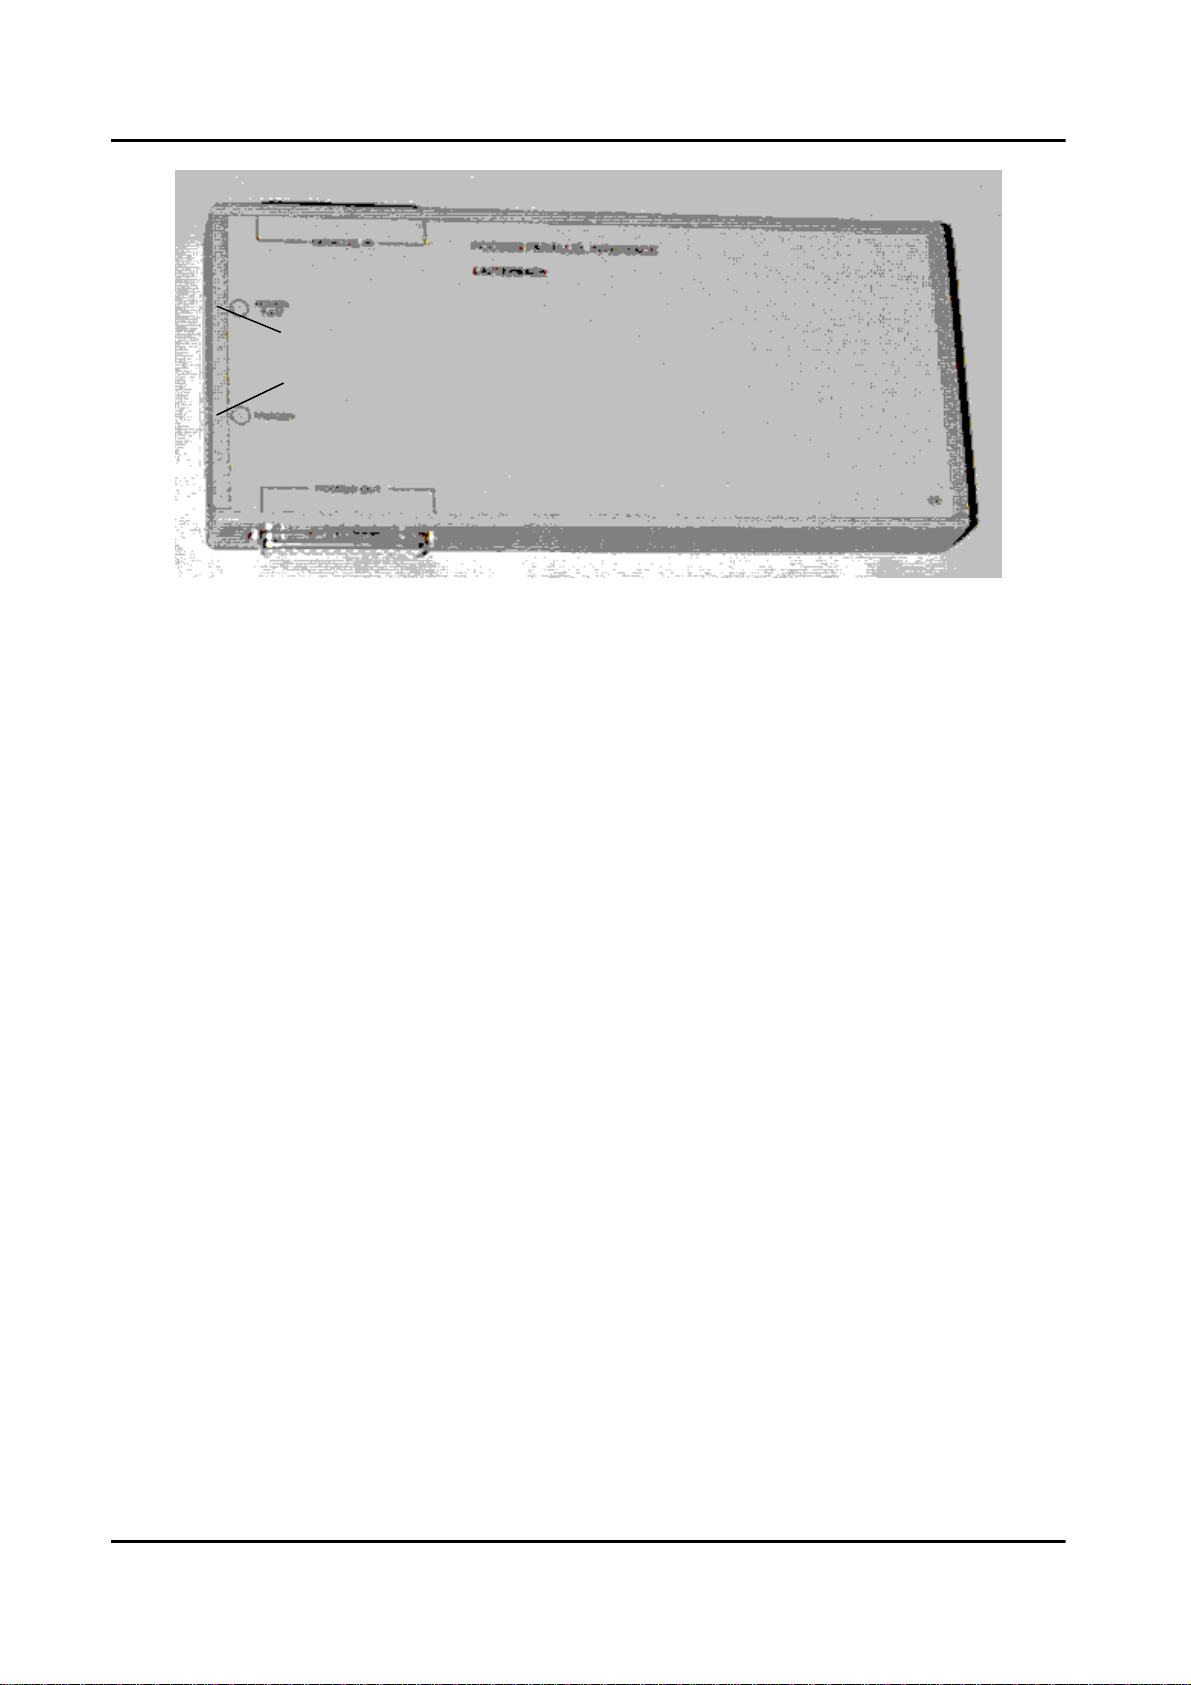
9 Quick Installation for TRACE32-ICD
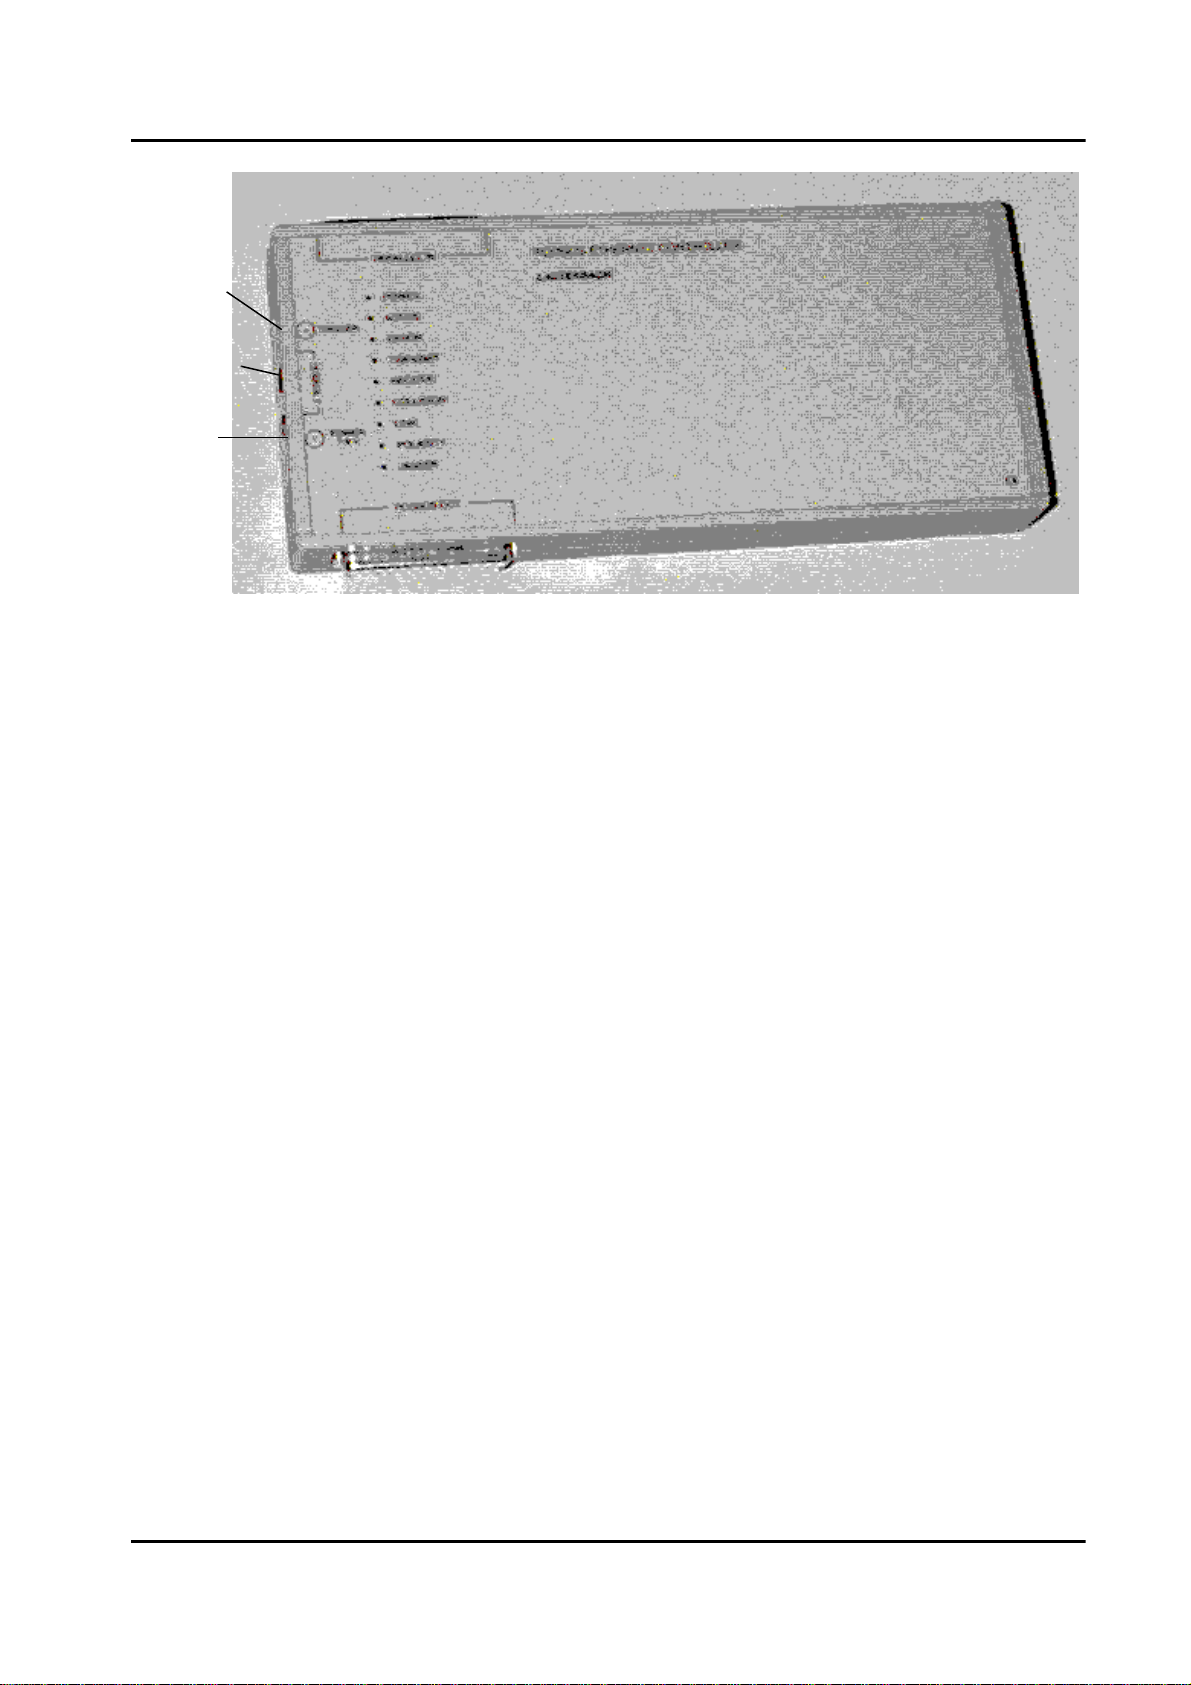
PODETH Converter to Ethernet (Twisted Pair)
The PODBUS controller for ethernet contains both, an ethernet connector for twisted pair
and a printer port interface, to provide a flexible host connection.
External power supply is required for the PODETH (Plug: 7-9V; inner negative, outer
positive). Please use only the enclosed AC/DC-Adapter.
The BNC connector is used to input/output a trigger signal to/from the Debug Module. For
more information on this Trigger feature refer to Trigger in the
ICD Users Guide
.
Printer Port
trigger
in/out
power
supply
PODBUS OUT
Ethernet

Quick Installation for TRACE32-ICD 10
The LEDs transmit, receive, collision, link, polarity, jabber indicate the status of the
integrated Ethernet transceiver MC68160.
LEDs
POWER External power is supplied.
ACTIVE On if device is active, flashes if device is not used.
ERROR On if device is active, flashes if device is not used. In error
case an error code will be pulsed. See the
ICD Debugger
User Guide
for further information.
TRANSMIT Transmit activity.
RECEIVE Receive activity.
COLLISION Collision activity.
LINK Twisted pair link integrity.
POLARITY Twisted Pair Polarity Error (receiver inputs TPRX+, TPRX-
are reversed).
JABBER Twisted Pair Jabber condition detected.
11 Quick Installation for TRACE32-ICD
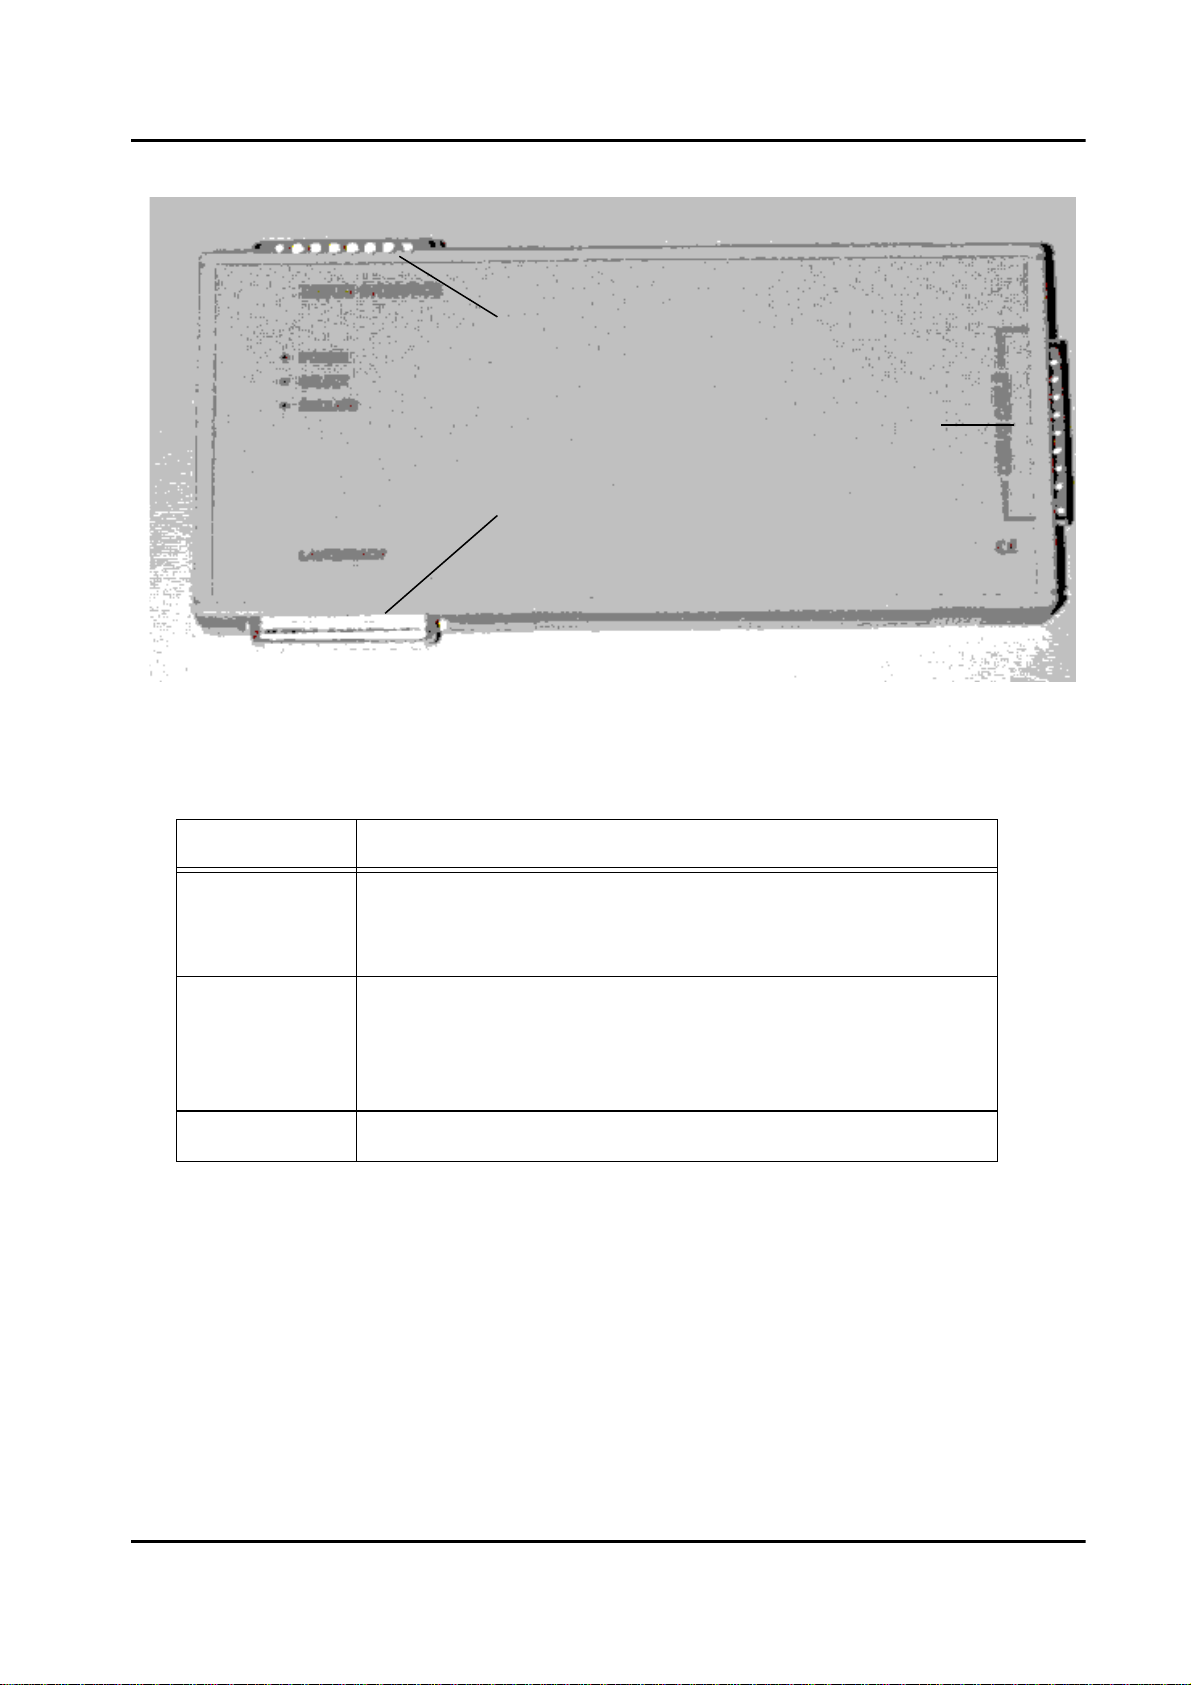
The Debug Module
Some processor types like MPC740/750, PPC603 … require a Power Debug Module. But
there is no difference in using this module.
LEDs
POWER Power is applied to the debug module. Power will be
supplied via the PODBUS. Therefore power is on when
the host interface is on.
SELECT (Optionally) It is possible to connect more than one device
to the PODBUS. Each device can be independently
controlled by the debugger software. The LED is on when
this device is currently controlled.
EMULATE The user program is running on the target.
PODBUS IN
connector to host interface
PODBUS OUT
connector for additional
devices (optional)
connector for
debug cable
Table of contents
Other Lauterbach Computer Accessories manuals

Lauterbach
Lauterbach PowerTrace Serial User manual

Lauterbach
Lauterbach TRACE32 User manual

Lauterbach
Lauterbach C6000 User manual

Lauterbach
Lauterbach TRACE32 User manual

Lauterbach
Lauterbach AVR8 User manual

Lauterbach
Lauterbach MicroBlaze Debugger User manual

Lauterbach
Lauterbach TRACE32-ICD User manual

Lauterbach
Lauterbach STM8 User manual

Lauterbach
Lauterbach XC800 User manual

Lauterbach
Lauterbach dsPIC33 User manual


