1
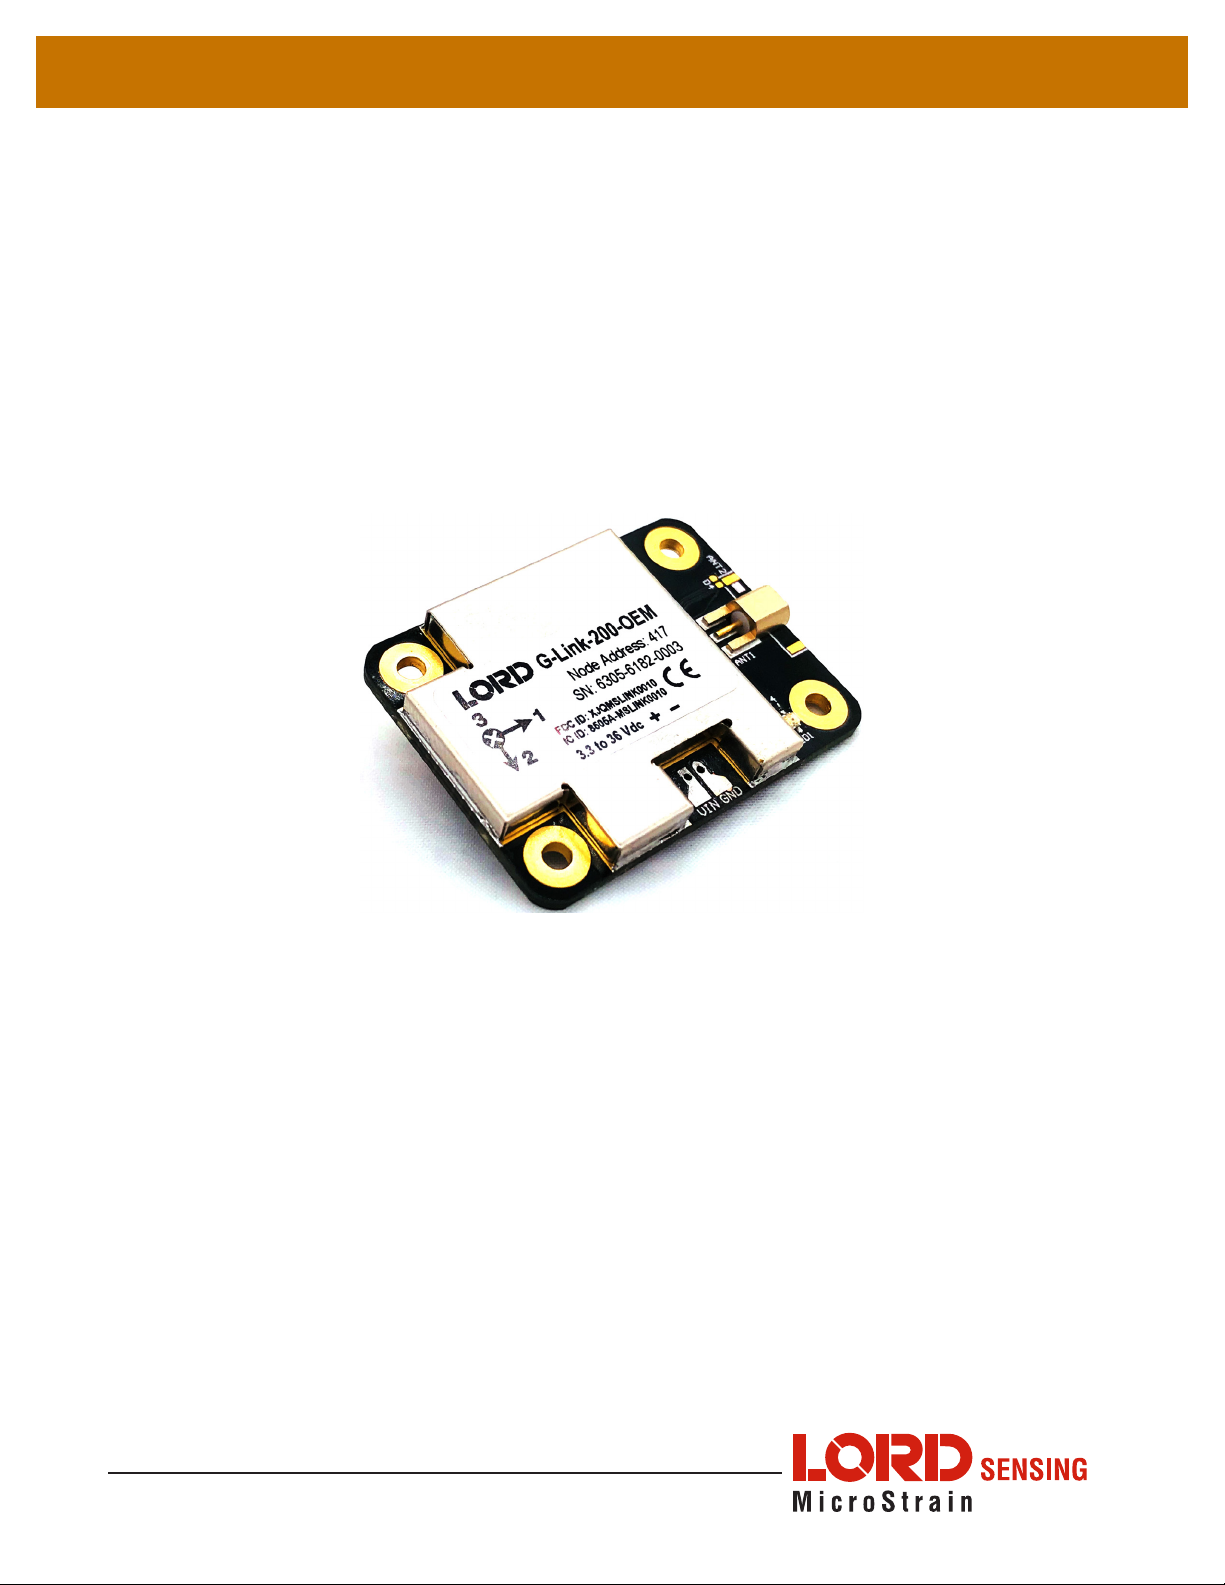
G-Link-200-OEM USER MANUAL
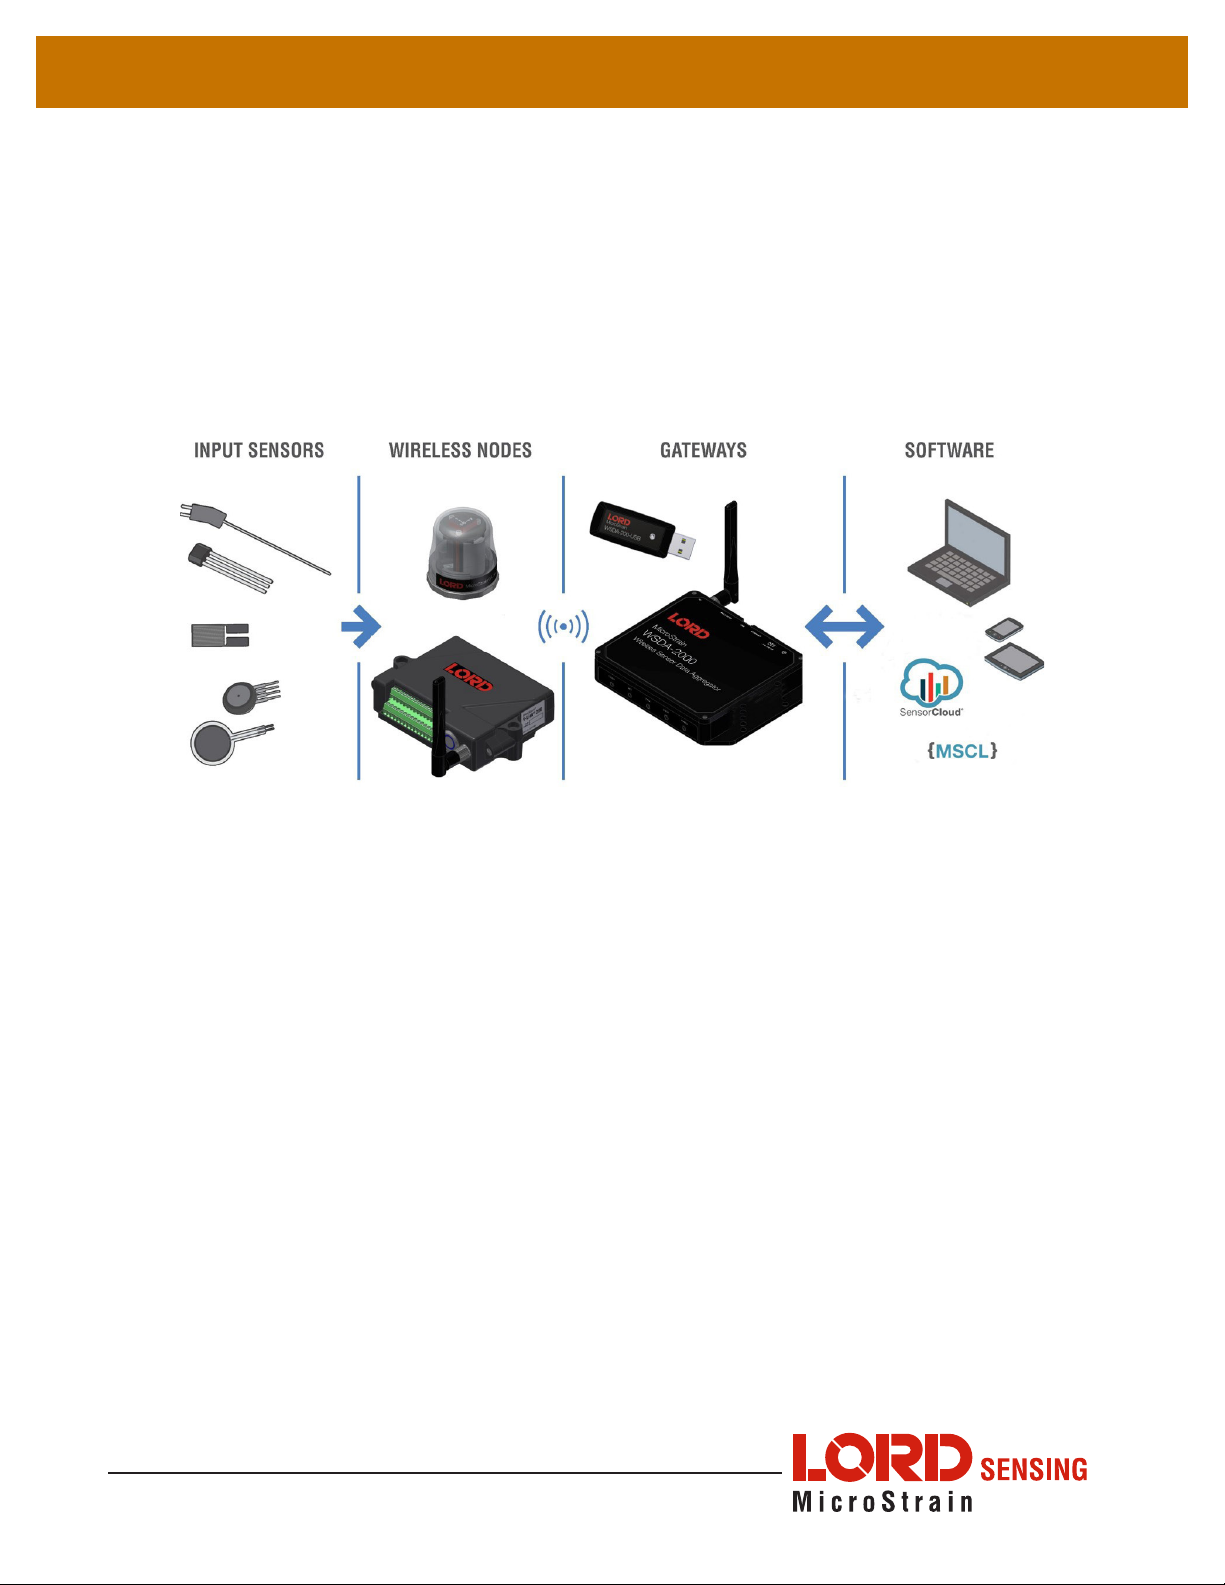
1. Wireless Sensor Network Overview
The LORD Sensing Wireless Sensor Network is a high-speed, scalable, sensor data
acquisition and sensor networking system. Each system consists of wireless sensor interface
nodes, a data collection gateway, and full-featured user software platforms based on the
LORD Sensing Lossless Extended Range Synchronized (LXRS) and data communications
protocol. Bi-directional wireless communication between the node and gateway enables
sensor data collection and configuration. Gateways can be connected locally to a host
computer or remotely via local and mobile networks. Some gateways also feature analog
outputs for porting sensor data directly to stand-alone data acquisition equipment.
The selection of available nodes allows interface with many types of sensors, including
accelerometers, strain gauges, pressure transducers, load cells, torque and vibration sensors,
magnetometers, 4 to 20mA sensors, thermocouples, RTD sensors, soil moisture and humidity
sensors, inclinometers, and orientation and displacement sensors. Some nodes come with
integrated sensing devices such as accelerometers. System sampling capabilities include
lossless synchronized sampling, continuous and periodic burst sampling, and data logging.
A single gateway can coordinate many nodes of any type, and multiple gateways can be
managed from one computer with the SensorConnect and SensorCloud software platforms.
Integration to customer systems can be accomplished using OEM versions of the sensor
nodes and leveraging the LORD Sensing data communications protocol.
Common wireless applications of LORD Sensing Sensing Systems are strain sensor
measurement, accelerometer platforms, vibration monitoring, energy monitoring,
environmental monitoring, and temperature monitoring.