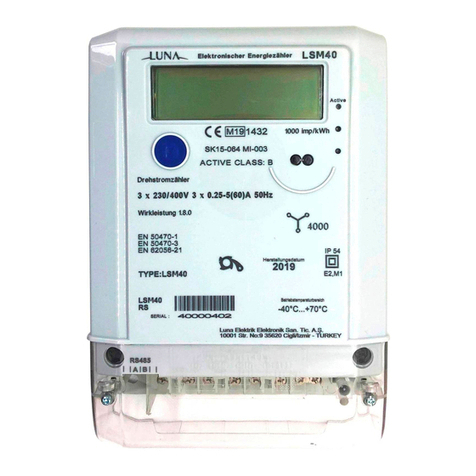
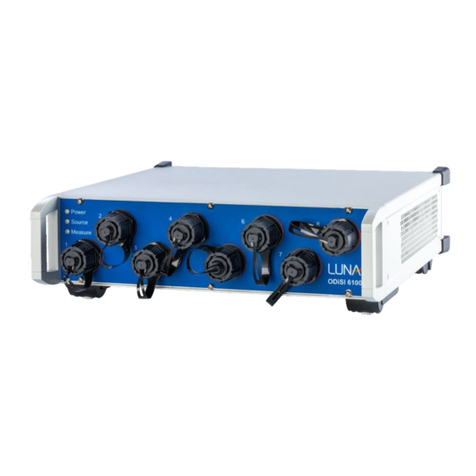
Luna 4600 User manual

Optical Backscatter
Reflectometer 4600
User Guide

Many regions prohibit the disposal of WEEE (Waste
Electrical and Electronic Equipment) in the normal waste
stream, to comply with the Restriction of Hazardous
Substances(RoHS)releasedintotheenvironment.Please
contactyourlocalwasteauthorityforinstructionsonproper
recyclingofthe electronicproduct(s)described in this User
Guide.
Optical Backscatter Reflectometer Model 4600
Versions: User Guide 6, OBR 4600 Software 3.12.0
© 2013
Luna
T
echnologies
3157 State
St
reet
Blacksburg, VA 24060
Phone: (540) 961-5190
Fax: (540) 961-5191
E-mail: solutions@lunatechnologies.com
Web: www.lunatechnologies.com
No portion of this publication may be reproduced or transmitted by any means
without the written permission of Luna
T
echnologies,
a division of Luna Innovations Incorporated.

3
Contents
1. System Overview 1
The Control Software 2
Time Domain Data 4
Frequency Domain 4
Frequency Domain Resolution 5
2. Assembly and Startup 7
Components List 7
Setting up the OBR 11
Initial Startup 12
3. Software Guide 17
Window Features 18
System Control 19
Data Processing
21
Display Options
21
Graphs 23
The Menu Bar
27
The File menu
27
The Edit menu
28
The Options menu 28
The Tools menu
30
The Help menu
31
4. Performing Measurements 33
Setting Up 33
Aligning the OBR Optics 34

4
Contents
Instrument Configuration
34
Calibrating the System
35
Calibration Files
36
Conditions that Require Calibration
36
Consideration Prior to Calibrating
36
The Calibration Procedure
37
Checking the Calibration
38
Storing Multiple Calibrations
39
Acquiring Data
40
Single-Scan Mode
41
Continuous Scan Mode
43
Fast Scan Mode
44
Spot Scan Mode
44
Extended Range Spot Scan Mode
46
Frequency Domain Windowing
47
Distributed Sensing Measurements
48
Temperature Change and Strain Coefficients 49
Distributed Sensing Technique
51
Gauge Length
52
Distributed Sensing Examples
54
5. Data Processing and Display 59
Displaying Multiple Traces
59
Moving Data in Local Memory
59
Displaying Stored Data
60
Trace Details
61
Saving and Loading Data Files
62
Saving Data
62
Loading Saved Data
65

Optical Backscatter Reflectometer 4600 5
User Guide
Spreadsheet File Data 66
Displaying Two Parameters in Lower Graph 66
Manipulating Plots 67
Updating Lower Graph 67
Parameter Selection 68
Scaling Plot Axes 69
Autoscaling 69
Manual scaling 70
Using zoom tools 70
Using Cursors, Legends and Other Buttons 72
Cursors 72
Legend 74
Adjusting Group Index 75
Data Decimation 75
Adjusting Spatial Resolution 76
Printing Graphs 76
6. LightPath Analysis Software Guide 77
LightPath Analysis Tutorial
77
Adjusting a Parameter Configuration File 79
Loading a File 80
Data Display 81
Changing Data Processing Parameters and Tolerances 82
Why a Feature Failed 84
Editing General Tolerances 85
Saving LightPath Files 86
Changing from a Configuration File to a Reference File 87
Editing Feature-Specific Tolerances 88
Comparing a New Trace to the Reference 91

6
Contents
Viewing Segment Details
91
Comparing a Failing Trace to the Reference 93
Comparing Traces Using the Trace Comparison Window 93
Editing a Reference Trace: Processing Parameters and General Tolerances 94
Setting the Maximum Device Length
95
Resetting the Default Parameters
96
Suggested Setup and Use
97
Description of Processing Parameters and Tolerances 97
Characteristic Length (m)
98
Drop Length (m)
99
Feature Extract Length (m)
100
Peak Detect Ratio (lin)
101
Peak Dead Zone (m)
102
Drop Detect Ratio (lin)
103
Integration Length (m)
104
Return Loss Type
105
Peak Tolerance (dB)
106
Drop Tolerance (dB)
107
Loss Tolerance (dB)
108
Splice Loss Tolerance (dB)
109
Location Tolerance (m)
110
Maximum Length (m)
111
Remote Commands
111
Remote Commands Unique to LPA
112
7. Controlling the OBR Remotely 119
Prerequisites for Remote Control Setup
119
Remote Control Setup Configuration
120
Remote Control Commands for the OBR
120

Optical Backscatter Reflectometer 4600 7
User Guide
Standard Commands 121
System Level Commands 124
Configuration Commands 132
Data Capture and Retrieval Commands 144
Alphabetical Command Summaries 163
8. Measurement Theory 173
Fiber Optic Interferometry 173
Optical Network for OBR 174
Fiber Interferometry: References 177
Resolution Bandwidth Calculations 177
Spatial Resolution Calculations 178
Integration Width (or Sensing Range) 178
Return Loss and Differential Loss 178
Standard Parameter Calculations 179
Time Domain Amplitude and Amplitude (dB) 180

8
Contents
Time Domain Linear Amplitude
181
Time Domain Polarization States
181
Time Domain Phase Derivative
182
Time Domain Magnitude Difference
182
Frequency Domain Return Loss
183
Frequency Domain Group Delay
183
Frequency Domain Window
184
How Frequency Domain Window Effects Measurements 186
Optional Distributed Sensing Parameters
187
Measurement Technique
188
Temperature Change and Strain
189
Temperature Change and Strain Coefficients 190
Spectral Shift
190
Spectral Shift Quality
190
Temporal Shift
191
Number of Points and Resolution
192
Distributed Sensing References
192
9. Maintenance 195
Cleaning Connectors
195
Cleaning Optical Fiber Connectors
196
Cleaning Bulkhead Connectors
197
Cleaning the Case
198
Replacing Fuses
198
Packing and Shipping the OBR
200
Required Packing Materials
200
Packing Procedure
201

Optical Backscatter Reflectometer 4600 9
User Guide
10.Troubleshooting 203
System Status Bar Messages 203
General Troubleshooting 204
The OBR or PC will not power on 204
Laser Ready light does not come on within several minutes 205
Control software will not load 205
All software controls are disabled or unavailable 205
Control software seems to lock up 206
Cannot align the OBR 206
Alignment unsuccessful 206
OBR will not scan 207
Excessive noise in data 207
No data after scan 208
Unexpected or abnormal data 208
Instrument drifts out of calibration 208
Error Message Troubleshooting
208
Errors on Software Startup
209
Instrument not referenced 209
Configuration information could not be loaded from the instrument; the software
goes into “Desktop Analysis” mode 209
Errors During Calibration
210
Wavelength calibration failed while acquiring data 210
The optics were detected to not be aligned properly 210
Calibration data contains invalid values 210
Errors During Scanning or Referencing 211
The specified timeout occurred before all of the requested data could be ac-
quired 211
Self-Diagnostic Software 211
Running the Self-Diagnostic Software 211

10
Contents
A. Specifications 213
Minimum PC Requirements
214
Class 1 Laser Product
214
Index 215

1
Chapter1
SystemOverview 1
Luna Technologies’ Optical Backscatter Reflectometer (OBR) is the industry’s first
ultra-high resolution reflectometry device with backscatter-level sensitivity for
interrogating components or systems. The OBR uses swept-wavelength coherent
interferometry to measure minute reflections in an optical system as a function of
length. This technique measures the full scalar response of the device under test
(DUT), including both phase and amplitude information.
Data is presentedgraphically,providingthe user with unprecedentedoptical-module
inspection and diagnostic capabilities. The data may be used to:

2 Chapter 1
System Overview
•
Locate loss events—Monitor backscatter levels to isolate
1
losses due to bends, crimps, bad splices, etc.
• “Look inside” devices—Use high resolution and sensitivityto
interrogate individual components within a subsystem.
• Track Polarization—Trackchanges in the state-of-polariza-
tion as light propagates through an optical network.
The ControlSoftware
The OBR control software includes an intuitive graphical interface (Figure 1-1). All
controls, options, and
measurement
results are easily accessible from the single main
window or the menu bar. The user selects which parameters are displayed from the
pull-down menu at the top of either plot window.
Caution Use of controls or adjustments or performance of
procedures other than those specified herein may result
in hazardous radiation exposure and one or more safety
protections may be impaired or rendered ineffective.
The followingparametersare calculatedand displayedby the OBR controlsoftware:
Time Domain Data (Upper or Lower Graph)
• Amplitude (dB/mm) (For a complete definition, see “Time Domain
Amplitude and Amplitude (dB)” on page 180).
• Amplitude (dB) (See page
180).
• Linear Amplitude (See page
181).
• Phase Derivative (See page
182).
• Polarization States (See page 181).
• Magnitude Difference (See page 182)
Frequency Domain Data (Lower
Graph)
• Return Loss (See page
168).
• Linear Amplitude (See page
166).
• Polarization States (See page
166
• Group Delay (See page
169).

Optical Backscatter Reflectometer 4600 3
User Guide
1
Distributed Sensing Options (Lower Graph)
The following time domain parameters are only available to users who purchase
spectral shift or Distributed Sensing options with the OBR.
• Magnitude Difference (See page 182)
• Spectral Shift (See page 175).
• Spectral Shift Quality (See page 190)
• Temperature Change (See page 174).
• Strain (See page 174).
• Temporal Shift (See page 175).
Figure 1-1. Control software main window. Some of the buttons and fields will be
“grayed,” or inactive when the software starts. They become active when data is
loaded or scanned into the software.

4 Chapter 1
System Overview
The control software also provides many tools for data acquisition, manipulation,
and display. Data may be acquired in standard, spot, or fast scan in continuous or
regular scan mode. Postprocessing allows the user to change the spatial resolution
1
without the need to redo the measurement. Graph windows support powerful zoom
and cursor
features.
Time Domain Data
By default, the upper graph displays the amplitude of the time domain data, which
is equivalent to a traditional optical time domain reflectometry (OTDR)
measurement. The user may also set the lower graph to display time domain data
by using the pull down graph in the upper right hand corner of that graph.
In the time domain, each optical interface within the device under test produces a
peak. The time domain data can also be displayed in terms of length. This allows
the user to quickly and reliably identify and locate reflections along the length of
anopticalsystem.Thephase
derivative
ofthetimedomaindatacanalso be displayed
in the upper plot window. The phase derivative corresponds to the instantaneous
wavelength response of a device. This is particularly useful for devices designed to
operate over narrow wavelength bands like DWDM (dense wavelength division
multiplexed) filters.
The return loss shown in the upper graph gives the single average loss value at each
vertical cursor, for a quick pass/fail evaluation for each optical path or interface.
FrequencyDomain
By default, the lower plot shows the linear amplitude of the frequency domain data,
which corresponds to the insertion loss or return loss of the device under test. The
lower plot can also display return loss, polarization states, or group delay.
The frequency domain plot is calculated based on only the time domain data
highlighted by the cursor in the plot window above. Therefore it is possible to
analyze individual sections of a device or system and determine the amplitude and
phase response of each interface separately, by highlighting their corresponding
peaksinthetimedomainplot. This providesa powerfulmeans for quicklyand easily
identifying faults and pinpointing their cause within a component, module, or
subsystem.

Optical Backscatter Reflectometer 4600 5
User Guide
1
FrequencyDomainResolution
The duration of the impulse in the time domain determines the necessary step size
forthe groupdelay
measurement.
If thestepistoolarge,
information
aboutthe device
is lost. If the step is too small, extraneous noise enters the measurement. Luna
Technologies’OBR software allows the user to select precisely the correct step size
by setting the time domain window so that it includes only the device response. It
is also possible to obtain group delay data for a variety of step sizes by changing
the setting of the time domain windowand recalculatingthe frequency domain data.
There is no need to perform a new measurement.This contrasts traditional methods
of group delay measurement, such as the modulation phase shift technique, where
the user must guess at the appropriate step size and perform a new measurement to
change that step size.

6Chapter 1
System Overview
1

7
Chapter2
Assemblyand Startup 2
The Optical
Backscatter Reflectometer
is shipped witheverythingneededto conduct
device characterizations, including the measurement instrument and all supporting
hardware, software, documentation, and cables.
Read and follow all assembly and startup instructions before attempting to operate
the Optical Backscatter Reflectometer.
Warning The protection providedbytheequipmentmaybeimpaired
if the equipment is used in a manner not specified by the
manufacturer, resulting in serious injury or death.
Components
List
The Optical Backscatter Reflectometer is shipped with either a laptop or a PC with
monitor, keyboard and mouse. All other components shown below are shipped with
each OBR instrument.
Optical Backscatter Reflectometer 4600 instrument.
One (1) USB cable to connect the OBR instrument to the PC

8Chapter 2
Assembly and Startup
One (1) power cord for the OBR instrument. (Plus two (2)
more, if you ordered the PC and monitor)
2
OBR laptop PC (or desktop PC, shown below)
Laptop power supply
OBR desktop PC (or laptop PC, shown above)

Optical Backscatter Reflectometer 4600 9
User Guide
17-inch flat panel monitor (with desktop only)
2
Monitor-PC interface cable (with desktop only)
Keyboard (with desktop only)
Mouse (with desktop only)
Gold reflector
Table of contents
Other Luna Measuring Instrument manuals
Popular Measuring Instrument manuals by other brands

Leister
Leister EXAMO 300F USB operating instructions

Tractel
Tractel Dynarope HF36/3/LPT Operation and maintenance manual

LCR
LCR Pro1 quick start guide

Ditel
Ditel ALPHA-D user manual

Katronic Technologies
Katronic Technologies KATflow 200 operating instructions

VDO
VDO TU00-0752-5807102 installation instructions