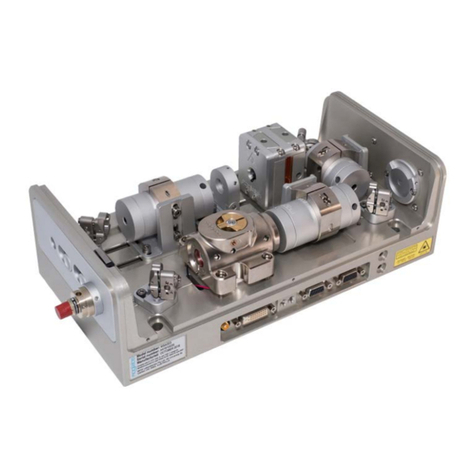
MOGlabs FZW600 User manual

Fizeau Wavemeter and Fibre Switcher
FZW600, FSW4, FSW8
Version0.3.2: Rev2hardware,firmwarev0.9.3,mogfzwv1.4.1

Limitation of Liability
MOGLaboratoriesPtyLtd(MOGLabs)doesnotassumeanyliabil-
ity arising out of the use of the information contained within this
manual. This document may contain or reference information and
products protected by copyrights or patents and does not convey
any license under the patent rights of MOGLabs, nor the rights of
others. MOGLabs will not be liable for any defect in hardware or
softwareorlossorinadequacyofdataofanykind,orforanydirect,
indirect, incidental, or consequential damages in connections with
orarisingoutoftheperformanceoruseofanyofitsproducts. The
foregoing limitation of liability shall be equally applicable to any
serviceprovidedbyMOGLabs.
Copyright
Copyright ©MOG Laboratories Pty Ltd (MOGLabs) 2017 – 2021.
Nopartofthispublicationmaybereproduced,storedinaretrieval
system, or transmitted, in any form or by any means, electronic,
mechanical, photocopying or otherwise, without the prior written
permissionofMOGLabs.
Contact
Forfurtherinformation,pleasecontact:
MOGLaboratoriesP/L
49UniversitySt
CarltonVIC3053
AUSTRALIA
+61399390677
MOGLabsUSALLC
41914thSt
HuntingdonPA16652
USA
+18142514363
www.moglabs.com

Contents
Getting started iii
1 Introduction 1
1.1 Howitworks....................... 1
1.2 Features.......................... 2
2 Connections and controls 3
2.1 Frontpanelinterface . . . . . . . . . . . . . . . . . . . 3
2.2 Rearpanelcontrolsandconnections. . . . . . . . . . 6
3 User interface 7
3.1 DeviceUI......................... 7
3.2 WebUI........................... 8
3.3 SoftwareUI........................ 9
4 Operation 13
4.1 Fringeidentificationandoptimisation . . . . . . . . . 13
4.2 Auto-exposurealgorithm. . . . . . . . . . . . . . . . . 16
4.3 Fastmode......................... 16
4.4 Pulsedlasermeasurement. . . . . . . . . . . . . . . . 16
4.5 Externallytriggeredmode. . . . . . . . . . . . . . . . 17
4.6 Measurementaveraging . . . . . . . . . . . . . . . . . 17
4.7 Calibrationadjustment . . . . . . . . . . . . . . . . . . 18
5 PID locking 21
5.1 UsingwithMOGLabsDLC lasercontroller . . . . . . 22
5.2 PIDparameters...................... 22
5.3 Integratorwindup. . . . . . . . . . . . . . . . . . . . . 24
5.4 Examples.......................... 25
i

ii Contents
6 Optical switch 31
6.1 Overview.......................... 31
6.2 Operation......................... 32
6.3 Opticalbands....................... 32
6.4 mogfzwswitchUI . . . . . . . . . . . . . . . . . . . . . 34
A Specifications 37
B Firmware updates 41
C Command language 43
C.1 Generalfunctions . . . . . . . . . . . . . . . . . . . . . 43
C.2 Displaysettings . . . . . . . . . . . . . . . . . . . . . 44
C.3 Measurementsettings . . . . . . . . . . . . . . . . . . 44
C.4 Camerasettings...................... 45
C.5 Opticalswitch....................... 46
C.6 ControlvoltageoutandPID . . . . . . . . . . . . . . 47
D Communications 49
D.1 Protocol.......................... 49
D.2 TCP/IP........................... 49
D.3 USB............................ 51
E Dimensions and PCB 53
E.1 Internalconnectors . . . . . . . . . . . . . . . . . . . . 56

Getting started
1. Connect to +5 V power viatheUSBportortheDCbarreljack.
When powering with USB, it is important that the host can
supplyupto600mA.Someoldercomputersmaydetectthisas
ashort-circuitandpowerdownthedevice;USB-3.0compliant
hubsarerecommended.
2. Power on usingtherockerswitchontherear.
3. Connect fibre using the supplied fibre patchcord. Typically
thisisFC/APC (green) atbothends,butcanbeFC/PC (black)
toFC/APC (green); inthatcase,theFC/PC blacksidemustbe
connectedtotheFZW.
Single-modefibresarestronglypreferred,althoughsmall-core
multi-modefibres(upto62.5µm)canbeusedattheexpense
ofreducedaccuracy.1
4. FSW Fibre switch: If using a fibre switch, connect the out-
put fibre from the switch to the input fibre port on the FZW.
ElectricallyconnecttheFSW andFZW usingthesuppliedM8
cable. Connectyourlightsourceviafibretooneofthe4or8
inputportsontheFSW.
5. Input light withthesuppliedfree-spacetofibreadapter. Typ-
icallytheFZWonlyneedsafewmicrowattstooperate,sohigh
couplingefficiencyisnotrequired. Thesaturation (Figure1)
isameasureofthepowerreachingthedetector
Theauto-exposurealgorithmtunestheexposuretimeandsen-
sorgaintomatchtheinputpowerandoptimisethemeasure-
mentrate. Manualsettingsmaybepreferable, forexampleif
thelaserpowerisrapidlyfluctuating.
1Absoluteaccuracyspecificationsareonlyvalidwhenusingsingle-modefibres.
iii

iv Getting started
Figure 1: Both the built-in wavemeter display (left) and host software
(right)providesaturationindicatorsthatmeasuretheopticalpowerreach-
ingthedetector.
That’sit: withacoupledfibreyoushouldbeabletoreadthewave-
lengthwithintwosecondsofpower-on. Itisrecommendedtoperiod-
icallyinspectthemeasuredinterferencefringesforcorrectstructure
(§4.1)toensurereliablemeasurement.
TypicallytheFZW willreach thermal equilibrium and fullaccuracy
within15minutesofbeingturnedon. Themostaccurateresultswill
beobtainedinawell-stabilisedlabenvironment. Itisrecommended
thattheFZW notbeinthermalcontactwithanyotherequipmentto
preventformationofthermalgradients.
Host connection
The recommended mode of operation is using the Windows™host
application (chapter 3) which provides a simple interface for con-
trollingdevicefunctionality. Instructionsforconnectingviaethernet
andUSB areprovidedinAppendixD.

1. Introduction
1.1 How it works
TheFZWisahigh-precisiondevicethatmeasureslaserwavelengths
using a set of Fizeau interferometers. A Fizeau interferometer is
formed by two planar surfaces with a small wedge angle between
them,whichgeneratesspatially-varying interferencefringesasthe
opticalpathlengthchanges(Fig.1.1). Boththefringespacingand
phaseoftheresultinginterferencepatternarerelatedtothewave-
lengthoftheincidentlight,soanalysingtheirstructureallowspre-
cisedeterminationofthelaserwavelength.
Figure 1.1: CollimatedmonochromaticlaserlightandFizeauetalonscre-
ateinterferencepatternsonanimagingdetector. Thewavelengthiscalcu-
latedbycombiningmeasurementsofthefringesfromfourdifferentetalons.
A rough estimate of the wavelength is obtained directly from the
fringe spacing, to an absolute accuracy of one part in 100. This
initialestimateisthenimprovedbythephaseofthefringepattern.
Multipleetalonswithdifferentfree-spectralranges(FSRs)areused
to refine the wavelength measurement without sacrificing absolute
accuracy. TheMOGLabsFZW usesfoursuchstages,withtheFSR of
the final etalon being 7.5GHz. This enables the wavelength to be
determinedtoanabsoluteaccuracyofonepartin107.
1

2Chapter 1. Introduction
1.2 Features
The MOGLabs FZW has no moving parts, and very high sensitivity
semiconductor imaging, enabling high measurement speed (up to
350persecond)andmeasurementofpulsedsourceswithonlyafew
microwattsoflight.
Longlifetimeisassuredastherearenomechanicalpartstowearout.
Theetalonsareoptically-contactedfusedsilica,withalowthermal
expansioncoefficient,makingtheinstrumentincrediblyrobust,reli-
able, and stable. High precision MEMS-based sensors are used to
make small corrections for environmental variations. Recalibration
is notrequiredtomaintainthestatedaccuracy; in fact, theFZW is
morestablethantheneonlampusedinsomeotherwavemetersas
acalibrationsource.
TheFZW alsointegratesamodern32-bitmicroprocessorandhigh-
resolution compact colour display. Wavelength calculation is per-
formed automatically on the device so that no host computer is
required. It is compact and can be powered from USB or even a
rechargeablebattery,soyoucanmoveitaroundyourlabandmea-
surewavelengthrightwhereyouareadjustingyourlaser.
Fast ethernet and USB communications combined with a sophisti-
cated software suite enable display on your lab computer or your
smartphone. Multiple FZW devices can beeasilyrun from a single
computer, and integration with common data acquisition systems
issimpleusingtext-based commands over standard protocols, with
simplebindingstoLabVIEW,MATLAB,andpython provided. PIDfre-
quency feedback locking is also included with every device, also
withoutrequiringahostcomputer.

2. Connections and controls
2.1 Front panel interface
The FZW front panel (Figure 2.1) includes an interactive colour
screenwithpush-buttoninterface,andanumberofstatusindicator
lights. This allows autonomous usage of the wavemeter indepen-
dentlyofacomputer.
Figure 2.1: MOGLabsFZW frontpanellayout.
Thebuttonsarearrangedwithup,down,leftandrightbuttons,and
anadditionalOK buttoninthecentre. Inwavelengthdisplaymode,
theup/downbuttonschangethedisplayunits,andtheleft/rightbut-
tonsswapbetweendifferent diagnosticmodes(see§3.1). Pressing
OK opensthemenusystem.
The display includes a sleep mode which reduces the brightness
whennotinuse. Wherethisfeatureisundesirableitcanbedisabled
bysettingthesleeptimetozerointhemenusystem.
3

4Chapter 2. Connections and controls
TheLED indicatorsdisplaythecurrentstateofthedevice,aslisted
inthetablebelow.
Indicator Colour Status
PWR ÊOff Unitispoweredoff
Green Normaloperation
Blue Firmwareupdatemode
ERR ! Off Nomeasurementinprogress
Green Normaloperation
Yellow Measurementerror
Red Criticaldeviceerror
LOCK Off PID/analogueoutputdisabled
Green PIDlocked
Yellow PIDengagedbutnotlocked
Red PIDoutputsaturated
Blue Analogueoutputerror
2.1.1 Menu system
Themenusystemallowsforinteractivecontrolofthedevicewithout
acomputerinterface(Figure2.2). Itisstartedby pressingtheOK
buttonfromthemeasurementdisplaymode,andexitingbypressing
theleftdirectionalbutton.
Figure 2.2: Primary settings menu, showing measurement options (left)
anddevicesettings(right)whichincludesdisplaysettings.

2.1 Front panel interface 5
Within the menu system, the up and down buttons control the se-
lecteditem. Pressing OK on aselecteditemactivatesittoallows
editingthevalue,enteringthesubmenu,orexecutingthecommand.
Pressing the left button returns to the previous menu, or exits the
menusystem.
When a value is selected for editing, a digit will be highlighted.
Usingtheup/downkeysmodifiesthisdigit,andusingtheleft/right
keyschangeswhichdigitisselected. PressingOK againexitsedit-
ingmode.
Inparticular,itisusefulforconfiguringtheEthernetsettingsinan
networkingenvironmentwhereDHCP isdisallowed (Figure 2.3). In
this situation, an appropriate static IP should be allocated to the
unit,thegatewaysetasrequiredbythenetworkconfiguration,and
DHCP settoOFF.
Figure 2.3: The Ethernet settings menu provides control of connection
settings (left), including DHCP and static addresses. Any changes only
takeeffectoncetheEthernetcontrollerisrestarted(right).

6Chapter 2. Connections and controls
2.2 Rear panel controls and connections
+9-30V
PID TRIG FSW
Figure 2.4: MOGLabsFZW Rev4rearpanellayout.
Fromlefttoright,thefeaturesoftherearpanel(Figure2.4)are:
Power switch Switchestheuniton/off.
DC supply 2.1mmcentre-positivebarrel-jackconnectorforsupplyingpowerthe
unit. NotrequiredifpowerissuppliedoverUSB.Useofafloating
(unearthed)plugpackpowersupplyisnotrecommended. Use+5V
forRev1toRev3;+9to+36VforRev4devices.
USB StandardUSBtype-Bconnectorforpoweringand/orcommunicating
withthedevice. Whenusedtopowerthedevice,mustbeconnected
toaUSBportcapableofsupplying600mA.
Ethernet RJ-45 jack for 10/100 MB/s TCP/IP communications, which is the
recommendedinterfaceforcomputercontrolandmonitoring.
PID Analogue output port for wavelength monitoring or PID control of
laser wavelength (see chapter 5). 16-bit resolution with ±2.5V
outputrange.
TRIG Active-lowTTLinputforsynchronisingthewavemetermeasurement
toanexternaltrigger(see§4.5).
FSW M8connectorforinterfacingwiththeFSW4/FSW8 multi-channelop-
ticalswitcher(seechapter6).

3. User interface
3.1 Device UI
The FZW includes an integrated user interface for operating the
wavemeter independently of a host computer. The primary display
showsthecurrentlymeasuredwavelength(Figure3.1)inunitsthat
canbeselectedviatheup/downbuttons.
Figure 3.1: Primary wavelength display showing the measured wave-
length,saturationandcontrast,aswellasthedeviceIPaddress.
The saturation is a measure of the optical power reaching the de-
tector, and the contrast is a measure of fringe quality. In general,
higher saturation is preferred as this permits faster measurement,
however oversaturation (as indicated by the bar turning red) will
degrademeasurementaccuracy.
Pressingtheleft/rightbuttonschangestoanalternatedisplaymode
(Figure3.2),permittingdiagnosticofthefringepatternasexplained
in§4.1,aswellasdisplayingarudimentarytime-seriesofvariations
in the measured wavelength over time. Pressing the central OK
buttonopensthemenusystem(see§2.1.1).
7

8Chapter 3. User interface
Figure 3.2: Diagnosticmodes oftheFZW device UI: etalondisplay(left)
permitsverificationoffringequality,andtime-seriesdisplay(right)shows
variationinthemeasuredwavelengthovertime.
3.2 Web UI
The FZW includes a simple web interface for monitoring the de-
vice remotely througha webbrowser, such as usingasmartphone.
NavigatingtothedeviceIP addressdisplaysthecurrentlyrecorded
wavelength,whichisautomaticallyupdated(Figure3.3). Atpresent
this interface doesn’t provide control options, but increased func-
tionalitywillbeprovidedinfuturefirmwareupdates.
Figure 3.3: Demonstrationof theintegratedwebinterfaceshowing mea-
suredwavelengthandsaturation(representedbythecolouredbar).

3.3 Software UI 9
Inenvironmentswhereembeddeddevicesrunningwebserverscon-
stituteasecurityconcern,thewebinterfacecanbedisabledusing
thecommandETH,WEB,0 orthroughtheMenuSystembyselecting
Options→Ethernet→Webserver→OFF.
3.3 Software UI
Afully-featuredcontrolanddiagnosticprogramsuiteforWindows™
operatingsystemsisavailablefromtheMOGLabswebsite.
Most of the user interface is dedicated to displaying the etalon
fringes,whichareimportantformeasurementdiagnostics(see§4.1).
Figure 3.4: Demonstration of the host software interface, showing expo-
sure controls (1), convergence monitor (2), interference fringes (3), mea-
sured wavelength (4), display units selector (5), etalon temperature (6)
andcommunicationaddress(7). Thefontsizeofthemeasuredwavelength
canbeenlargedbydraggingthesplitterbarvertically.

10 Chapter 3. User interface
Thewavelengthdisplayboxhasselectableunits,andcanberesized
toincreasethefontsizeandmakethemeasurementeasiertoread
fromadistance.
The exposure controls on the left-hand side include a scale bar
showingtheopticalsaturation. Boththeexposuretimeandcamera
gaincanbemanuallyadjusted,althoughinmostscenariostheauto-
exposurealgorithmwilloptimisethesevalues.
Theconvergence monitor onthelower-leftindicateshowstablethe
iterative measurement is. In most situations the bars should re-
main below the dotted line, indicating that the iterative algorithm
is converging reliably. In situations where the laser wavelength is
changing rapidly, or the calibration has been perturbed, the bars
may exceed the indicated region indicating the reliability of the
measuredvalueisreduced.
3.3.1 Time-series measurement
Time-series opens a dialog that shows how the measured wave-
lengthischangingovertime(Figure3.5). Thiscanbebeneficialfor
measuringlong-termdriftsinlaserwavelength,anddiagnosingPID
locking.
3.3.2 Scan-range measurement
Thetime-seriesfeaturecanalsobeusedtodisplayrapidmeasure-
ments, where the measurement interval is set to zero. This can be
useful, for example, to measure the mode-hop free scan range of a
tunable laser (Figure 3.6). Note that at the end of the laser scan,
thewavelengthchangesveryrapidlyandcancausethewavelength
tovary non-trivially during the camera exposure, which may cause
ajumpinthemeasuredwavelengthatthispoint.

3.3 Software UI 11
Figure 3.5: Thetime-serieswindowshowshowthewavelengthmeasure-
ment is changing over time, for measuring drift. The graph displays Du-
ration secondsofdata, withadatapoint collectedevery Interval seconds.
When Averaging is enabled, the wavelength measurements during each
intervalareaveragedtoenhancethemeasurementprecision.

12 Chapter 3. User interface
Figure 3.6: The FZW can be used to measure the mode-hop free scan-
range of a laser. Setting the Interval to zero ensures measurements are
recorded as rapidly as possible. The measurement rante, measurement
mean,standarddeviationandpeak-to-peakrangeareshowninthestatus
baratthebottom.

4. Operation
4.1 Fringe identification and optimisation
The host software includes a prominent display of the interference
fringes used to compute the laser wavelength. Understanding the
fringe structure is important in ensuring that the wavelength mea-
surementisaccurate. Thetwoprimarycausesofreducedmeasure-
ment reliability are laser multi-moding, and poor spatial profile of
thelightemittedbythefibre.
The presence of multiple frequency components during a measure-
mentcanchangethestructureoftheinterferencepatternandcause
themeasurementtofail. Typicallythisisevidentbythepresenceof
secondary peaks in the fringes, a significant widening of the peak
widths,and/orasignificantreductionintheamplitudeofthefringes
comparedtothebackgroundlevel(Figure4.1). Multimodebehaviour
may be evident in only one of the etalons (Figure 4.2) so it is im-
portanttoperiodicallyverifythefringeshape.
Figure 4.1: Examplesoffringesmeasuredwithasingle-modelaser(left)
andmultimodelaser(right). Thepresenceofsecondarypeaksandreduc-
tionincontrastindicatethelaserisnotsingle-mode.
13

14 Chapter 4. Operation
Figure 4.2: Amultimodinglasermightonlybeevidentinoneoftheinter-
ferencepatterns. Insomecircumstancesthiswillbeclearfromanobvious
changeinfringespacing(left),whereasatothertimesthesecondarypeaks
mightbesmalleramplitude(right).
Notethatwhilethewavemetermaybeabletoproduceavalueforthe
wavelengthofthestrongestfrequencycomponentof a multimoding
laser,theaccuracyofthisvalueshouldnotbereliedupon.
In many situations, multi-mode optical fibres are convenient for
achieving good coupling efficiency quickly. However, they produce
anon-Gaussianbeamshapethatintroducesbiasandreducesaccu-
racyofthemeasurement. Single-modefibresarethereforestrongly
preferablewhereaccuratemeasurementsarerequired.
Withmultimodefibre,thestructureofthefringesfluctuateswithboth
thefibre-couplingalignmentand mechanicalstrainonthe fibre, as
canbeseenbyfluctuationsinthemeasuredwavelengthwhendis-
turbingthefibre. Whereverpossiblethe fibre shouldberestrained
tothetableandthecouplingalignmentshouldbeoptimisedtomake
thepeaksasclosetoequalheightaspossible(Figure4.3).
Fibres with very large core diameters (e.g. >100µm) should be
avoidedastheincreasedcoresizecausesdistortionintheinterfer-
encefringestothepointwhereinterpretationofthefringesbecomes
impossible(Figure4.4).
Other manuals for FZW600
2
This manual suits for next models
2
Table of contents
Other MOGlabs Laboratory Equipment manuals
Popular Laboratory Equipment manuals by other brands

Parallax
Parallax PDT-PIN-7001-MP-I Operation manual

Caframo
Caframo Real Torque Digital Stirrers instruction manual

PolyScience
PolyScience MX07R-20 Operator's manual

Hanna Instruments
Hanna Instruments HI97705 instruction manual

Fresenius Vial
Fresenius Vial OPTIMA PT Operator's guide

SCP SCIENCE
SCP SCIENCE DigiPREP HP user manual