MOGlabs MWM User manual

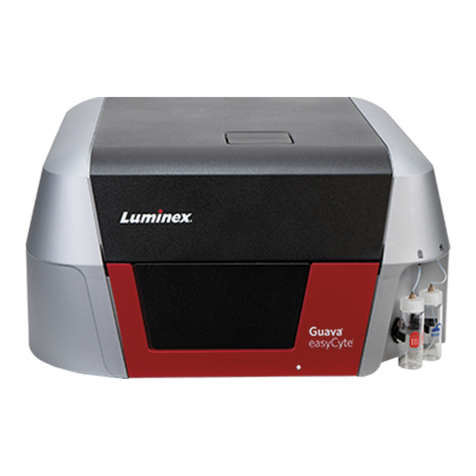
MWM wavemeter
Revision3.19 mogwave 1.4.15 Firmware0.6.9

Limitation of Liability
MOGLaboratoriesPtyLtd(MOGLabs)doesnotassumeanyliabilityaris-
ing out of the use of the information contained within this manual. This
documentmaycontainorreferenceinformationandproductsprotectedby
copyrights or patents and does not convey any license under the patent
rightsofMOGLabs, nor the rightsofothers. MOGLabswillnotbeliable
for any defect in hardware or software or loss or inadequacy of data of
anykind,orforanydirect,indirect,incidental,orconsequentialdamages
inconnections withorarising outoftheperformanceor useofany ofits
products. Theforegoinglimitationofliabilityshallbeequallyapplicable
toanyserviceprovidedbyMOGLabs.
Copyright
Copyright c
MOG Laboratories Pty Ltd (MOGLabs) 2014 – 2020. No
part of this publication may be reproduced, stored in a retrieval system,
ortransmitted,inanyformorbyanymeans,electronic,mechanical,pho-
tocopyingorotherwise,withoutthepriorwrittenpermissionofMOGLabs.
Contact
Forfurtherinformation,pleasecontact:
MOGLaboratoriesP/L
49UniversitySt
CarltonVIC3053
AUSTRALIA
+61399390677
MOGLabsUSALLC
41914thSt
HuntingdonPA16652
USA
+18142514363
www.moglabs.com

Preface
The MOGLabs MWM wavemeter provides a compact, high resolution and
costeffective instrumentformeasuring thewavelengthand spectrumofa
laser. The instrument can be operated standalone, and easily controlled
fromacomputerwithasophisticatedhostapplicationorusingsimpletext
commands,viaUSB andethernet. Thelowpricemakesisaffordableeven
ifyouhavejustonelasertomeasure.
WehopethatyoufindtheMWMuseful,andpleaseletusknowifyouhave
anysuggestionsforimprovementoftheMWM orthisdocument,sothatwe
canmakelifeinthelabbetterforall.
MOGLabs,Melbourne,Australia
www.moglabs.com
i

ii

Contents
Preface i
1 Introduction 1
1.1 Basicsetup............................ 1
1.2 Softwareinstallation . . . . . . . . . . . . . . . . . . . . . . . 3
2 Standalone operation 5
2.1 On-devicemeasurements . . . . . . . . . . . . . . . . . . . . 5
2.2 Frontpaneldisplayandbuttons . . . . . . . . . . . . . . . . 5
2.3 Measuring............................. 6
2.4 Devicemenus........................... 7
3 Web interface 11
3.1 Homepage ............................ 12
3.2 Liveview.............................. 13
3.3 Live+................................ 14
3.4 Devicesetup............................ 14
3.5 Software.............................. 16
3.6 Updatefirmware......................... 16
4 MOGWAVE 17
4.1 Devicediscovery......................... 17
4.2 Maindisplay........................... 18
4.3 Menu................................ 20
4.4 Acquisition............................. 25
4.5 Options............................... 25
4.6 Wavelength............................ 26
4.7 Functions ............................. 27
4.8 Statusbar............................. 29
iii

iv Contents
5 Signal out and PID 31
5.1 MOGLabsDLC lasercontroller . . . . . . . . . . . . . . . . . 32
5.2 PIDparameters.......................... 32
5.3 Integratorwindup......................... 33
5.4 Examples.............................. 34
6 Calibration 37
6.1 Existingwavelengthrange . . . . . . . . . . . . . . . . . . . 37
6.2 CalibratingwithMOGLabsFZWwavemeter . . . . . . . . . 40
6.3 CalibratingwithHighFinessewavemeter . . . . . . . . . . . 40
6.4 Newwavelengthrange. . . . . . . . . . . . . . . . . . . . . . 41
6.5 Newfibre............................. 44
A Specifications 47
B Communications 51
B.1 TCP/IP............................... 51
B.2 USB................................ 54
C Programming 59
C.1 python example.......................... 59
D Command language 63
D.1 Wavelengthmeasurement . . . . . . . . . . . . . . . . . . . . 63
D.2PIDcontrol............................ 64
D.3Generalfunctions......................... 65
D.4Displayfunctions......................... 66
D.5 Auxilliarymeasurements. . . . . . . . . . . . . . . . . . . . . 66
D.6Imaging............................... 68
D.7 Configurationsettings . . . . . . . . . . . . . . . . . . . . . . 70
D.8EEPROMaccess......................... 73
Emogwave configuration 75
E.1 Command-lineoptions . . . . . . . . . . . . . . . . . . . . . . 75
E.2 Configurationfile......................... 77
Fmogwave server 79
F.1 Enablingtheserver. . . . . . . . . . . . . . . . . . . . . . . . 79
F.2 Communicationwiththeserver . . . . . . . . . . . . . . . . . 79
F.3 mogwave commands........................ 80

vi Contents

1. Introduction
TheMOGLabsMWMopticalinstrumentisahighresolutiondiffractiongrat-
ingspectrometerinLittrowconfiguration. Opticalinterferencecreatesan
imageofasinglemodefibrecoreatawavelength-dependentpositionona
semiconductorimagingsensor. Theimageisdigitisedathighspatialreso-
lutionandwithhighdynamicrangeandspeed. Thewavelengthspectrumis
determinedfromthedigitisedimageandafittingproceduredeterminesthe
peakwavelength. Itprovidespicometre(0.001nm)accuracyandpicowatt
sensitivity, with up to 1250 readings per second. The relative accuracy,
forexampleinmeasuringthedifferencebetweentwolaserwavelengths,is
around10MHz(0.01pm).
The device can be operated standalone (without a host computer, see
fig.1.1)orviaawebbrowser(fig.1.2)orusingthemogwave GUIapplication
(chapter 4). Integration with data acquisition systems is straightforward
usingUSBorethernet(TCP/IP)communicationsandsimpletext-basedcom-
mands.
Figure 1.1: Wavemeteron-devicedisplay,showingserialnumber,firmwarever-
sion,wavelengthrange,temperature,pressure,exposuredurationandIPaddress.
1.1 Basic setup
1. Connect a 5V 500mA power supply via the USB interface. Some
computer USB ports will provide sufficient power but in general a
dedicatedpowersupplyorUSB hubisrecommended.
2. Second and third generation (Rev 2 and later) instruments have
1

2Chapter 1. Introduction
Figure 1.2: Webinterfacehomepage.
poweron/offviatheOKpushbutton. Topoweronoroff,holdtheOK
buttondownfor2to3seconds.
3. If possible, use a network connection for improved response times
andfasterdata acquisition. Connecttoan ethernet switchandthe
MWM willattempttodetermineanIP addressviaDHCP.Ifthatfails,
it will default to an internal IP which will be shown on the instru-
ment display. See chapter B for more information on configuring
communicationsparameters.
4. TheMWMmustbecoupledtothelightsourceviaasingle-modeopti-
calfibre. Multimodefibreisnot suitable. Theinstrumentsensitivity
isveryhighandsothefibremodediameterneednotbewellmatched;
forexample,a480nmfibrecanbeusedtomeasure780nmlightand
vice versa, though best accuracy and stability are achieved if the
fibre is matched to the wavelength. Fibres with FC/PC (preferred)
or FC/APC connectors can be used, and standard or polarisation-
maintainingfibre.
Note: Yourdevicehasbeenconfiguredandcalibratedusingafibre
witheitherFC/PC orFC/APC connector, usuallywithFC/PCatthe
wavemeter. Pleaserefertothetestdataprovidedwithyourdevice.
If you use a different connector type, you will need to reconfigure
andrecalibrate. Pleaseseesection4.8.
Caution: Thefibretipisanintegralpartoftheinstrument. Unclean

1.2 Software installation 3
ordamagedfibretipswillgiveunsatisfactoryresults.
5. The target laser should be directed into the other end of the fibre
patch cord. Note that a lens is not needed; the bare fibre will
normally couple sufficient light. A few nanowatts is good, though
whenfirstsettingup,afewmicrowattswillmakelifemucheasier.
6. The device can operate standalone, but initially it is best to use
a WindowsTM computer and the mogwave software application, as
describedinchapter4.
1.2 Software installation
The MWM can be used directly from many standard laboratory data ac-
quisition systems such as python,matlab or LabVIEW, via simple text
commands. A simple example is included in chapter C. We also pro-
vide a standalone GUI application, mogwave, which runs under Microsoft
WindowsTM.
To install the mogwave application, run the appropriate installer, for ex-
amplemogwave_setup.exe,availablefromtheMOGLabswebsite:
http://www.moglabs.com/wavemeter.html
1.2.1 USB drivers
WhenyouconnecttheMWM,yourcomputershouldautomaticallyfindand
install USB drivers from the WindowsTM update service. If not, in the
installdirectory(typicallyc:\Program Files\MOGLabs)youshouldfindthe
USB_VCPdriver folderwhichwillcontainsetupprogramsfor32-bitand64-
bitsystems.
IfyouhaveproblemsconnectingwithUSB,inparticularnodriverfound:
1. EnsurethedeviceisconnectedtoyourcomputerviaUSBcable.
2. Double-clicktheappropriate32-bitor64-bitdriverfromtheUSB_VCPdriver
folderintheinstalldirectory,typically
c:\Program Files\MOGLabs.

4Chapter 1. Introduction
3. Onceinstallationiscompleted,restartyourcomputer.
4. Whenyourcomputerisfinishedbooting,disconnecttheUSBcable
fromyourwavemeter,andthenreconnect.

2. Standalone operation
Forfullfunctionality,theMOGLabsMWMshouldbeusedwiththemogwave
WindowsTM-basedapplicationpackageprovided(seechapter4),butitcan
also be operated as a standalone instrument using the pushbuttons and
on-screenmenusystem. TheMWMalsooffersawebinterface(seechapter
3)foroperationwithawebbrowser,forexampleonasmartphone.
2.1 On-device measurements
There are currently four modes of measurement operation which can be
selectedusingthepushbuttons.
Off TheMWM iswaitingforcommandsviaethernet/USB orthewebinterface,
orforpushbuttonactivationofoneoftheothermeasurementmodes.
On The MWM measures and displays the wavelength ten times per second.
Themeasurementunitscanbeadjustedviathemenusystem(seebelow).
TheMWM automaticallyadjustsexposuretime,andusesone-dimensional
measurementofthespectralpeaklocation.
PID with display TheMWMmeasurescontinuallyatmaximumspeed,andactivates
PID control to vary the output voltage via the SMA connector to lock a
lasertoawavelengththatcanbespecifiedthroughthemenusystem. The
measuredwavelengthisdisplayedonthedeviceLCD screen.
PID no display As above, but the LCD screen shows the desired setpoint wave-
length and is not updated with the actual measured wavelength. This
allows the MWM to measure much more rapidly, at over 1250 measure-
mentspersecond.
2.2 Front panel display and buttons
The pushbuttons can be used to start on-device measurements, access
on-devicemenus,andinitiatefirmwareupgrades.
5

6Chapter 2. Standalone operation
2.2.1 Pushbuttons
There are four pushbuttons to the right of the LCD display, to select the
measurementmodeortostepthroughthemenus.
Stopmeasuring,ifdevice-basedmeasurementisactive.
Activatefirmwareupgradeifhelddownduringstartup.
↑Enable device-based measurement with on-screen display, and step up-
wardsthroughmeasurementmodes.
If held down during startup, load network configuration from hard-coded
definitionsinsteadofEEPROM.
↓Enabledevice-basedmeasurementwithon-screendisplay,andstepdown-
wardsthroughmeasurementmodes.
OK Activateon-screenmenus.
For MWM Rev 2 and later, the OK button acts as a power switch. Hold
downfor2to3secondstopoweronoroff.
OK +↓Holdbothdowntoreset.
2.3 Measuring
TheLCDdisplayimagesbelowshowthethreedifferentmeasurementmodes
in operation. On the left is the normal mode with ten measurements per
second.
ThemiddleimageiswithPID controlactivated,measuringanddisplaying
asquicklyaspossible. Thenumbershownbelowtheunits(i.e.1170/s)is
thenumberofmeasurementspersecond.

2.4 Device menus 7
The right-hand image shows the third mode of operation, where the dis-
playednumberisthesetpointratherthantheactualmeasuredwavelength.
Thatallowsslightlyfasteroperation(1250measurementspersecond).
2.4 Device menus
2.4.1 Home screen
Thedefaultscreenonpower-up,showingfirmwareversionnumber,device
serialnumber,wavelengthrange,temperature,pressure,exposuretimeand
TCP/IP orUSB connection. Pressthe OK buttontoenterthemenusystem.
2.4.2 Main menu
Mainmenu,allowingselectionofthemeasurementmodeorentryintothe
sub-menusdetailedbelow.
The ↑and ↓buttonsselectadifferentmeasurementmode(see2.1)or
Settingssub-menu. Usethe OK buttontoselectthecurrentlyhighlighted
(asinvertedtext)sub-menu. Usethe buttontoexitthemenusystem.
2.4.3 Settings
TheSettingsmenuoffersselectionofanumberofsub-menus.

8Chapter 2. Standalone operation
2.4.4 Units
TheMWM measureswavelengthinambientconditions,butusesmeasured
temperature and pressure to estimate the wavelength in vacuum, in air
at standard temperature and pressure, or asa frequency or wavenumber.
Column returnsthesensorpixelnumbercorrespondingtothespectralpeak,
fordiagnosticpurposes.
2.4.5 PID
TheMWM canoutputaPID controlsignalontheSMA connectorforlaser
wavelength stabilisation (see 4.3.4). The PID menu allows display and
adjustmentofthePID setpoint,gaincoefficients,offsetvoltageandlimits.
Thesevalueswouldnormallybeenteredusingmogwave orotherinterface
butitmaybeusefultodisplayandmakesmallchangesonthedevice.
Toalterthestaticvalues,selectthedesireditemusingtheup/downarrow
keys, then press OK. The value will be highlighted as inverted text and
can be altered using the up/down arrows. Use the button to move
the cursor to the left. The cursor cannot be moved right; instead, keep
pressing untilthecursorwrapsaround.
Press OK whenfinishededitingthevalue.
Tosavethenewvalues,movedownthemenutoSave to eeprom andpress
OK.

2.4 Device menus 9
2.4.6 Ethernet
The ethernet sub-menu shows the current IP address, and stored (static
default) values for static IP address, netmask, gateway DHCP and TCP/IP
port.
Tosaveandactivatethenewvalues,movedownthemenutoeitherSave
to eeprom orSave and restart andpress OK. BothSave optionscopythe
newvaluestoEEPROM. TheSave and restart optionwillalsoreboot the
devicewiththenewvalues.
2.4.7 Other
Rowisthesensorrowusedformeasuringwavelength. Themaximumexpo-
sure time (in milliseconds), pressure measurement correction, and screen
contrastcanalsobechanged. Notethatthereisnovaluerangechecking;
consultthecommandlanguageinappendixDformoreinformation. Alter
valuesasabove.
2.4.8 System voltages
On-boardpowersupplyvoltages,fordebuggingtechnicalproblemsincon-
sultationwithMOGLabs.

10 Chapter 2. Standalone operation
2.4.9 About
Providesinformationincludingserialnumberandfirmwareversion.

3. Web interface
With the MWM connected to your network, the device web server (see
figurebelow)providesreal-timewavelengthreadingstoanywebbrowser
includingmobilephones,desktopandlaptopcomputers. Simplyenterthe
device IP address, as shown on the LCD display (e.g. 10.1.1.128) into
your web browser and you should see a webpage similar to that below,
providedyourcomputer/phoneisonthesamesubnetastheMWMdevice.
Figure 3.1: Web interface homepage, showing the wavelength, exposure time
anddevicetemperature. Buttonsallowswitchingtoreal-timewavelengthdisplay,
auto-adjustofexposuretime,enablingPID,andjumpingtoadevicesetuppage.
Web page common features
Alldevicewebpageshavesomecommonelements:
•Thedevicefirmwareversion,IPaddressandIPportnumberareshown
atthetoprightofeachpage.11

12 Chapter 3. Web interface
•TheMOGLabslogocanbeclickedtoaccesstheMOGLabswebsite.
•The menu bar provides access to several key Functions, the device
Homepage,andtoaHelppagewhichprovidesalinktothisuser-
manualviatheMOGLabswebsite.
3.1 Home page
Thehomepageshowsasinglewavelengthreading(inthedevicedefault
units), the exposure time, the device temperature, the status of the PID
servo(onoroff),andseveralclickablebuttons.
Update Updatesthedisplayedwavelength,exposure,temperatureandPID status.
Live Linkstoanewwebpagewithlivedisplay(seebelow).
Live+ Linkstoanewwebpagewithlivedisplayofjustthewavelength,inlarge
font. Particularlyusefulforuseonsmallscreenssuchassmartphones,or
toviewthereadoutfromacrossthelab.
Auto exposure Recalculatestheoptimumexposuretime.
Device setup Linkstoanewwebpageforconfiguringthedevice;seebelow.
PID off/on TogglesPID statusbetweenonandoff.
Table of contents
Other MOGlabs Laboratory Equipment manuals