MULTILANE ML 4015D User manual

USER MANUAL
Digital Sampling Oscilloscope User Manual
User Manual Revision 1.0, July 2020
Firmware Revision 3.2
GUI Revision 2.0.9
Connection | Installation | Calibration | Measurement | Troubleshooting

2
Notices
Copyright © MultiLane Inc. All rights reserved. Licensed
software products are owned by MultiLane Inc. or its
suppliers and are protected by United States copyright
laws and international treaty provisions.
Use, duplication, or disclosure by the Government is
subject to restrictions as set forth in subparagraph (c)(1)(ii)
of the Rights in Technical Data and Computer Software
clause at DFARS 252.227-7013, or subparagraphs (c)(1)
and (2) of the Commercial Computer Software -- Restricted
Rights clause at FAR 52.227-19, as applicable.
MultiLane Inc. products are covered by U.S. and foreign
patents, issued and pending. Information in this
publication supersedes that in all previously published
material. Specifications and price change privileges
reserved.
General Safety Summary
Review the following safety precautions to avoid injury
and prevent damage to this product or any products
connected to it. To avoid potential hazards, use this
product only as specified.
Only qualified personnel should perform service
procedures.
While using this product, you may need to access other
parts of the system. Read the General Safety Summary in
other system manuals for warnings and cautions related to
operating the system.
To Avoid Fire or Personal Injury
Use Proper Power Cord. Only use the power cord specified
for this product and certified for the country of use.
Observe All Terminal Ratings. To avoid fire or shock
hazard, observe all ratings and markings on the product.
Consult the product manual for further ratings information
before making connections to the product.
Do not apply a potential to any terminal, including the
common terminal that exceeds the maximum rating of that
terminal.
Do Not Operate Without Covers.
Do not operate this product with covers or panels removed.
Avoid Exposed Circuitry. Do not touch exposed
connections and components when power is present.
Do Not Operate with Suspected Failures.
If you suspect there is damage to this product, have it
inspected by qualified service personnel.
Do Not Operate in Wet/Damp Conditions. Do Not Operate
in an Explosive Atmosphere. Keep Product Surfaces Clean
and Dry
Caution statements identify conditions or
practices that could result in damage to this product or
other property.

3
CONTENTS
This User Manual consolidates instructions to operate the MultiLane ML4015D Digital Sampling
Oscilloscope.
CONTENTS........................................................................................................................ 3
INTRODUCTION ................................................................................................................ 4
Product Features......................................................................................................................5
Power Requirements ...............................................................................................................5
Ordering Information...............................................................................................................6
Product Description .................................................................................................................6
Overview .......................................................................................................................................................6
Key Features..................................................................................................................................................7
Scope Measurement Suite ............................................................................................................................7
Target Applications .......................................................................................................................................8
Product Software.....................................................................................................................9
Minimum PC Requirements ..........................................................................................................................9
Installation..................................................................................................................... 10
System Start-up ..................................................................................................................... 10
DSO GUI Overview................................................................................................................. 11
DSO Configuration ................................................................................................................. 12
DSO Menu ............................................................................................................................. 14
Status Bar.............................................................................................................................. 18
Oscilloscope Measurements................................................................................................... 19
Filters .................................................................................................................................... 27
S Parameter Mode................................................................................................................. 30
Frequency Domain Mode ....................................................................................................... 35
APPENDIX....................................................................................................................... 36
Appendix I: USB Driver Installation......................................................................................... 36
Appendix II: How to connect this instrument .......................................................................... 37
Appendix III: Ethernet Configuration ...................................................................................... 38
Appendix IV: SIRC Calibration Methods .................................................................................. 38
Appendix V: Preserve Noise Feature....................................................................................... 40

4
INTRODUCTION
Acronym
Definition
BW
Bandwidth
NRZ
Non-Return to Zero
DUT
Device Under Test
SONET
Synchronous Optical Networking
SOC
System on a Chip
PCIe
Peripheral Component Interconnect Express
SATA
Serial Advanced Technology Attachment
PAM4
Pulse Amplitude Modulation
ORR
12G Wideband Optical Reference Receiver
Sim
Simulation
Conf
Configuration
PRD
Product Requirements Document
HW, FW, SW
Hardware, Firmware, Software
RF
Radio Frequency
Gbps
Gigabits per second
PC Mode
Pattern Capture Mode
GUI
Graphical User Interface
THD
Total Harmonic Distortions

5
Product Features
Power Requirements
Parameter
Symbol
Conditions
Min
Typ
Max
Units
Current from +5 V Supply
External
1.5
A
The typical power dissipation for the DSO is 7.5 W; the module can be powered from an external source 5
V/1.5 A through a power cable.

6
Ordering Information
Product Description
▪
Installation explains how to configure and install the instrument as well as how to
install the included system software
▪
Incoming Inspection provides a verification procedure for basic operation and
functionality
▪
Accessories and Options lists the instrument options available along with the
standard/optional accessories for this product.
Overview
The DSO Digital Sampling Oscilloscope (DSO) is a fully integrated, ultra-compact USB/
Ethernet controlled instrument that automatically performs accurate eye diagram and
pattern capture analysis to characterize the quality of transmitters and receivers,
interconnecting with a specified input BW. It is operational under Windows and Linux.
The DSO implements a statistical under-sampling technique with comprehensive software
libraries for eye measurement, jitter analysis and processing of NRZ data, thus enabling:
▪
Eye measurements with the following classes of operation:
oOscilloscope Measurements
oNRZ Measurements
oPAM4 Measurements
oMultiple measurements
oMask Test
▪
Advanced pattern acquisition with pre-emphasis measurements.
▪
Jitter component decomposition
▪
Filtering
▪
S-parameter generation & de-Embedding
▪
Frequency domain plots and THD measurements
Option
Description
ML4015D-
Single Channel DSO
25-SM
25 GHz optical, single-mode fiber
25-MM
25 GHz optical, multi-mode fiber
40-SM
40 GHz optical, single-mode fiber
E-32
32 GHz electrical
E-50
50 GHz electrical
E-50-24
50 GHz electrical, 2.4 mm connectors
3YW
3-year warranty

7
Key Features
▪
High-value instrument grade sampling scope optimized for high speed data analysis.
▪
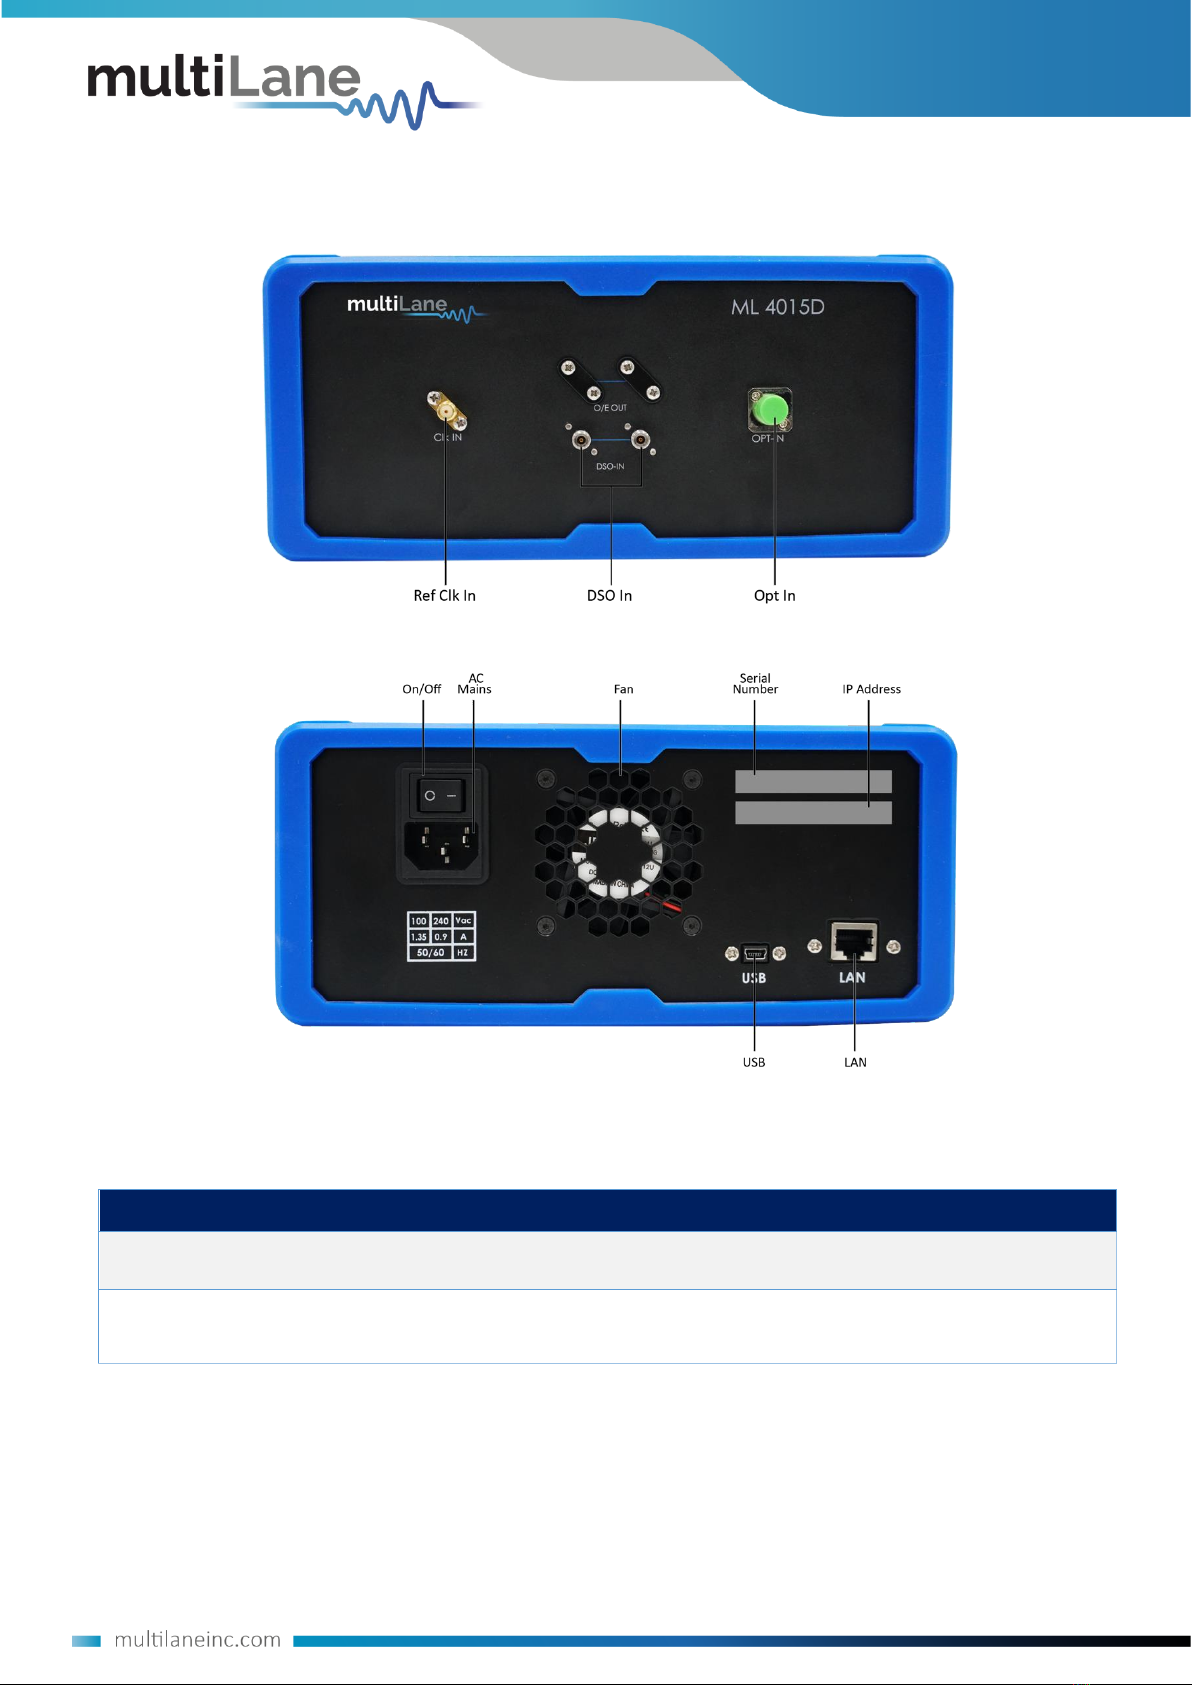
External reference clock input
▪
Single ended and differential electrical inputs supported
▪
Eye capture, jitter, rise/fall, histogram, mask measurement, pattern capture, S21 Capture &
frequency domain, all in a single instrument.
▪
Multiple modules can be controlled via fast Ethernet 100Base-T
▪
The DSO tool can operate in a data acquisition only mode where the data is saved on
multiple acquisitions for post processing.
▪
Supports high density parallel application with scalable concurrent testing.
▪
Ultra-compact form factor replaces conventional rack test solutions and solves impractical
physical requirements of testing large lane counts. DSO can mount into the Verigy 93K.
▪
User friendly GUI enables zooming, markers, X/Y histograms, overlays, pre-emphasis with
simultaneous measurement statistical captures
▪
Load and analyze data that was previously captured in simulation mode
▪
Capability to save statistical measurements, data files and configurations
▪
Color graded display for visualizing jitter and noise distributions
▪
Standard stress masks selection for LRM pre-cursor, LRM post-cursor, LRM symmetric and
LRM Clean Eye
▪
Mask user defined, auto-detect mask support
▪
Percentage of failing points
▪
Save data and mask
▪
Load mask file
Scope Measurement Suite
▪
Mask margin, alternate mask margin rules available
▪
The mask margin (positive or negative) can be extracted for a defined number of points that
fail, thus allowing for DUT quality assessment, control and binning
▪
The number of failed points for a region can be returned as well as the actualpoints that
failed
▪
Eye opening, eye height and width, eye amplitude, top, base, hi, lo, peak to peak, max, min
▪
Rise/ fall time, single edge measurement in patterncapture
▪
Total edge jitter
▪
Statistical histogram measurements
▪
Crossing point, crossing percentage
▪
Advanced pattern measurements:
o
Eye measurements on specific bits of thepattern

8
o
Single edge measurement in pattern capture
o
Pre-emphasis (positive and negative, height andwidth)
▪
Jitter analysis
o
Deterministic jitter.
o
Random jitter.
▪
S-parameters & harmonic distortions
Target Applications
Figure 1: DSO Application
▪
Interconnect testing (SFP, SFP28, CFP, CFP2, CFP4, QSFP, QSFP28,...)
▪
Backplane testing
▪
Interference and crosstalk testing
▪
Receiver sensitivity testing
▪
Receiver jitter tolerance testing equalizer characterization
▪
Electro-optical module testing
▪
Electrical stressed eye testing for 100 Gbps Ethernet, MLD/CAUI application, OIF CEI- 28G-
VSR, CPPI-4, CAUI-4, 32G Fiber Channel chip tomodule (c2m)
▪
High speed SerDes testing & characterization
▪
Handheld 10G test equipment for field Installation andmaintenance
▪
Multi-port or line card system testing
▪
In-Situ testing of high port countsystems
▪
Can be mounted in Automatic Test Equipment (ATE) or in socketed loadboard
▪
Telecom equipment tests for installation andmaintenance
▪
Fiber channel, Ethernet, PON, parallel optics,etc.
▪
High port count burn-in test
▪
Research and development applications

9
Product Software
Figure 2: DSO GUI
Minimum PC Requirements
The Windows PC properties for the MultiLane software must meet the following specifications:
▪
Windows XP SP3 or greater
▪
Minimum 2 GB RAM
▪
1 Ethernet card to establish connection with the device
▪
USB connector
▪
Pentium 4 processor 2.0 GHz or greater
▪
.NET Framework 4.0
NOTE: It is recommended to connect the DSO via Ethernet to a single PC only, preventing conflict
from multiple user commands.

10
Installation
This section address installation and bring-up of the instrument, addressing the following topics:
- System start-up
- Connection guide
System Start-up
To use the DSO under Windows XP, Windows 7 and Vista, it is important that the correct start-up
sequence is followed:
▪
Ensure Microsoft .NET Framework 4.0 is installed
▪
Install the DSO GUI software
▪
Connect the power cable to the power jack and field it with a +5 V/ 1.5 A supply
▪
Note power plug is already included in the package accessories.
▪
Communication through USB to the instrument is required to configure its own IP only
▪
Install the USB driver to the PC (Appendix I)
▪
Change the IP of the DSO to fit in the network range by and using the software DSO Conf
(Appendix III)
▪
Communication through Ethernet port is required for data acquisition
▪
Connect the PC to the DSO through an Ethernet cable, no driver required
▪
Now the DSO is powered up, having the right IP, the Ethernet cable links the instrument to
the PC with the GUI correctly installed
▪
To open the GUI, double click on the software icon located in the Desktop directory
▪
In order to characterize the signals fielding the instrument, check the Data and Connection
configuration
NOTE: This release supports Ethernet connection for the software applications, and the USB port
is used only to configure the device IP Address (note that the IP should be in the same range of the
network)

11
DSO GUI Overview
Figure 3: GUI
▪
Click the connect button at the top left of your screen
▪
The “Connect to DSO” window will pop up
▪
Click on the add button to add the virtual DSO
▪
The “DSO configuration” window opens
▪
If both software the DSO and simulator are hosted on the samecomputer, choose the
“Simulation” mode
▪
If one of the GUI instances is being run on a different PC, choose “Hardware” instead
of “Simulation” and enter the “IP” of the PC where the simulator isrunning
▪
Click on the refresh button in order to retrieve the simulator configuration, or
configure the DSO by filling the “DSO configuration” window for the relevant IP
address
NOTE: Any data file that has already been saved using the DSO software can be loaded.

12
DSO Configuration
Connection Configuration
Change the configuration as needed:
▪
The default display name of the target DSO can be edited as preferred
▪
The IP of the DSO connected by writing it next to “IP” label
▪
Name the DSO by populating the “Name” label
▪
Click on the hardware radio button to use the instrument; fill in IP and Channel
Data Configuration
The DSO has 3 SMA inputs (two for the differential data RF Input + and RF Input –, and one
for the Clock input).
External Clock Operation
Clock Input in normal mode ranges between 5 and 525 MHz (710 MHz for certain models):
▪
Choose the Normal Operation radio button to use the onboard timing generator.
▪
Enter the target line rate less Line Rate (Gbps) into the Gbit Rate field or choose a
Gbps value, example: 10.709, 10.625, 10.3125, 9.95328, 8.5, 6.25, 4.25 and 3.125
▪
Specify the number of packets; it can be 4, 8, 16, 32, 64, 128, 256 or 512
Each packet consists of 512 sample points per UI, which are duplicated when drawing the eye.
Eg: 256 packets correspond to 131072 points per pattern, and 262144 points per eye (131072
for each of the 2 UIs displayed in eye mode).
Figure 4. DSO Configuration
▪
Enter the percentage level of rising and falling times in the NRZ Thresholds field
▪
Enter the External Reference Clock Frequency in MHz or as a factor of the bit rate

13
▪
Clock rate can vary from 50 MHz to (525/710) MHz, with an amplitude range from 0.05
to 1.5 Vpp
▪
Typically, this will be rate / 16, 64, or 80, but can be any other rate as well
▪
Enter the Pattern Length of the data feeding the DSO to capture the full pattern
Note: Incorrect pattern length would still display the eye capture, however full pattern
capture is required for certain features of the software such as Jitter Decomposition,
PTB and Filters.
E.G.: Pattern Length = 127 for PRBS-7, The Pattern length of PN(n) is (2^n) - 1.
▪
To get wander correction, check the box then choose between the 3 frequencies, 1024
or 2048 or 4096 Hz
▪
In order to retrieve the last configuration, enter the specified IP and then press the
refresh button
▪
In order to scale the measured results, to remove the effect of an attenuator
connected at the receiving end of the scope, enter the Attenuation value in dB. In
optical mode, the value is doubled when the attenuator is at 3 dB. In electrical mode
this is 6 dB.
▪
To capture more points for finer measurements, accumulate the number of points
from all the acquisitions by entering the total number of points to persist in the
accumulate field. This will set the number of points filling the entire eye diagram. For
both UI’s, half this number of points will be displayed in the pattern diagram.
Accumulation works in infinite persistence mode, and unless the points are cleared or
the connection is reset, all acquisitions will take part in the accumulated result with
equal amounts of points randomly selected from each acquisition.
AOP Offset Correction
This field enables ML4015D users to offset (or shift) the actual power values reported from
the photocurrent of the photodiode power supply which represents the actual AOP of the
DUT signal with a reading resolution of 16 bits.
Attenuator Compensation
This field is specifically relevant to legacy platforms like the ML4005D and ML4005C, where
the average of the captured 1 and 0 levels is used to determine the DUT measurement. These
legacy systems featured a DC coupled O/E.

14
Wander Compensation
The time-base Wander Compensation checkbox enables or disables the Time Base Wander
Correction for a measurement. Small variations in the DSO internal reference time base
appear as low-frequency jitter (wander) in the acquired signal.
For mask tests and edge jitter measurements, the DSO analyzes the acquired samples and
removes the effect of the temporal drift (wander). Wander correction improves the accuracy
of DSO measurements but may increase the time to acquire data. For applications where
measurement speed is important, disabling wander correction is suggested. Reducing the
number of blocks to less than 128 significantly reduces the effect of wander and increases
throughput.
Figure 5: Wander Compensation
DSO Menu
Figure 6: DSO menu bar
File Menu
Save: after clicking on this icon, a save window appears enabling to save configurations, data
and measurements files for each acquisition.
In the case of being connected to multiple DSOs, there are check boxes next to each DSO,
check the one related to the needed DSO and save preferences. Each checked DSO has a
separate folder. If the 3 options Conf, Data and Measurements are checked; in this folder 3
kinds of files will be found.
Conf: select to save the configuration file.
Data: select to save the data file.
Measurements: select to save the statistical measurements files.

15
The version for this software can be found after selecting the “About Us” under “help”
menu option. Then, the following information will be displayed:
Zooming can be done by clicking on the graph and dragging, which would draw a dotted
window. When the mouse is released, the graph will zoom to display only the content within
the drawn box. This method of zooming may alter aspect ratio of the graph is the drawn box
is of disproportional dimensions.
Zooming also can be done using the mouse wheel when the Ctrl button is held. This method
will maintain the original aspect ratio of the graph.
In order to go back to the initial view, right click on the graph, and choose “Undo All Zoom/
Plan”
Panning
The position of the graph in the display window can be panned by dragging the graph with
the mouse while the Ctrl key is held.

16
Copy, Save, Undo Zoom and Print a Graph
Right clicking the graph exposes these features:
Copy: copy the present graph as an image into clipboard.
Save Image As: save the present graph in the desired location.
Page Setup: view page information for printing.
Print: print the graph.
Show point values: display the coordinates of points when hovering over
them in the graph.
Un-Zoom: undo the last zooming performed.
Undo All Zoom/ Plan: undo/reset all zoom actions.
Operating Modes
Figure 7: Supported DSO GUI Operating Modes
Selecting Operating Modes in upper right corner allows navigation between:
▪
Eye Measurement Mode:
oOscilloscope Measurements
oMultiple measurements
oNRZ Measurements
oPAM4 Measurements
oMask Test
▪
Pattern Capture Mode including jitter decomposition
▪
S-Parameter Mode
▪
Frequency Domain Mode

17
Eye Measurement Mode
Regardless of hardware or simulation mode, it is possible to draw the eye and capture
measurements after filling the configuration window and connecting to the instrument.
In Eye Mode, in order to draw the eye diagram, click on the Start Data Acquisition button
Check the Check All button to view all the eye measurements down the screen for one time
or select the needed measurement only by pressing on the desired icons. Use the second
option to reduce measurement operation time.
Figure 8: Measurements Mode
If a large number of acquisitions need to be captured, click on the Repetitive check box, then
press the Start Data Acquisition button . Check the Count Text box and specify the number
of acquisitions to automatically stop captures after a certain number of measurements.
By default, the measurements are displayed continuously. In this case, the eye diagram is
frozen after the first acquisition.
By default, Eye Mode is chosen; if you are located in Pattern Capture mode, to move to the
select Switch to Eye Mode to switch back.
During the acquisition phase the Start Data Acquisition button becomes a red stop acquisition
functionality. Clicking on the red stop button will stop after completing the acquisition
currently in progress and will display the eye and its statistical measurements.
In order to restart the acquisitions, click again on the Start Data Acquisition button; a new
set of acquisitions begins. Accumulated data continues across several runs if not cleared.
In order to save data, statistical measurements and configuration files, check the Saved Data
folder under the deployment directory. A folder is created for each ML-DSO and inside of this
folder the user can find 3 different files; statistical measurements, configuration and the data
file.

18
Status Bar
Number of Samples
The status bar displays the number of kilo-samples captured in the Eye mode.
‘1K Samples’is equivalent to 1000 sample points in the Eye graph, including accumulated
point when applicable.
Operation Status
Operation Status
Status Description
Gathering Data
Acquiring data (reading from hardware)
Saving Data
Saving data in the data file
Error Connecting to DSO
A connection between SW and HW cannot be established
Error Applying Wander
Compensation on DSO
Wander cannot be applied because an eye cannot be detected at
the first place
Saving Results
Saving acquired data points and statistical measurements into their
file
Displaying Results
Showing the statistical measurements and refreshing the graph
Acquisition Finished
Acquiring data and sampling is finished
Table 1: Operation Status Messages
How to add multiple ML-DSO Channels/Disconnect/Reconfigure
▪
To add a new ML-DSO channel, press the Add New ML-DSO Channel button in the
Connect to ML-DSO configuration window; fill it and connect
▪
To disconnect from a specified ML-DSO, simply click on the Close button next to its
name in the Connect to ML-DSO form
▪
To reconfigure the data, click the Edit ML-DSO Configuration icon, and then fill the
configuration window as preferred
▪
To add multiple ML-DSOs, repeat the first step

19
Oscilloscope Measurements
While capturing the eye, a user can perform measurements by
simply clicking the corresponding buttons: Top, Base, Min, Max,
Fall time, Rise time, Peak to Peak, Eye Amplitude, Eye Height, Eye
Width, Jitter, and the crossing percentage. The Check All text box
can be selected to capture all the measurements in one action.
When multiple DSOs are connected, and after drawing all the
eyes or patterns, the measurements are displayed for all DSOs
down the screen in the tables.
Markers
This feature by default is off; in order to use it, switch it to on by choosing the On radio button,
under the Markers group box.
A pair of movable markers in both X-axis and Y-axis is displayed. The horizontal and vertical
markers help bound the measurement region by giving the difference between the 2
horizontal and vertical markers.
The results are displayed in the top of the graph. Picosecond or UI is the unit of the X axis; mV
is the unit of the Y axis.
Figure 9: DSO Markers
▪
First select the marker to be moved; it should be highlighted in yellow
▪
Drag the markers to the required location
▪
The marker values displayed in the textboxes bottom left can be used to manually specify
the marker positions
▪
Markers help verify horizontal and vertical measurements, such as jitter, eye width, eye
height, and mask margins. They can be dragged manually to view the delta or difference
between 2 markers.

20
Measurements
Measurement
Description
Screenshot
Histogram
The X and Y histograms show the density
distribution of the samples along the x and y
axes:
Top
The average y-value of the high-to-high
transitions.
Base
The average y-value of the low-to-low
transitions.
One and Zero
Levels
The average y-values at 20% around centerof
the eye
Min
The minimum sample value.
Table of contents
Other MULTILANE Test Equipment manuals
Popular Test Equipment manuals by other brands

Seaward
Seaward PrimeTest 300 operating instructions

Megger
Megger VLF Sinus user guide

DH Instruments
DH Instruments ADCS-601-AF Operation and maintenance manual

GW Instek
GW Instek GDS-3000 Series user manual

Hanna Instruments
Hanna Instruments HI 38077 instruction manual

Bante Instruments
Bante Instruments ECscan10 instruction manual