LogBox-DA Datalogger
NOVUS AUTOMATION 3/7
START LOGGINGS
Immediately: The logger starts logging as soon as the configuration
is applied. Not valid when the option ‘Daily Repetition’ is selected.
Day / Hour: Logging starts at a defined date and time. The date
defined is used for the Daily Repetitions option as well.
STOP LOGGINGS
At Full Memory: Loggings can be stored up to the full memory
capacity is reached.
Wrap around: Logging never stops. The LogBox-DA will keep on
recording the readings and when the memory is full it will overwrite
the oldest record in a circular or wrap around manner.
After a defined number of readings: The logger will stop logging
after the number of readings here defined is reached. Not valid when
the option Daily Readings is selected.
Day / Hour: The LogBox-DA will stop logging at the user-defined
date and time. Not valid when the option ‘Daily Repetition’ is
selected.
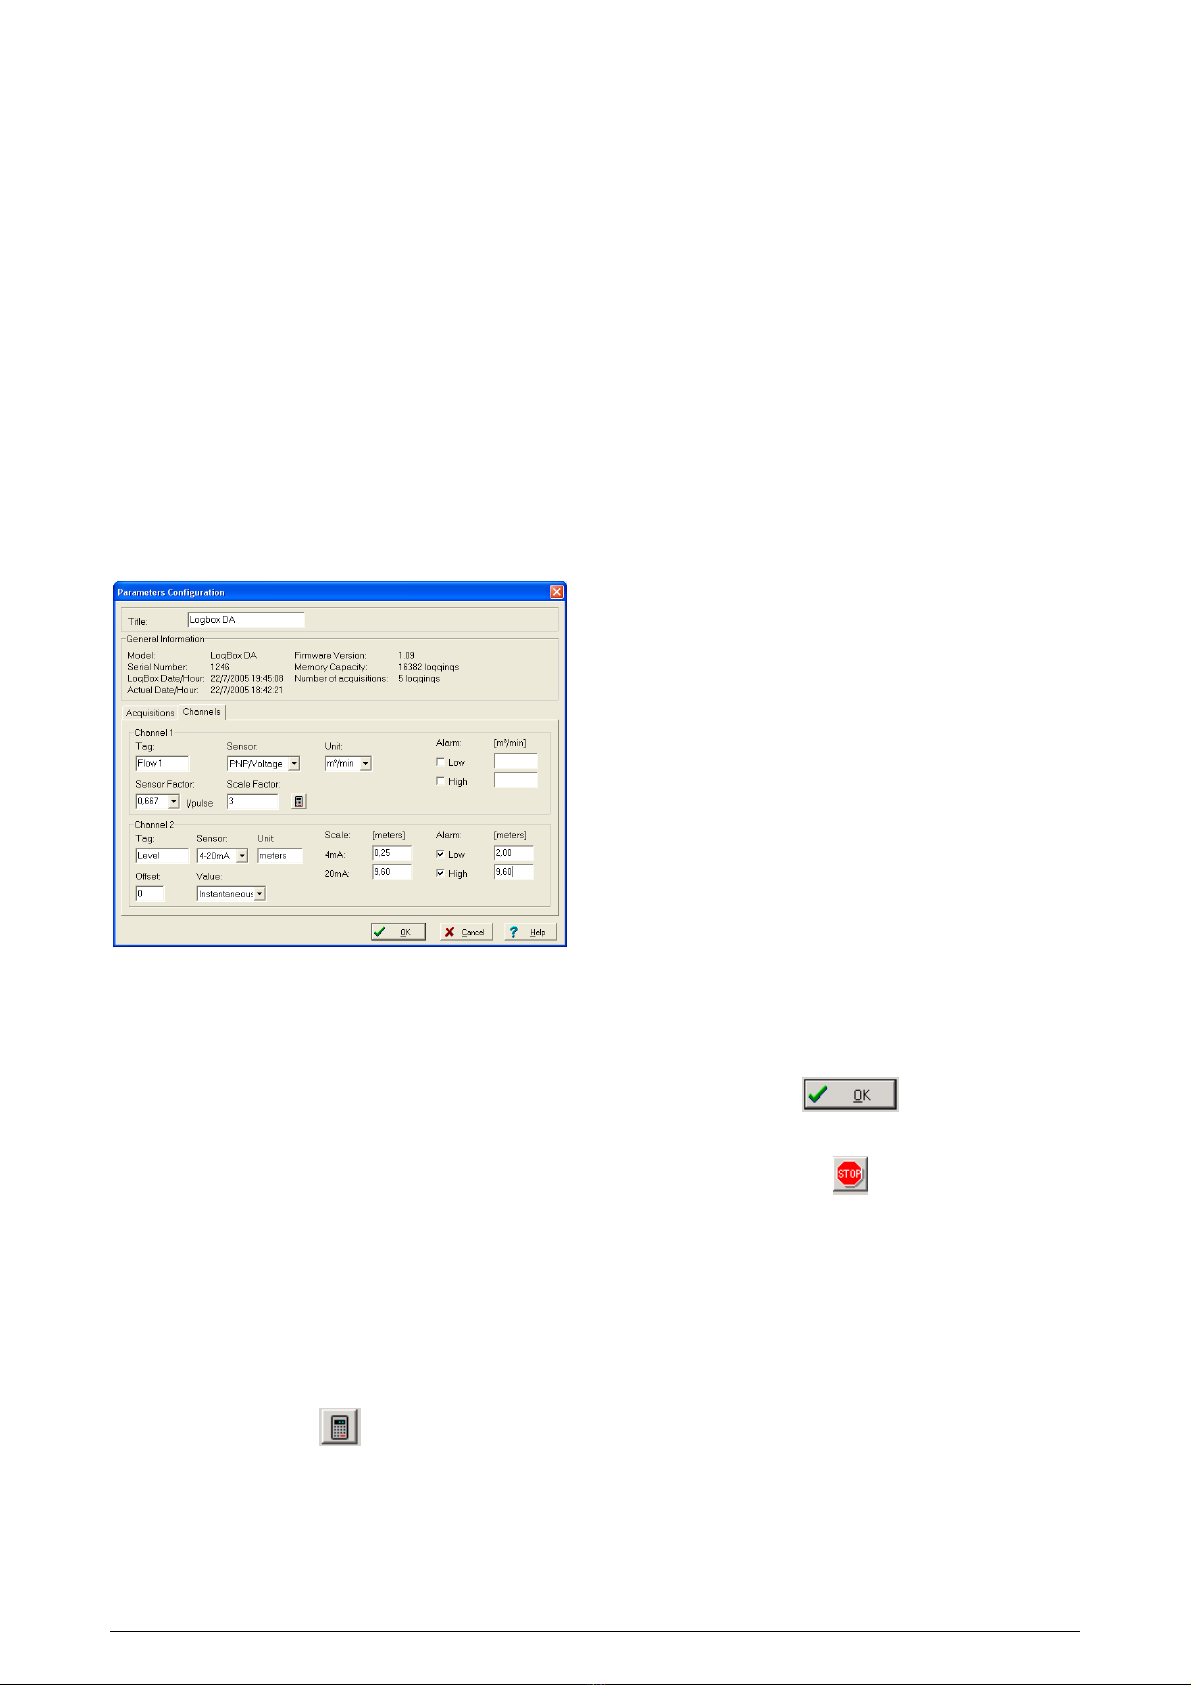
CHANNELS
By selecting the “Channels” tab, the user is able to choose the
individual settings for each input channel, as Fig. 7 shows.
Fig. 7 – Parameters for Input Channels Configuration
CHANNEL 1 – DIGITAL PULSE LOGGINGS
Configuration options provided for Channel 1 are:
Tag: Defines a name (up to 8 characters) for identifying the variable
to be measured.
Sensor: selects the input type of the channel: Unabled,
PNP/Voltage, NPN, Dry Contact.
Unit: Defines the input variable unit. Flow measurement is default,
however, other units can be defined by typing the unit in the text box.
Sensor Factor: Defines the amount of input per pulse. Li uids flow
measurement is default (liters per pulse.) It can assume any value
between 0.000001 and 16383.
Scale Factor: Adjusts the readings such as to represent a particular
flow measurement unit. This factor can be automatically calculated
(the software computes the value taking into account the interval
between loggings and the sensor factor) by using the button:
It can assume values between 0,000001 and 65535.
Alarm: The routines for alarms LOW and HIGH are executed at the
end of the logging period, informing the occurrence of an alarm by
flashing the alarm LED in the front panel.
LOW defines the minimum value under which the alarm is triggered;
HIGH defines the maximum value above which the alarm is
triggered. Once activated, the alarm LED indicator stays so even
after the alarm-triggering situation has ceased.
CHANNEL 2 – ANALOG INPUT
The options provided for Channel 2 configurations are:
Tag: Defines a name (up to 8 characters) for identifying the variable
to be measured.
Input: The signal applied to the logger second input is defined here.
The following options are offered: None (disabled), 4-20 mA, 0-20
mA, 0-50 mV, 0-10 V. The option selected must be compatible with
the LogBox internal jumper configuration. See configurations on
Table 1.
Unit: Defines the variable unit.
Scale: Defines the range, in engineering units, for representing the
input variable measured in input 2. Adjustable: 0 to 65535, 65535 to
0, -32768 to 32767, 32767 to -32768.
Offset: Allows fine offset corrections on the measured value.
Value: Defines readings recording mode:
•Instantaneous: The instant value read at the logging time.
•Average: Arithmetic average of 10 consecutive samples
e ually spaced over the logging interval.
•Minimum: Records in memory the minimum value of 10
consecutive readings in the logging interval.
•Maximum: Records in memory the minimum value of 10
consecutive readings in the logging interval.
Alarm: The routines for alarms LOW and HIGH are executed every
time the logger samples the inputs, informing the occurrence of an
alarm by flashing the alarm LED in the front panel.
LOW defines the minimum value under which the alarm is triggered;
HIGH defines the maximum value above which the alarm sensor is
triggered. Once activated, the alarm LED indicator stays so even
after the alarm-triggering situation has ceased.
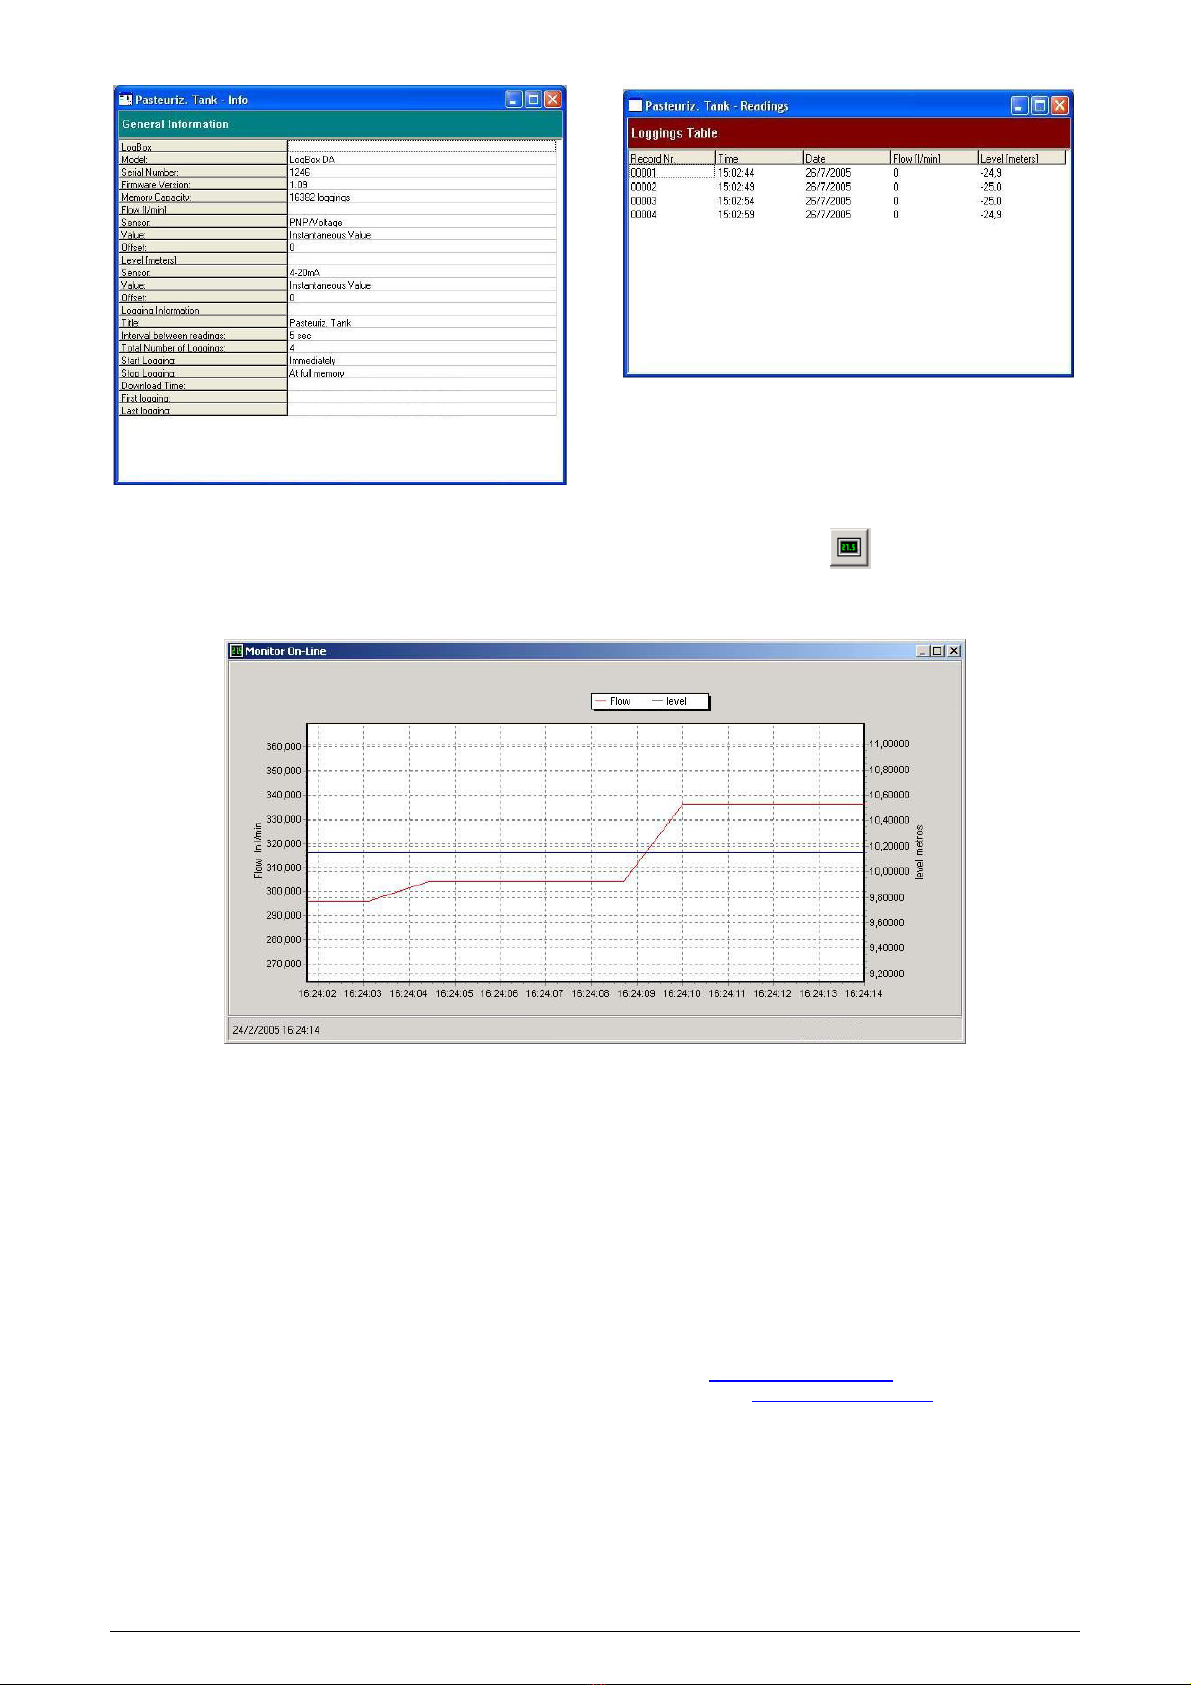
After filling all the fields, send the configuration to the logger by
clicking on the button:
To stop loggings, click on the button:
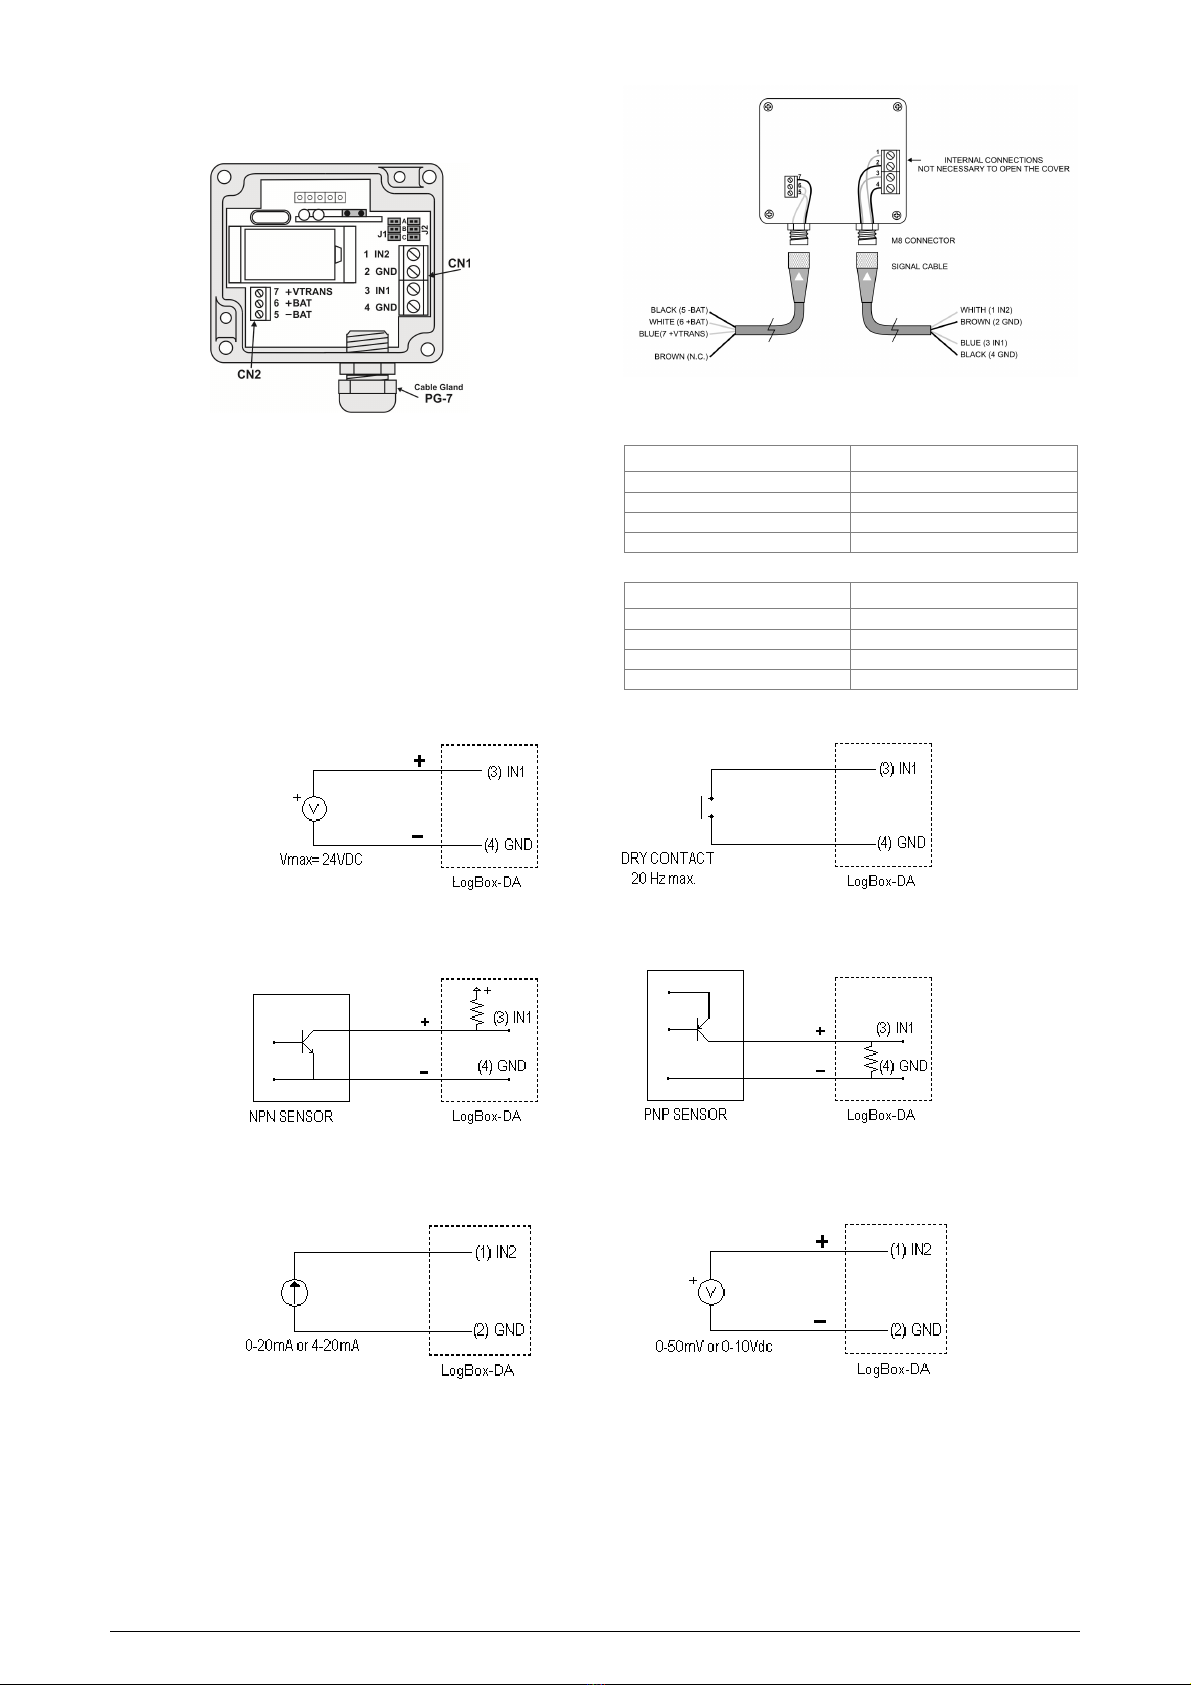
ELECTRICAL CONNECTIONS
Only the input channels connections and the External Battery Switch
(when used) are needed. The logger is exclusively powered by its
internal battery.
In the IP65 models, the inputs and the signal for activating the
external power supply are located inside the logger case, which must
be opened for accomplishing the connections.
In the IP67 model, proper connectors are provided for this purpose,
as shown in Fig. 9.
CONNECTIONS IN THE IP65 MODEL
Open the logger’s cover to get access to the block terminals and the
configuration jumpers. Connection cables must pass through the
compress fitting located at the bottom of the case. Figure 8 indicates
the signals polarity.