PASCO Spark SLS User manual

SPARK SLS
User's Guide
Version 1.4.0
012-10616E

SPARK SLS User's Guide
012-10616E
Version 1.4.0
Limited Warranty
For a description of the product warranty, see the PASCO catalog.
Copyright
This user’s guide is copyrighted with all rights reserved. Permission is granted to non-profit
educational institutions for reproduction of any part of this manual, providing the reproductions
are used only in their laboratories and classrooms, and are not sold for profit. Reproduction
under any other circumstances, without the written consent of PASCO scientific, is prohibited.
Trademarks
PASCO, PASCO scientific, DataStudio, PASPORT, SPARK, SPARK Science Learning System,
SPARKlab, SPARKbook, SPARKvue, SPARKvue HD, Xplorer, and Xplorer GLX are trademarks or
registered trademarks of PASCO scientific, in the United States and/or in other countries. All
other brands, products, or service names are or may be trademarks or service marks of, and
are used to identify products or services of their respective owners. For more information visit
www.pasco.com/legal.
Software Licenses
All required licenses for software components of SPARKvue, SPARKvue HD, and the SPARK
Science Learning System can be found on the CD-ROM or DVD-ROM included with the product
or are included in the software download. To obtain source code for GPL/LGPL licensed software
components, contact PASCO at by phone at 1-800-772-8700 (in the U.S), +1 916 786 3800
(worldwide), or by email at support@pasco.com

Contents
1 Introduction 1
About the SPARK Science Learning System 1
Getting started 1
Technical and Teacher Support 1
2 Starting an experiment 2
Turning on the SPARK SLS 2
Connecting sensors to the SPARK SLS 2
Connecting PASPORT sensors 3
Connecting a temperature probe 3
Connecting a voltage probe 3
Monitoring live data 3
Moving on from the Home screen 4
Opening a SPARKlab 4
Showing a SPARKlab 4
Building a SPARKlab 5
3 Setting up an experiment 8
Customizing data collection 8
Setting the sample rate 8
Putting SPARK into periodic sampling mode 8
Putting SPARK into manual sampling mode 9
Setting an automatic stop condition 9
Customizing how numbers are displayed 10
Setting the number of decimal places displayed 10
Setting the number of significant figures displayed 10
Displaying numbers in scientific notation 11
Changing the units of a measurement 11
Changing the units of a measurement in an existing display 11
Changing the default units of a measurement 12
Calibrating sensors 12
Selecting a measurement to calibrate and a calibration type 12
Performing a calibration 13
012-10616E i

Contents
Performing a 2-point calibration 13
Performing a 1-point offset-only calibration 13
Performing a 1-point slope-only calibration 14
Using sensor adapters 14
Connecting a sensor through a Digital Adapter or Photogate Port 14
Connecting a sensor through an Analog Adapter 14
4 Data recording 16
Recording a run of periodically sampled data 16
Recording a set of manually sampled data 16
Deleting data runs 18
5 Data display 19
Displaying data in a line graph 19
Creating a new line graph 19
Showing and hiding the line graph tool palette 20
Adjusting the scale of a line graph 20
Scaling a graph to fit all data 20
Scaling by direct manipulation 20
Selecting data to show in an existing line graph 21
Showing and hiding data runs in a graph 21
Changing the variable on the x- or y-axis 22
Selecting data for operation in a line graph 22
Selecting a data run for operation in a line graph 22
Selecting part of a data run for operation in a line graph 23
Annotating data in a line graph 24
Adding an annotation 24
Editing or deleting an annotation 25
Displaying data in a Multiple y-axis graph 26
Creating a multiple y-axes line graph 26
Working with multiple y-axes 27
Lock origin of multiple y-axes 28
Displaying data in a bar graph 28
Creating a new bar graph 28
012-10616E ii

Contents
Showing and hiding the bar graph tool palette 30
Showing data in bar graphs 30
Adding bars and bar names in bar graphs 30
Editing bars and bar names in bar graphs 32
Adding data in bar graphs 32
Entering data into bar graph manually 32
Collecting data for bar graph using a sensor 33
Adding additional data runs to a bar graph 34
Adding additional data runs to a bar graph using sensor readings 34
Showing and hiding data runs in a bar graph 34
Selecting data for operation in a bar graph 35
Annotating data in bar graphs 35
Adding annotations to bars 36
Editing or deleting annotations to bars 37
Showing numeric values on bars 37
Viewing bar graphs 38
Scrolling a bar graph 39
Scaling a bar graph to show all data 39
Scaling a bar graph by expanding or compressing the axes 39
Customizing axes labels and units on bar graphs 40
Displaying data in a table 41
Creating a new table 41
Showing and hiding the table tool palette 42
Scrolling a table 42
Selecting data to show in an existing table 43
Selecting a run for display in an existing column 43
Changing the variable displayed in an existing column 43
Adding a column 44
Removing a column 44
Selecting cells for operation in a table 45
Displaying data in a digits display 46
Creating a new digits display 46
012-10616E iii

Contents
Showing and hiding the digits display tool palette 47
Changing the variable in a digits display 47
Displaying data in a meter 48
Creating a new meter 48
Showing and hiding the meter tool palette 49
Adjusting the scale of a meter 49
Scaling a meter to fit all data 49
Setting the scale of a meter 49
Changing the variable displayed in a meter 50
Customizing the appearance of a meter 50
6 Image capture 52
Connecting a camera or other video device 52
Displaying a camera image 52
Showing and hiding the image tool palette 54
Capturing a camera image 54
Switching between live and captured camera images 55
Selecting a captured camera image for display 56
Adjusting the scale and position of a camera image 56
Measuring in a camera image 57
Placing a Measurement tool 58
Moving a Measurement tool 58
Deleting a Measurement tool 59
Calibrating camera image measurements 60
Drawing on a camera image 61
Drawing 61
Erasing 62
Erasing all 63
Annotating a camera image 64
Adding an annotation 64
Moving an annotation 66
Editing an annotation 66
Deleting an annotation 67
012-10616E iv

Contents
Naming an image 68
Deleting an image 69
Exporting an image 70
7 Data analysis 71
Analyzing data in a graph 71
Viewing statistics in a line graph 71
Applying a curve fit 72
Removing a curve fit 72
Drawing a prediction 73
Finding the x- and y-values of a point 73
Finding the x- and y-difference between two points 74
Finding the slope at a point on a data plot 76
Finding the correlation coefficient (r) 76
Displaying the RMSE Root-Mean-Square Error 77
Analyzing data in a multiple-y axes graph 78
Viewing Statistics in a bar graph 79
Viewing statistics in a table 80
Viewing statistics in a digits display 81
Viewing statistics in a meter 81
8 Calculations and manually entered data 83
Working with calculations 83
Opening the calculator screen 83
Creating a calculation 83
Displaying a calculation 84
Entering data manually 84
Opening the measurements list 85
Creating a data set for manual entry 86
Creating a data set for manually entered numbers 86
Creating a data set for manually entered text 86
Preparing a table for manual data entry 86
Entering data into a manual data set 87
Displaying manually entered data 87
012-10616E v

Contents
Editing manually entered data 88
9 Building SPARKlab pages 89
Starting a new SPARKlab page 89
About adding elements to a SPARKlab page 90
Removing an element 91
Adding a display to a SPARKlab page 91
Adding a line graph 92
Adding a table 92
Adding a digits display 92
Adding a meter 93
Adding a text box 93
Adding a camera element 93
Adding an image 94
Removing or replacing an image in a image box 95
Locking an image 95
Deleting a SPARKlab page 96
10 Saving and sharing 97
Saving a SPARKlab 97
Printing a lab 97
Exporting data 98
Opening a saved lab 99
Opening a lab saved on a USB flash drive 99
Managing files and folders 99
Creating a new folder 99
Deleting a file or folder 100
Moving a file 100
Copying a file 101
11 Keeping a journal 102
Taking a snapshot 102
Opening the journal 102
Adding a caption to a snapshot or editing an existing caption 103
Navigating in the journal 103
012-10616E vi

Contents
Deleting a journal entry or snapshot 103
Rearranging journal entries 104
Closing the journal 104
Saving a journal 104
Exporting a journal 104
Printing a journal 105
12 Common tasks 106
Turning pages 106
Returning to the Home screen 106
Entering text and numbers using the on-screen keyboard 106
Opening the About SPARK SLS screen 107
Setting the language 108
13 Managing the SLS device 109
Turning off the SPARK Science Learning System 109
Updating the SPARK Science Learning System 109
Charging the battery 109
How battery status is indicated 110
Setting the date and time 111
About sleep modes 111
Reactivating the SPARK Science Learning System when it is in sleep mode 112
Customizing sleep modes 112
Adjusting the screen brightness 113
Calibrating the touch-screen 113
Opening the About SPARK SLS screen 113
Product End of Life Disposal Instructions 114
SPARK Battery Replacement and Disposal Instructions 114
012-10616E vii

1 Introduction
About the SPARK Science Learning System
1 Introduction
lAbout the SPARK SLS
lGetting started
lTechnical and Teacher Support
About the SPARK Science Learning System
The SPARK Science Learning System is an all-in-one mobile device that seamlessly integrates
the power of probeware with inquiry-based content and assessment. With its large, full-color
display, finger-touch navigation and data collection and analysis capabilities, SPARK redefines
the concept of easy-to-use — so the focus remains on the learning of science.
The SPARK Science Learning System (SPARK SLS) is designed to become the center of your
school's discovery-based science learning environment, providing both teacher and student the
embedded support for exploring scientific concepts.
The SPARK Science Learning System includes 61 free pre-installed SPARKlabs™ — standards-
based guided inquiry labs in a unique electronic notebook format. These SPARKlabs integrate
background content, data collection and analysis, even assessment — all within the same envi-
ronment. Everything you need is right there in context.
Getting started
There are three basic ways to start an investigation in SPARK SLS. They are:
lOpen an embedded SPARKlab and follow the on-screen instructions;
lShow a SPARKlab with one measurement in a graph, table, digits display, and meter; and
lBuild a custom SPARKlab with your choice of data, displays, text, and pictures.
To start learning SPARK SLS, install the software, connect an interface to your computer, plug in
a sensor, and start the software from the desktop icon. If you need help doing a task, you'll find
step-by-step instructions in this guide.
Technical and Teacher Support
For help with SPARK SLS and other PASCO products, you can contact PASCO's Technical and
Teacher Support staff by phone, email, or on the Web.
Phone: 1-800-772-8700 (in the U.S.)
+1 916 786 3800 (worldwide)
Email: support@pasco.com
Web: www.pasco.com/support
012-10616E 1
2 Starting an experiment
Turning on the SPARK SLS
2 Starting an experiment
1. Turning on the SPARK SLS
2. Connecting sensors to the SPARK SLS
3. Monitoring live data
4. Moving on from the Home screen
Turning on the SPARK SLS
1. If the battery is not charged, connect the included AC adapter to a wall outlet and to the
AC adapter port on the bottom of the SPARK.
2. Press and hold the power button.
The SPARK turns on, boots up, and displays the Home screen.
1.AC adapter port. 2.Power button.
Connecting sensors to the SPARK SLS
1.PASPORT ports. 2.Temperature port. 3.Voltage port.
012-10616E 2

2 Starting an experiment
Monitoring live data
You can use up to two PASPORT sensors plus a temperature probe and a voltage probe.
Complete one or more of the following tasks to connect sensors to the SPARK.
lConnecting PASPORT sensors
lConnecting a temperature probe
lConnecting a voltage probe
Connecting PASPORT sensors
1. Plug a PASPORT sensor into one of the PASPORT ports on the top of the SPARK SLS.
2. Optionally, plug a second PASPORT sensor into the other PASPORT port.
Connecting a temperature probe
Plug the included fast-response temperature probe (or other type of temperature probe) into
the temperature port on the top of the SPARK SLS.
Connecting a voltage probe
Plug the included voltage probe into the voltage port on the top of the SPARK SLS.
Monitoring live data
Live data from all connected sensors are displayed whenever the Home screen is open.
The Home screen is the first screen that appears when SPARK SLS starts.
If the Home screen is not visible, touch the Home button to return to the Home screen.
012-10616E 3

2 Starting an experiment
Moving on from the Home screen
With the Home screen displayed, you are ready to move into a SPARKlab. A SPARKlab is a
multi-page environment where your science investigation takes place.
Complete one of the following tasks to open an embedded SPARKlab, show a measurement in
a SPARKlab, or build a custom SPARKlab.
Opening a SPARKlab
The SPARK Science Learning System includes over 60 embedded SPARKlabs. Complete these
steps to open a SPARKlab:
1. Connect the sensors required for the SPARKlab that you wish to do.
2. If there are unneeded sensors connected, disconnect them.
3. In the Home screen, touch Open.
A list of folders appears.
4. Touch the folder corresponding your subject area.
5. If necessary, touch a subfolder.
6. Touch the SPARKlab that you would like to open.
7. Touch OK.
The SPARKlab opens.
Follow the on-screen instructions to continue your science investigation. Touch the Page Navi-
gator to turn pages.
Showing a SPARKlab
A show-path SPARKlab is the fastest way to record data and display it in a graph, table, digits
display, and meter. Complete these steps to show a SPARKlab:
1. Connect a sensor.
2. In the Home screen, touch the measurement that you would like to show.
The selected measurement is highlighted.
3. Touch Show.
Note: A measurement must be selected for Show to be available.
A four-page SPARKlab opens.
012-10616E 4

2 Starting an experiment
Moving on from the Home screen
Touch the Start button to record data.
Touch the Page Navigator to see your data in the different displays.
Building a SPARKlab
When you build a custom SPARKlab, you design each page with your choice of measurements
and displays. You can also add text and pictures. Complete these steps to start building a
SPARKlab:
1. Connect a sensor (or sensors).
2. In the Home screen, touch Build.
The Page-build screen opens.
Page-build screen: 1.Measurements. 2.Data display, image box, text box, and spacer
buttons. 3.Preview.
3. Touch the measurement (or measurements) that you would like to show in the first data
display.
012-10616E 5

2 Starting an experiment
Moving on from the Home screen
Selected measurements are highlighted. Touch a measurement again to clear a selec-
tion.
4. Touch one of the data display buttons for a graph, table, digits display, or meter.
Data display buttons: graph, digits display, table, and meter.
If you touch just one measurement, all data displays are available. If you touch two
measurements, only the graph and table are available. If you touch three or more meas-
urements, only the table is available.
The measurements and display that you have touched appear in the preview section of
the page-build screen.
5. Optionally, do any of the following:
lRepeat the steps above to select more measurements and add another data dis-
play.
lTouch one of the image box buttons to add a large or small image box. (After the
page has been added to the SPARKlab, you can touch the image box to select an
image to display in the box.)
lTouch one of the text box buttons to add a large or small text box. (After the page
has been added to the SPARKlab, you can touch the text box to enter text.)
lTouch the Undo button to remove an element from the preview.
6. When you are satisfied with the preview and ready to build your page, touch OK.
Your new SPARKlab opens showing the page that you have just built.
012-10616E 6

2 Starting an experiment
Moving on from the Home screen
Touch the Start button to record data.
Touch the New Page button to build another page and add it to your SPARKlab.
012-10616E 7

3 Setting up an experiment
Customizing data collection
3 Setting up an experiment
lCustomizing data collection
lCustomizing how numbers are displayed
lCalibrating sensors
lUsing sensor adapters
Customizing data collection
You can start recording data using the default settings, or complete one or more of the fol-
lowing tasks to change the sampling rate or sampling mode.
lSetting the sample rate
lPutting SPARK SLS into periodic sampling mode
lPutting SPARK SLS into manual sampling mode
lSetting an automatic stop condition
Setting the sample rate
With SPARK SLSin periodic sampling mode (the default mode), complete these steps to set how
many data points are recorded each second or how much time elapses between data points:
1. Touch the Sampling Options button.
The Sampling Options screen opens.
2. Touch the Sample Rate Unit: box and touch Hz, seconds, minutes, or hours.
3. Touch the Sample Rate: box and touch a value.
4. Touch OK.
Putting SPARK into periodic sampling mode
In periodic sampling mode (the default mode, sometimes known as “continuous” mode),
SPARK records data points at regular intervals. If SPARK is in manual sampling mode, complete
these steps to put it into periodic sampling mode:
012-10616E 8

3 Setting up an experiment
Customizing data collection
1. Touch the Sampling Options button.
The Sampling Options screen opens.
2. Touch Periodic.
3. Touch OK.
Putting SPARK into manual sampling mode
In manual sampling mode, a single value from each measurement is recorded each time you
manually trigger SPARK. Complete these steps to put SPARK into manual sampling mode:
1. Touch the Sampling Options button.
The Sampling Options screen opens.
2. Touch Manual.
3. Touch OK.
Setting an automatic stop condition
When a stop condition is set, SPARK SLS automatically stops recording data after a set time
interval. Complete these steps to set a stop condition:
1. Touch the Sampling Options button.
The Sampling Options screen opens.
2. Under Automatic Stop Condition, touch the Condition: box and touch Stop after duration.
3. Touch the Value: box and enter a time value.
4. Touch the Units: box and touch units of time.
5. Touch OK.
012-10616E 9

3 Setting up an experiment
Customizing how numbers are displayed
lSetting the number of decimal places displayed
lSetting the number of significant figures displayed
lDisplaying numbers in scientific notation
lChanging the units of a measurement
Setting the number of decimal places displayed
1. Touch the Experiment Tools button.
The Experiment Tools screen opens.
2. Touch DATA PROPERTIES.
The Data Properties screen opens.
3. Touch the Measurement: box and touch a measurement or other variable.
4. Touch Number Format.
The number format options appear.
5. Touch the Number Style: box and touch Fixed Precision.
6. Use the Digits: arrows to select the number of digits to be displayed after the decimal
point.
7. Touch OK.
Setting the number of significant figures displayed
1. Touch the Experiment Tools button.
The Experiment Tools screen opens.
2. Touch DATA PROPERTIES.
The Data Properties screen opens.
3. Touch the Measurement: box and touch a measurement or other variable.
4. Touch Number Format.
The number format options appear.
5. Touch the Number Style: box and touch Significant Figures.
6. Use the Digits: arrows to select the number of significant figures to be displayed.
7. Touch OK.
012-10616E 10

3 Setting up an experiment
Customizing how numbers are displayed
Displaying numbers in scientific notation
1. Touch the Experiment Tools button.
The Experiment Tools screen opens.
2. Touch DATA PROPERTIES.
The Data Properties screen opens.
3. Touch the Measurement: box and touch a measurement or other variable.
4. Touch Number Format.
The number format options appear.
5. Touch the Number Style: box and touch Scientific Notation.
6. Use the Digits: arrows to select the number of digits to be displayed.
7. Touch OK.
Changing the units of a measurement
Do one or both of the following tasks to select different units for a measurement.
lChanging the units of a measurement in an existing display
lChanging the default units of a measurement
Changing the units of a measurement in an existing display
Complete these steps to change the units of a measurement displayed in an existing graph, dig-
its display, table, or meter:
1. Touch the Tools button of a graph, digits display, table, or meter to open the tools pal-
ette.
2. Touch the Properties button to open the Properties screen.
3. Touch the Units: box and select a unit of measure.
4. Touch OK.
The display shows the measurement with the selected units.
012-10616E 11
Table of contents
Other PASCO Science Education Product manuals

PASCO
PASCO ES-9080B User manual

PASCO
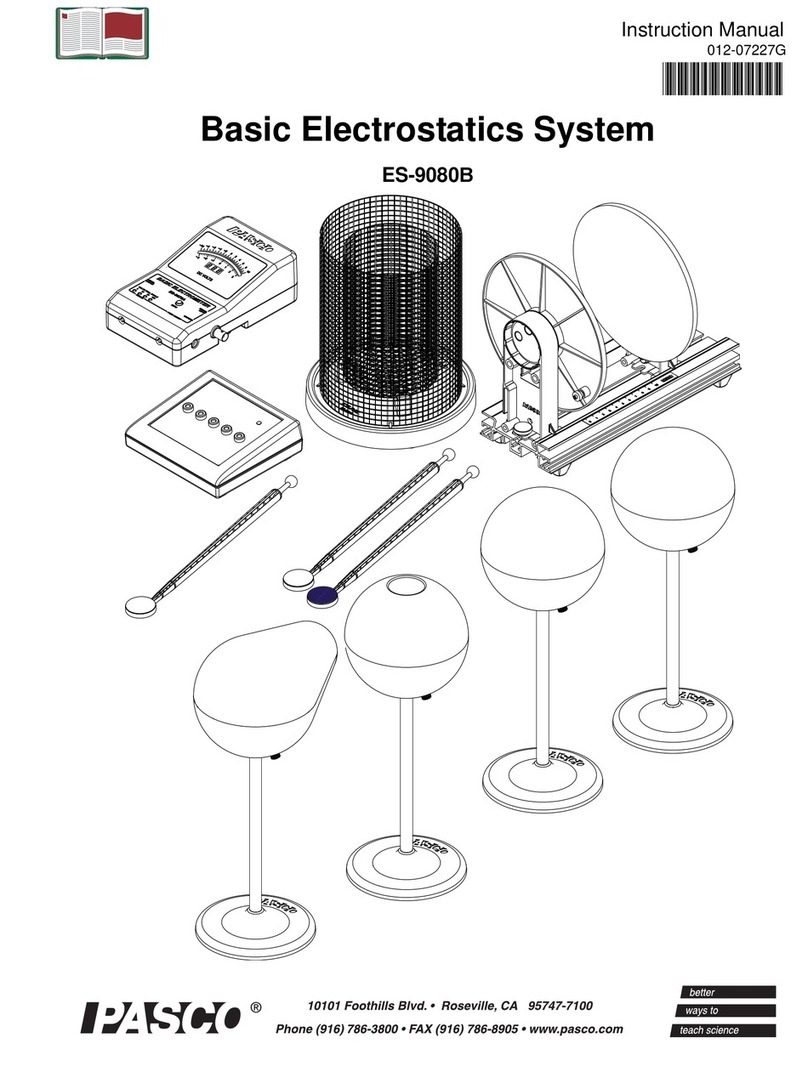
PASCO Basic Electrostatics System User manual

PASCO
PASCO ME-7018 User manual

PASCO
PASCO ES-9070 User manual

PASCO
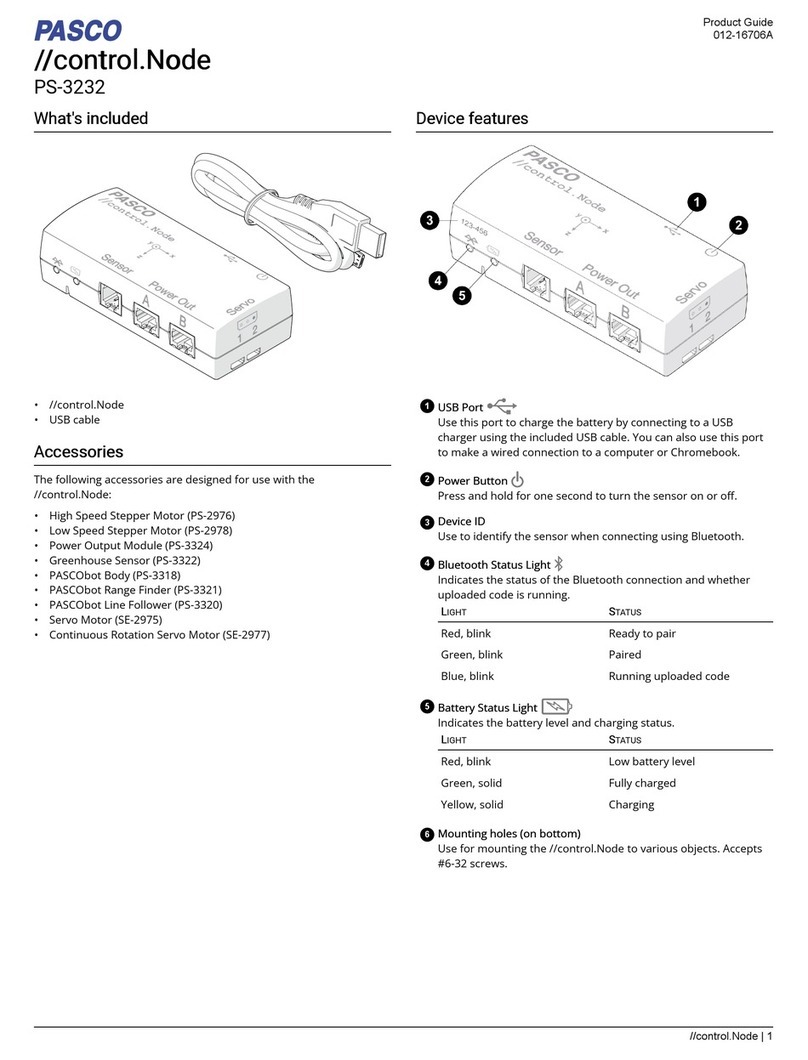
PASCO //control.Node User manual

PASCO
PASCO EM-3536 User manual

PASCO
PASCO Node Cart User manual

PASCO
PASCO ME-9885A User manual

PASCO
PASCO PS-3553 User manual

PASCO
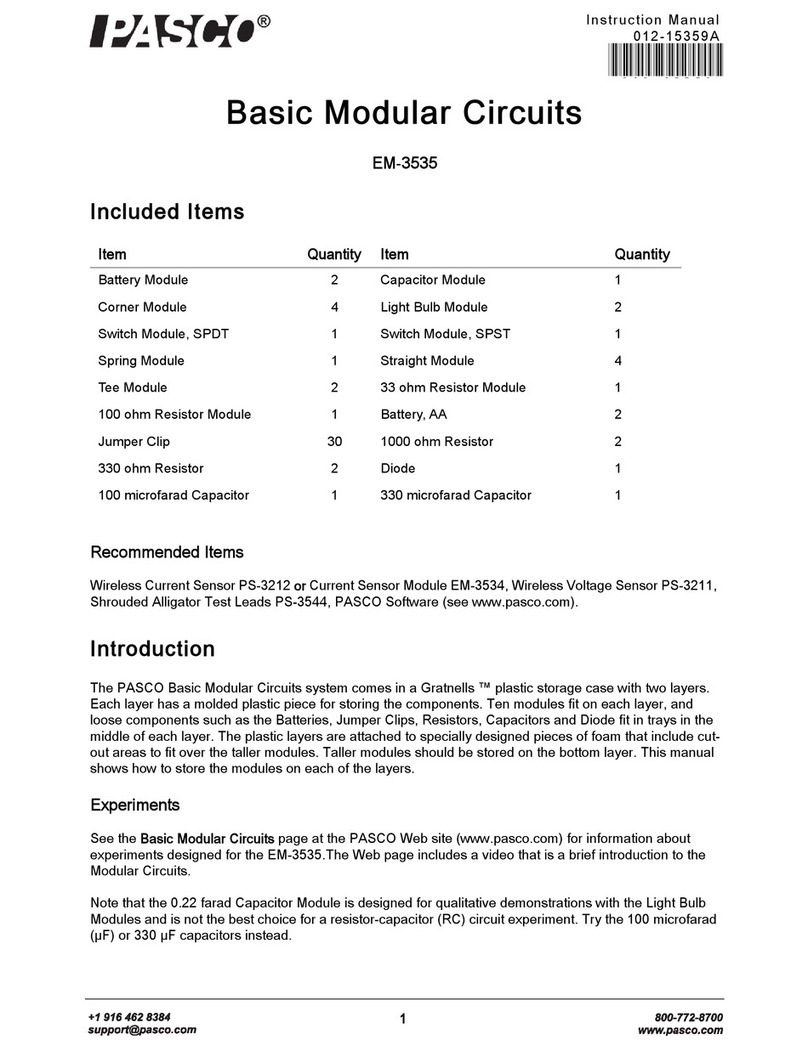
PASCO EM-3535 User manual