Waters XBridge Peptide BEH C18 Guide

[ CARE AND USE MANUAL ]
1
CONTENTS
I. GETTING STARTED
a. Column Installation
b. Column Equilibration
c. Initial Column Efficiency Determination
II. COLUMN USE
a. Sample Preparation
b. Operating pH Limits
c. Solvents
d. Pressure
e. Temperature
III. SCALING UP/DOWN ISOCRATIC METHODS
IV. TROUBLESHOOTING
V. COLUMN CLEANING, REGENERATING,
AND STORAGE
a. Cleaning and Regeneration
b. Storage
VI. CONNECTING THE COLUMN
TO THE HPLC SYSTEM
a. Column Connectors and
System Tubing Considerations
b. Measuring System Band Spreading Volume
c. Measuring Gradient Delay Volume
(or Dwell Volume)
VII. eCORD INTELLIGENT CHIP TECHNOLOGY
(applies only to XBridge XP 2.5 m,
≤4.6 mm I.D. Columns )
Thank you for choosing a Waters® XBridge® Peptide BEH
C18, 130Å or 300Å Column. The XBridge Peptide BEH C18,
130Å and 300Å packing materials were designed to provide
excellent peak shape, high efficiency, and excellent stability.
The XBridge Peptide BEH C18, 130Å and 300Å packing materials
are manufactured in a cGMP, ISO 9002 certified plant using
ultra pure reagent. Each batch of XBridge Peptide BEH C18
Column material has been qualified with a peptide separation,
and the results are held to narrow specification ranges to
assure excellent, reproducible performance for peptide
separations. Every column is tested and a Performance Test
Chromatogram, along with a Certification of Acceptance, are
provided with each column.
XBridge Peptide BEH C18, 130Å and 300Å Columns
VIII. ADDITIONAL INFORMATION
a. Use of Narrow-Bore (3.0 mm I.D.)
b. Impact of Band Spreading Volume
on 2.1 mm I.D. Column Performance
c. Non-Optimized vs. Optimized
LC-MS/MS System:
System Modification Recommendations
IX. REPRESENTATIVE TEST CHROMATOGRAPH
AND CONDITIONS FOR SEPARATION OF
PROTEIN DIGEST
X. CAUTIONARY NOTE

2XBridge Peptide BEH C18, 130Å and 300Å Columns
[ CARE AND USE MANUAL ]
. GETTING STARTED
Each XBridge Peptide BEH C18, 130Å and 300Å Column
comes with a Certificate of Acceptance and a Performance
Test Chromatogram. The Certificate of Acceptance is
specific to each batch of packing material contained in the
peptide column and includes the batch number, analysis
of unbonded particles, analysis of bonded particles, and
chromatographic results and conditions. The Performance
Test Chromatogram is specific to each individual column and
contains the column’s: batch number, column serial number,
USP plate count, USP tailing factor, retention factor, and
chromatographic conditions. These data should be stored
for future reference.
a. Column Installation
Note: The flow rates given in the procedure below are for typical 5 µm
packing in a 4.6 mm I.D. column. Scale the flow rate up or down accordingly
based upon the column I.D., length, particle size, and backpressure of the
peptide column being installed. See “Scaling Up/Down Isocratic Separations”
section for calculating flow rates when changing column I.D. and/or length.
See “Connecting the Column to the HPLC System” for a more detailed
discussion on HPLC connections.
1. Purge the pumping system of any buffer-containing mobile
phases and connect the inlet end of the column to the
injector outlet. An arrow on the column identification label
indicates the correct direction of solvent flow.
2. Flush column with 100% organic mobile phase (methanol
or acetonitrile) by setting the pump flow rate to 0.1 mL/min
and increase the flow rate to 1 mL/min over 5 minutes.
3. When the mobile phase is flowing freely from the column
outlet, stop the flow and attach the column outlet to the
detector. This prevents entry of air into the detection
system and gives more rapid baseline equilibration.
4. Gradually increase the flow rate as described in step 2.
5. Once a steady backpressure and baseline have been
achieved, proceed to the next section.
Note: If mobile phase additives are present in low concentrations
(e.g., ion-pairing reagents), 100 to 200 column volumes may be required
for complete equilibration. In addition, mobile phases that contain formate
(e.g., ammonium formate, formic acid, etc.) may also require longer initial
column equilibration times.
b. Column Equilibration
XBridge Peptide BEH C18, 130Å and 300Å Columns are
shipped in 100% acetonitrile. It is important to ensure mobile
phase compatibility before changing to a different mobile
phase system. Equilibrate the column with a minimum of
10 column volumes of the mobile phase to be used (refer to
Table 1 for a listing of empty column volumes).
To avoid precipitating out mobile phase buffers on your
column or in your system, flush the column with five column
volumes of a water/organic solvent mixture, using the same or
lower solvent content as in the desired buffered mobile phase
(for example, flush the column and HPLC system with 60%
methanol in water prior to introducing 60% methanol/40%
buffer mobile phase).
c. Initial Column Efficiency Determination
1. Perform an efficiency test on the column before using it
in the desired application. Waters recommends using a
suitable solute mixture, as found in the “Performance Test
Chromatogram,” to analyze the column upon receipt.
2. Determine the number of theoretical plates (N) and use
this value for periodic comparisons.
3. Repeat the test at predetermined intervals to track column
performance over time. Slight variations may be obtained
on two different HPLC Systems due to the quality of the
connections, operating environment, system electronics,
reagent quality, column condition, and operator technique.

3XBridge Peptide BEH C18, 130Å and 300Å Columns
[ CARE AND USE MANUAL ]
Table 1. Empty Column Volumes in mL (multiply by 10 for flush solvent volumes)
Column internal diameter (mm)
Column length (mm) 1.0 2.1 3.0 4.6 10 19 30
50 0.04 0.17 0.35 0.83 3.9 14 35
100 0.08 0.35 0.71 1.7 7.8 28 70
150 0.12 0.52 1.06 2.5 12 42 106
250 –0.87 –4.2 20 70 176
II. COLUMN USE
To ensure the continued high performance of XBridge Peptide BEH C18, 130Å and 300Å Columns, follow these guidelines:
a. Sample preparation
1. Sample impurities often contribute to column
contamination. One option to avoid this is to use Waters
Oasis® Solid-Phase Extraction Cartridges/Columns or
Sep-Pak® Cartridges of the appropriate chemistry to
clean up the sample before analysis.
2. It is preferable to prepare the sample in the operating
mobile phase or a mobile phase that is weaker (less
organic modifier) than the mobile phase for the best
peak shape and sensitivity.
3. If the sample is not dissolved in the mobile phase, ensure
that the sample, solvent, and mobile phases are miscible
in order to avoid sample and/or buffer precipitation.
4. Filter sample with 0.2 m filters to remove particulates.
If the sample is dissolved in a solvent that contains an
organic modifier (e.g., acetonitrile, methanol, etc.) ensure
that the filter material does not dissolve in the solvent.
Contact the filter manufacturer with solvent compatibility
questions. Alternatively, centrifugation for 20 minutes
at 8000 rpm, followed by the transfer of the supernatant
liquid to an appropriate vial, could be considered.
b. Operating pH limits
The recommended operating pH range for XBridge Peptide
BEH C18, 130Å and 300Å Columns is 1 to 12. A listing of
commonly used buffers and additives is given in Table 2.
Additionally, the column lifetime will vary depending upon
the operating temperature, the type and concentration of
buffer used.

4XBridge Peptide BEH C18, 130Å and 300Å Columns
[ CARE AND USE MANUAL ]
Table 2. Buffer Recommendations for Using XBridge Peptide BEH C18, 130Å and 300Å Columns from pH 1 to 12
Additive/Buffer pKaBuffer
range
Volatility
(±1 pH unit)
Used for
mass spec Comments
TFA 0.3 –Volatile Yes Ion pair additive, can suppress MS
signal, used in the 0.02–0.1% range.
Acetic acid 4.76 –Volatile Yes
Maximum buffering obtained when
used with ammonium acetate salt.
Used in 0.1–1.0% range.
Formic acid 3.75 –Volatile Yes
Maximum buffering obtained when
used with ammonium formate salt.
Used in 0.1–1.0% range.
Acetate
(NH4CH2COOH) 4.76 3.76–5.76 Volatile Yes Used in the 1–10 mM range.
Note: Sodium or potassium salts are not volatile.
Formate (NH4COOH) 3.75 2.75–4.75 Volatile Yes Used in the 1–10 mM range.
Note: Sodium or potassium salts are not volatile.
Phosphate 1 2.15 1.15–3.15 Non-volatile No Traditional low pH buffer, good UV
transparency.
Phosphate 2 7.2 6.20–8.20 Non-volatile No
Above pH 7, reduce temperature/
concentration and use a guard column
to maximize lifetime.
Phosphate 3 12.3 11.3–13.3 Non-volatile No
Above pH 7, reduce temperature/
concentration and use a guard column
to maximize lifetime.
4-Methylmorpholine ~8.4 7.4–9.4 Volatile Yes Generally used at 10 mM or less.
Ammonia (NH4OH) 9.2 8.2–10.2 Volatile Yes Keep concentration below 10 mM and
temperatures below 30 °C.
Ammonium
bicarbonate
10.3 (HCO3
-)
9.2 (NH4
+)8.2–11.3 Volatile Yes
Used in the 5–10 mM range (for MS work
keep source >150 °C ). Adjust pH with
ammonium hydroxide or acetic acid.
Good buffering capacity at pH 10.
Note: Use ammonium bicarbonate (NH4HCO3),
not ammonium carbonate ([NH4]2CO3).
Ammonium (acetate) 9.2 8.2–10.2 Volatile Yes Used in the 1–10 mM range.
Ammonium (formate) 9.2 8.2–10.2 Volatile Yes Used in the 1–10 mM range.
Borate 9.2 8.2–10.2 Non-volatile No Reduce temperature/concentration and
use a guard column to maximize lifetime.
CAPSO 9.7 8.7–10.7 Non-volatile No
Zwitterionic buffer, compatible with
acetonitrile, used in the 1–10 mM range.
Low odor.
Glycine 2.4, 9.8 8.8–10.8 Non-volatile No Zwitterionic buffer, can give longer
lifetimes than borate buffer.
1-Methylpiperidine 10.2 9.3–11.3 Volatile Yes Used in the 1–10 mM range.
CAPS 10.4 9.5–11.5 Non-volatile No
Zwitterionic buffer, compatible with
acetonitrile, used in the 1–10 mM range.
Low odor.
Triethylamine
(as acetate salt) 10.7 9.7–11.7 Volatile Yes
Used in the 0.1–1.0% range. Volatile
only when titrated with acetic acid (not
hydrochloric or phosphoric). Used as
ion-pair for DNA analysis at pH 7–9.
Pyrrolidine 11.3 10.3–12.3 Volatile Yes Mild buffer, gives long lifetime.

5XBridge Peptide BEH C18, 130Å and 300Å Columns
[ CARE AND USE MANUAL ]
c. Solvents
To maintain maximum column performance, use high quality
chromatography grade solvents. Filter all aqueous buffers
prior to use. Pall Gelman Laboratory Acrodisc® filters are
recommended. Solvents containing suspended particulate
materials will generally clog the outside surface of the inlet
distribution frit of the column. This will result in higher
operating pressure and poor performance.
d. Pressure
XBridge Peptide BEH C18, 130Å and 300Å Columns containing
3.5 m, 5 m, or 10 m particles can tolerate pressures up to
6000 psi (400 bar or 40 Mpa). Although, pressures greater
than 4000–5000 psi should be avoided in order to maximize
column and system lifetimes.
XBridge Peptide BEH C18, 130Å and 300Å XP 2.5 m Columns
are compatible with HPLC, UHPLC, and UPLC pressures.
Table 3. Maximum Operation Pressure
Column I.D. Pressure Range
2.1 mm 18,000 psi (1034 bar)
3.0 mm 18,000 psi (1034 bar)
4.6 mm 9000 psi (620 bar)
e. Temperature
Temperatures between 20–60 °C are recommended for
operating XBridge Peptide BEH C18, 130Å and 300Å Columns
in order to enhance selectivity, lower solvent viscosity and
increase mass transfer rates. However, any temperature above
ambient will have a negative effect on lifetime which will vary
depending on the pH and buffer conditions used.
Note: Under certain reversed-phase separation conditions (mobile phase,
temperature, etc.) some proteins or peptides may exhibit secondary
interactions with the column packing materials or hardware resulting
in low recovery or poor peak shape. Repeating several injections of the
sample or another protein (for example, bovine serum albumin) until
consistent chromatographic performance is achieved can resolve this issue.
Additionally, in order to develop a robust separation method, the analyst
should also optimize the separation conditions being used to minimize any
observed secondary interactions
III. SCALING UP/DOWN ISOCRATIC METHODS
The following formulas will allow scale up or scale down, while
maintaining the same linear velocity, and provide new sample
loading values:
If column I.D. and length are altered:
F2= F1(r2/r1)2
Load2= Load1(r2/r1)2(L2/L1)
Injection volume2= Injection volume1(r2/r1)2(L2/L1)
Where: r = Radius of the column
F = Flow rate
L = Length of column
1 = Original, or reference column
2 = New column
IV. TROUBLESHOOTING
Changes in retention time, resolution, or backpressure are
often due to column contamination. See the “Column Cleaning,
Regeneration, and Storage” section. Information on column
troubleshooting problems may be found in “HPLC Columns
Theory, Technology and Practice”, U.D. Neue, (Wiley-VCH, 1997),
the Waters HPLC Troubleshooting Guide p/n: 720000181EN) or
visit www.waters.com for seminar information.
V. COLUMN CLEANING, REGENERATION,
AND STORAGE
a. Cleaning and Regeneration
Changes in peak shape, peak splitting, shoulders on the
peak, shifts in retention, change in resolution, or increasing
backpressure may indicate contamination of the column.
Flushing with a neat organic solvent, taking care not to
precipitate buffers, is usually sufficient to remove the
contaminant. If the flushing procedure does not solve the
problem, purge the column using the following cleaning and
regeneration procedures.
Use the cleaning routine that matches the properties of the
samples and/or what you believe is contaminating the column
(see Table 4). Flush columns with 20 column volumes each
of HPLC-grade solvents (e.g., 80 mL total for 4.6 x 250 mm
column) listed in Table 4. Increasing mobile phase temperature
to 35–55 °C increases cleaning efficiency. If the column
performance is poor after cleaning and regeneration, call your
local Waters office for additional support.

6XBridge Peptide BEH C18, 130Å and 300Å Columns
[ CARE AND USE MANUAL ]
Table 4. Cleaning and Regeneration
Sequence or Options
Polar samples Proteinaceous samples
1. Water
Option 1: Inject repeated 100 L aliquots
of dimethylsulfoxide (DMSO) using
a reduced flow rate delivering
50% Eluent A and 50% Eluent B.
2. Methanol
Option 2: gradient of 10% to 90% B where:
A = 0.1% trifluoroacetic acid (TFA) in water,
and B = 0.1% trifluoroacetic acid (TFA) in
acetonitrile (CH3CN).
3. Isopropanol Option 3: Flush column with 7 M
guanidine hydrochloride, or 7 M urea.
Note: To avoid potentially damaging precipitation within your column (e.g., if
your separation eluent contains phosphate buffer), be certain to flush column
with 5 to 10 column volumes of water BEFORE using suggested organic
eluent column wash procedures.
b. Storage
For periods longer than four days at room temperature, store
the column in 100% acetonitrile. Immediately after use with
elevated temperatures and/or at pH extremes, store in 100%
acetonitrile for the best column lifetime. Do not store columns
in highly aqueous (<20% organic) mobile phases, as this may
promote bacterial growth. If the mobile phase contained a
buffer salt, flush the column with 10 column volumes of HPLC
grade water (see Table 1 for common column volumes) and
replace with 100% acetonitrile for storage. Failure to perform
this intermediate step could result in precipitation of the
buffer salt in the column or system when 100% acetonitrile is
introduced. Completely seal column to avoid evaporation and
drying out of the bed.
Note: If a column has been run with a mobile phase that contains formate
(e.g., ammonium formate, formic acid, etc.) and is then flushed with
100% acetonitrile, slightly longer equilibration times may be necessary
when the column is re-installed and run again with a formate-containing
mobile phase.
VI. CONNECTING THE COLUMN TO
THE HPLC SYSTEM
a. Column Connectors and System
Tubing Considerations
Tools needed:
3/8 inch wrench
5/16 inch wrench
Handle the column with care. Do not drop or hit the column on a
hard surface as it may disturb the bed and affect its performance.
1. Correct connection of 1/16 inch outer diameter stainless
steel tubing leading to and from the column is essential
for high-quality chromatographic results.
2. When using standard stainless steel compression screw
fittings, it is important to ensure proper fit of the 1/16 inch
outer diameter stainless steel tubing. When tightening
or loosening the compression screw, place a 5/16 inch
wrench on the compression screw and a 3/8 inch wrench
on the hex head of the column end fitting.
Note: If one of the wrenches is placed on the column tube flat during
this process, the end fitting will be loosened and leak.
3. If a leak occurs between the stainless steel compression
screw fitting and the column end fitting, a new
compression screw fitting, tubing and ferrule must
be assembled.
4. An arrow on the column identification label indicates
correct direction of solvent flow.
Correct connection of 1/16 inch outer diameter stainless
steel tubing leading to and from the column is essential for
high-quality chromatographic results. To obtain a void-free
connection, the tubing must touch the bottom of the column
end fitting. It is important to realize that extra column peak
broadening due to voids can destroy an otherwise successful
separation. The choice of appropriate column connectors and
system tubing is discussed in detail below.
Figure 1. Waters and Parker Ferrule Types.
.130”
.090”
Waters Ferrule Setting Parker Ferrule Setting

7XBridge Peptide BEH C18, 130Å and 300Å Columns
[ CARE AND USE MANUAL ]
Due to the absence of an industry standard, various
column manufacturers have employed different types of
chromatographic column connectors. The chromatographic
separation can be negatively affected if the style of the column
end fitting does not match the existing tubing ferrule settings.
This section explains the differences between Waters style and
Parker style ferrules and end fittings (Figure 1). Each end fitting
style varies in the required length of the tubing protruding
from the ferrule. The XBridge Column is equipped with Waters
style end fittings that require a 0.130 inch ferrule depth. If a
non-Waters style column is presently being used, it is critical
that ferrule depth be reset for optimal performance prior to
installing an XBridge Column.
In a proper tubing/column connection (Figure 2), the tubing
touches the bottom of the column end fitting, with no void
between them.
Figure 2. Proper tubing/column connection.
Figure 5. Single and double SLIPFREE Connectors.
Gap
Figure 4. Waters Ferrule in a Parker Style End Fitting.
Void
Figure 3. Parker Ferrule in a Waters Style End Fitting.
The presence of a void in the flow stream reduces column
performance. This can occur if a Parker ferrule is connected
to a Waters style end fitting (Figure 3).
Note: A void appears if tubing with a Parker ferrule is connected to a Waters
style column.
There is only one way to fix this problem: Cut the end of the
tubing with the ferrule, place a new ferrule on the tubing, and
make a new connection. Before tightening the screw, make sure
that the tubing bottoms out in the end fitting of the column.
Conversely, if tubing with a Waters ferrule is connected to
a column with Parker style end fitting, the end of the tubing
will bottom out before the ferrule reaches its proper sealing
position. This will leave a gap and create a leak (Figure 4).
Note: The connection leaks if a Waters ferrule is connected to a column with
a Parker style end fitting.
There are two ways to fix the problem:
1. Tighten the screw a bit more. The ferrule moves forward,
and reaches the sealing surface. Do not overtighten since
this may end in breaking the screw.
2. Cut the tubing, replace the ferrule, and make a new
connection.
Alternatively, replace the conventional compression screw
fitting with an all-in-one PEEK™ fitting (p/n: PSL613315) that
allows resetting of the ferrule depth. Another approach is to
use a SLIPFREE® connector to always ensure the correct fit.
The finger-tight SLIPFREE connectors automatically adjust
to fit all compression screw type fittings without the use of
tools (Figure 5).

8XBridge Peptide BEH C18, 130Å and 300Å Columns
[ CARE AND USE MANUAL ]
b. Measuring System Band Spreading
Volume and System Variance
This test should be performed on an HPLC System with a single
wavelength UV detector (not a Photodiode Array [PDA]).
1. Disconnect column from system and replace
with a zero dead volume union.
2. Set flow rate to 1 mL/min.
3. Dilute a test mix in mobile phase to give a detector
sensitivity of 0.5–1.0 AUFS (system start up test mix
can be used which contains uracil, ethyl, and propyl
parabens; p/n: WAT034544).
4. Inject 2 to 5 L of this solution.
5. Measure the peak width at 4.4% of peak height
(5-sigma method):
5-sigma band spreading (L) =
Peak Width (min) x Flow Rate (mL/min) x (1000 L/1 mL)
System Variance (L2) = (5-sigma band spreading)2/25
SLIPFREE connector features:
Tubing pushed into end fitting, thereby guaranteeing a
void-free connection
Connector(s) come(s) installed on tubing
Various tubing I.D.’s and lengths available
Finger tight to 10,000 psi – never needs wrenches
Readjusts to all column end fittings
Compatible with all commercially available end fittings
Unique design separates tube-holding function from
sealing function
Table 5. Waters Part Numbers for
SLIPFREE Connectors
SLIPFREE Type Tubing Internal Diameter
Tubing Length 0.005” 0.010” 0.020”
Single 6 cm PSL 618000 PSL 618006 PSL 618012
Single 10 cm PSL 618002 PSL 618008 PSL 618014
Single 20 cm PSL 618004 PSL 618010 PSL 618016
Double 6 cm PSL 618001 PSL 618007 PSL 618013
Double 10 cm PSL 618003 PSL 618009 PSL 618015
Double 20 cm PSL 618005 PSL 618001 PSL 618017
Bandspreading Minimization
Figure 6 shows the influence of tubing internal diameter on
system band spreading and peak shape. As can be seen,
the larger tubing diameter causes excessive peak broadening
and lower sensitivity.
System Volume
4.4 %h
5
Figure 7. Determination of system band spreading volume
using 5-Sigma Method.
Diluted/Distorted Sample Band
0.005 inches
0.020 inches
0.040 inches
Figure 6. Effect of connecting tubing on system.
In a typical HPLC system, the band spreading volume
should be no greater than 100 L ± 30 L (or Variance of
400 L2± 36 L2). In a microbore (2.1 mm I.D.) system, the
band spreading volume should be no greater than 20 to
40 L (or variance no greater than 16 L2to 64 L).
c. Measuring Gradient Delay Volume
(or Dwell Volume)
For successful, gradient, method transfers, the gradient delay
volumes should be measured using the same method on both
HPLC systems. The procedure below describes a method for
determining the gradient delay volumes.
9XBridge Peptide BEH C18, 130Å and 300Å Columns
[ CARE AND USE MANUAL ]
1. Replace the column with a zero dead volume union.
2. Prepare mobile phase A (pure solvent, such as methanol)
and mobile phase B (mobile phase A with a UV absorbing
sample, such as [v/v] 0.1% acetone in methanol).
3. Equilibrate the system with mobile phase A until a stable
baseline is achieved.
4. Set the detector wavelength to the absorbance maximum
of the probe (265 nm for acetone).
5. Program a 0–100% B linear gradient in 10 minutes at
2 mL/min (the exact conditions are not critical; just
make sure the gradient volume is at least 20 mL) with
a hold at 100% B.
6. Determine the dwell time by first locating the time at the
midpoint of the formed gradient (t1/2) (half the vertical
distance between the initial and final isocratic segments
as shown in Figure 8).
Time
1/2 Vertical
Distance
1.0
0.8
0.6
0.4
Au
0.2
0.0
t1/2
Figure 8. Determination of gradient delay volume.
7. Subtract half the gradient time (1/2 tg) (10 min/2 =
5 minutes in this example) from the gradient midpoint (t1/2)
to obtain the dwell time (tD).
8. Convert the dwell time (tD) to the dwell volume (VD) by
multiplying by the flow rate (F).
Dwell Volume VD = (t1/2–1/2 tg) x F
For fast gradient methods, the gradient delay volume (or
dwell volume) should be less than 1 mL. If the gradient delay
volume is greater than 1 mL, see the “System Modification
Recommendations” section on how to reduce system volume.
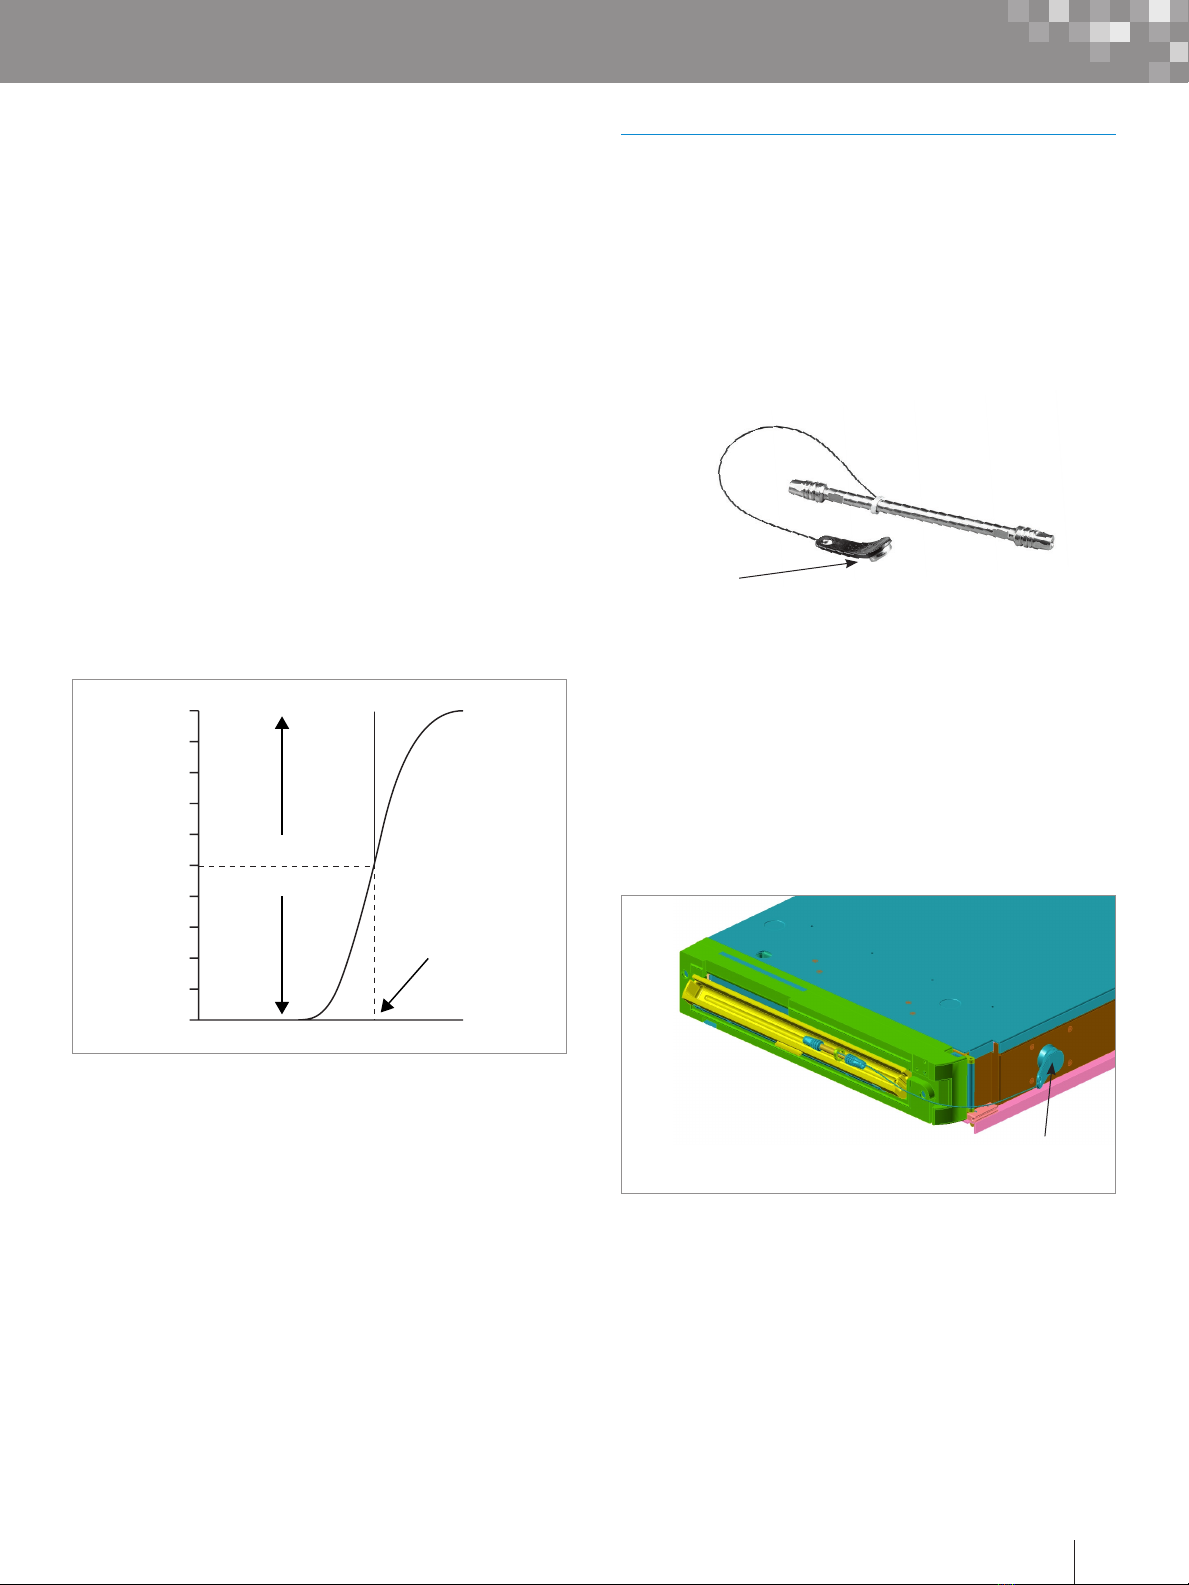
VII. eCORD INTELLIGENT CHIP TECHNOLOGY
(Applies only to XBridge XP 2.5 µm, ≤ 4.6 mm I.D. Columns )
a. Introduction
The eCord Intelligent Chip is a new technology that will provide
the history of a column’s performance throughout its lifetime.
The eCord is permanently attached to the column to assure
that the column’s performance history is maintained in the
event that the column is moved from one instrument to another.
Waters eCord Intelligent Chip.
At the time of manufacture, tracking and quality control
information will be downloaded to the eCord. Storing this
information on the chip will eliminate the need for a paper
Certificate of Analysis. Once the user installs the column, the
software will automatically download key parameters into a
column history file stored on the chip. The eCord provides a
solution to easily track the history of column usage.
eCord inserted into side of column heater.
b. Installation
Install the column into the column heater. Plug the eCord into
the side of the column heater. Once the eCord is inserted into
the column heater the identification and overall column usage
information will be available in Empower® and MassLynx®
Software allowing the user to access column information on
their desktop.

10XBridge Peptide BEH C18, 130Å and 300Å Columns
[ CARE AND USE MANUAL ]
c. Manufacturing Information
The eCord Chip provides the user with an overview of the bulk
material QC test results.
The eCord Chip provides the user with QC test conditions and
results on the column run by the manufacturer. The information
includes mobile phases, running conditions, and analytes used
to test the columns. In addition, the QC results and acceptance
is placed onto the column.
d. Customer Use Information
of first injection, date of last injection, maximum pressure, and
temperature. The information also details the column history
by sample set including date started, sample set name, user
name, system name, number of injections in the sample set,
number of samples in the sample set, maximum pressure,
and temperature in the sample set; and if the column met
basic system suitability requirements.
VIII. ADDITIONAL INFORMATION
a. Use of Narrow-Bore Columns
This section describes how to minimize extra column effects
and provides guidelines on maximizing the performance
of a narrow-bore column in an HPLC System. A 2.1 mm I.D.
column requires modifications to the HPLC System in order
to eliminate excessive system band spreading volume.
Without proper system modifications, excessive system
bandspreading volume causes peak broadening and has a
large impact on peak width as peak volume decreases.
b. Impact of Band Spreading Volume on
2.1 mm I.D. Column Performance
System with 70 L band spreading: 10,000 plates
System with 130 L band spreading: 8000 plates
(same column)
Note: Flow splitters after the column will introduce additional
band spreading.
System optimization, especially in a system that contains
a flow splitter, can have dramatic effects on sensitivity
and resolution. Optimization includes using correct ferrule
depths and minimizing tubing inner diameters and lengths.
An example is given in Figure 9 where system optimization
resulted in a doubling of sensitivity and resolution of the
metabolite in an LC-MS/MS System.
The eCord Chip will automatically capture column use
data. The top of the screen identifies the column including
chemistry type, column dimensions, and serial number. The
overall column usage information includes the total number
of samples, total number of injections, total sample sets, date Figure 9. Non-optimized vs. optimized LC-MS/MS system.
7.00 7.50
Non-optimized LC-MS/MS System Optimized System
8.00
7.00 7.50 8.00

[ CARE AND USE MANUAL ]
Waters Corporation
34 Maple Street
Milford, MA 01757 U.S.A.
T: 1 508 478 2000
F: 1 508 872 1990
www.waters.com
[ CARE AND USE MANUAL ]
Waters, The Science of What’s Possible, Oasis, Sep-Pak, XBridge, Empower, and MassLynx are registered
trademarks of Waters Corporation. All other trademarks are the property of their respective owners.
© 2017 Waters Corporation. November 2017 Rev. E 715001443 IH-PDF
c. Non-Optimized vs. Optimized LC-MS/MS System:
System Modification Recommendations
1. Use a microbore detector flow cell with 2.1 mm I.D. columns.
Note: Detector sensitivity is reduced with the shorter flow cell path
length in order to achieve lower band spreading volume.
2. Minimize injector sample loop volume.
3. Use 0.009 inch (0.25 mm) tubing for rest of connections
in standard systems and 0.005 inch (0.12 mm) tubing for
narrowbore (2.1 mm I.D.) systems.
4. Use perfect (pre-cut) connections (with a variable depth
inlet if using columns from different suppliers).
5. Detector time constants should be shortened to less
than 0.2 seconds.
IX. REPRESENTATIVE TEST CHROMATOGRAPH
AND CONDITIONS FOR SEPARATION OF
PROTEIN DIGEST
T1
T8
T15
T5
T19
T12-T13
T12
T4 T9-T10
T10
T14
T13-T14
T19C
6 9 12 15 18 21 24 min.
Chromatographic Conditions:
Column: 2.1 x 100 mm
Sample: Tryptic digest of cytochrome c
Flow rate: 0.20 mL/min
Mobile phase A: 0.045% TFA in water
Mobile phase B: 0.045% TFA in acetonitrile
Gradient: from 0–15% B in 6 min,
from 15–36% B in 20 min
Temp.: 35 °C
UV detection: 214 nm
X. CAUTIONARY NOTE
Depending on user’s application, these products may be
classified as hazardous following their use and as such are
intended to be used by professional laboratory personnel
trained in the competent handling of such materials.
Responsibility for the safe use and disposal of products rests
entirely with the purchaser and user. The Safety Data Sheet
(SDS) for this product is available at www.waters.com/sds.
Peak Identification
T1 N–AcGDVEK T8 TGPNLHGLFGR
T13–T14 KYIPGTK T15 MIFAGIK
T14 YIPGTK T5 CAQCHTVEK (heme attached)
T4 IFVQK T19 EDLIAYLK
T9–T10 KTGQAPGFSYTDANK T12–T13 GITWGEETLMEYLENPKK
T10 TGQAPGFSYTDANK T12 GITWGEETLMEYLENPK
T19C EDLIAY
Table of contents
Popular Medical Equipment manuals by other brands


Medirol
Medirol Sanero M201 user manual

Konica Minolta
Konica Minolta AeroDR Portable UF Unit Operation manual

Datex-Ohmeda
Datex-Ohmeda Cardiocap/5 Series user guide

Braun
Braun Aesculap Acculan 4 Instructions for use/Technical description

Jorvet
Jorvet Vet Pro Pump Maintenance & troubleshooting

Direct Supply
Direct Supply Panacea PAN-PL5500DF owner's manual


