Dionex MSQ User manual

Document No. 031871
Revision 02
October 2003
Hardware
MSQ™

©2003 by Dionex Corporation
All rights reserved worldwide.
Printed in the United States of America.
This publication is protected by federal copyright law. No part of this publication may be copied or
distributed, transmitted, transcribed, stored in a retrieval system, or transmitted into any human or computer
language, in any form or by any means, electronic, mechanical, magnetic, manual, or otherwise, or disclosed
to third parties without the express written permission of Dionex Corporation, 1228 Titan Way, Sunnyvale,
California 94088-3603 U.S.A.
DISCLAIMER OF WARRANTY AND LIMITED WARRANTY
THIS PUBLICATION IS PROVIDED “AS IS” WITHOUT WARRANTY OF ANY KIND. DIONEX
CORPORATION DOES NOT WARRANT, GUARANTEE, OR MAKE ANY EXPRESS OR
IMPLIED REPRESENTATIONS REGARDING THE USE, OR THE RESULTS OF THE USE, OF
THIS PUBLICATION IN TERMS OF CORRECTNESS, ACCURACY, RELIABILITY,
CURRENTNESS, OR OTHERWISE. FURTHER, DIONEX CORPORATION RESERVES THE
RIGHT TO REVISE THIS PUBLICATION AND TO MAKE CHANGES FROM TIME TO TIME IN
THE CONTENT HEREINOF WITHOUT OBLIGATION OF DIONEX CORPORATION TO
NOTIFY ANY PERSON OR ORGANIZATION OF SUCH REVISION OR CHANGES.
TRADEMARKS
Chromeleon is a registered trademark of Dionex Corporation.
Cone Wash, M-Path, MSQ, and Xcalibur are trademarks of Thermo Electron Corporation.
Microsoft is a registered trademark of Microsoft Corporation.
Q-tip is a trademark of Chesebrough-Pond’s, Inc.
Teflon, Vespel, and Viton are registered trademarks of E.I. du Pont de Nemours and Company.
PRINTING HISTORY
Revision 01, July 2002
Revision 02, October 2003
The products of Dionex Corporation are produced under ISO 9001 accredited quality management systems.
Published by Technical Publications, Dionex Corporation, Sunnyvale, CA 94086.

Chapter 1
Introducing the MSQ1.
Introducing the MSQ.................................................................................................................1-i
Introduction ....................................................................................................................................1-1
System Overview............................................................................................................................1-2
What Is Mass Detection?...................................................................................................1-4
Exterior Features of the MSQ............................................................................................1-5
The Source–An Introduction to API Techniques ...........................................................................1-8
Electrospray.......................................................................................................................1-9
Atmospheric Pressure Chemical Ionization.....................................................................1-13
Source Fragmentation......................................................................................................1-16
Cone Voltage Ramping ...................................................................................................1-18
Polarity Switching ...........................................................................................................1-19
Application of API Techniques .......................................................................................1-20
The Self-Cleaning Source: Cone Wash ........................................................................................1-23
Introduction .....................................................................................................................1-23
Functional Description ....................................................................................................1-24
The Reference Inlet System..........................................................................................................1-25
Introduction .....................................................................................................................1-25
Functional Description ....................................................................................................1-25
The Mass Analyzer and Detector .................................................................................................1-26
The Vacuum System.....................................................................................................................1-27
The Data System...........................................................................................................................1-28
Software...........................................................................................................................1-28
Raw Data .........................................................................................................................1-30
Raw Data Types...............................................................................................................1-31
____________________________MSQ Hardware Manual _____________________________ 1-i

Introducing the MSQ
Introduction ____________________________________________________________________________
1-ii____________________________ MSQ Hardware Manual ____________________________

Introducing the MSQ
___________________________________________________________________________ Introduction
Introduction
The MSQ™ MS detector has been specifically designed and engineered for
liquid chromatographic detection using Atmospheric Pressure Ionization
(API) and Mass Spectrometry (MS) technology. These technologies can
provide sensitive and selective detection of organic molecules.
Interfacing High Performance Liquid Chromatography (HPLC or LC) and
MS provides the separation scientist with one of the most powerful
analytical tools available. Both LC and MS have developed to a point
whereby they represent two of the most important techniques in
characterizing and detecting organic compounds. Although the potential
benefits of interfacing LC to MS have been clearly recognized for many
years, producing a truly automated “connect-and-use” interface has proven
to be a challenging task.
Atmospheric Pressure Ionization (API) techniques now provide highly
sensitive detection using conventional to capillary LC flow rates on bench-
top MS detector systems. LC/MS works with typical solvent compositions,
whether the separation is achieved by isocratic or gradient elution.
Historically, LC/MS has been compatible only with volatile buffer systems
using modifiers such as trifluoroacetic acid, formic acid, and acetic acid.
Phosphate buffers, although extensively used in LC separations, were not
suited to LC/MS due to rapid blocking of the ion sampling region caused by
the deposition of involatile phosphate salts. The self-cleaning API source
allows for extended periods of operation in LC/MS with chromatographic
buffers such as phosphates or ion-pairing agents and samples in dirty
matrices.
API using Electrospray (ESI) or Atmospheric Pressure Chemical Ionization
(APCI) interfaces has proved to be invaluable in meeting sensitivity
requirements in quantitative methods. It can also provide structural
information, which is complementary to techniques such as NMR and infra
red spectroscopy.
This introduction focuses on the principal components of the system.
___________________________MSQ Hardware Manual ____________________________ 1-1

Introducing the MSQ
System Overview ________________________________________________________________________
System Overview
The MSQ MS detector is an integral part of the LC detection system. Key
points of the system are:
The sample is introduced into the ion source using an LC system,
possibly through a column.
•
•
•
•
•
In an API MS detector, the part of the source where ionization takes
place is held at atmospheric pressure, giving rise to the term
Atmospheric Pressure Ionization (API).
In ESI, the sample is ionized in the liquid phase, while in APCI,
ionization occurs in the gas phase. In both cases, efficient desolvation is
needed to remove the solvents from the sample.
Ions, now in the gas phase, are passed through the mass analyzer and are
collected at the detector.
The detected signal is sent to the data system and stored ready for
processing.
LC Column
Separation
LC System
Sample
introduction
Ion Source
Ionization &
transmission
Mass Analyzer
Sorting of ions
Detector
Detection
of ions
Data System
Windows NT
Molecular weight information
Structural information
Positive identification
Quantitative information
Turbomolecular
& rotary pumps
Figure 1-1. The key components of the MSQ API LC detection system
1-2 ___________________________ MSQ Hardware Manual ____________________________

Introducing the MSQ
_______________________________________________________________________System Overview
The main features of the MSQ MS detector are:
Dual ESI/APCI orthogonal probe•
•
•
Self-cleaning API-LC/MS interface
M-Path™ triple orthogonal source
Quadrupole
mass analyzer
Square
quadrupole
RF lens
Rotary
pump
Split flow
turbomolecular
pump
Entrance cone
From HPLC
Orthogonal sample
introduction probe
Cone wash
Exit cone
Figure 1-2. Schematic diagram of the MSQ API inlet, analyzer, and
detector system
The LC eluent is ionized at the API probe and the resulting ions are focused
into a square quadrupole RF lens. The quadrupole mass analyzer filters the
ions before detection.
___________________________MSQ Hardware Manual ____________________________ 1-3

Introducing the MSQ
System Overview ________________________________________________________________________
What Is Mass Detection?
Mass detection is a very powerful analytical technique used in a number of
fields, including:
Identification of unknown compounds•
•
•
Quantitation of known compounds
Determination of chemical structure
The basic function of an MS detector is to measure the mass-to-charge ratio
of ions.
The unit of mass used is the Dalton (Da). One Dalton is equal to 1/12 of the
mass of a single atom of carbon-12. This follows the accepted convention
that an atom of carbon-12 has exactly 12 atomic mass units (amu). The MS
detector does not directly measure molecular mass, but the mass-to-charge
ratio of the ions. Electrical charge is a quantized property and so can exist
only as an integer; that is, 1, 2, 3, and so on. The unit of charge used here (z)
is that which is on an electron (negative) or a proton (positive). Therefore,
the mass-to-charge ratio measured can be denoted by m/z. Most ions
encountered in mass detection have just one charge. In this case, the mass-
to-charge ratio is often spoken of as the “mass” of the ion.
1-4 ___________________________ MSQ Hardware Manual ____________________________

Introducing the MSQ
_______________________________________________________________________System Overview
Exterior Features of the MSQ
This section highlights the exterior features of the MSQ. The parts labeled
here may be referred to in later chapters of this manual or other manuals
supplied with the MSQ.
Status light
Figure 1-3. Front view of the MSQ
Figure 1-3 shows the front view of the MSQ. The main feature is the status
light.
___________________________MSQ Hardware Manual ____________________________ 1-5

Introducing the MSQ
System Overview ________________________________________________________________________
Table 1-1. Instrument status light
Instrument Status Light
Vented Red
Venting Red
Pumping down Flashing yellow
Under vacuum (above
vacuum trip)
Red
Under vacuum (ready
for use)
Yellow
Operate on (MSQ in
use)
Green
Source enclosure open Red
The vacuum trip is the pressure below which it is safe to switch on the
voltages in the source. When the instrument is functioning normally, the
status light will go from flashing yellow to solid yellow and Operate can be
switched On. If the pressure in the instrument rises above the operating
pressure, the status light turns red to indicate that the pressure is above a
safe level. See the chapter Shutting Down and Restarting the System for
information on pumping down the MSQ.
Figure 1-4 shows the MSQ with the doors open. The source enclosure and
reference inlet are now visible.
Source
enclosure
Reference
inlet
Figure 1-4. The MSQ with the doors open
1-6 ___________________________ MSQ Hardware Manual ____________________________
Introducing the MSQ
_______________________________________________________________________System Overview
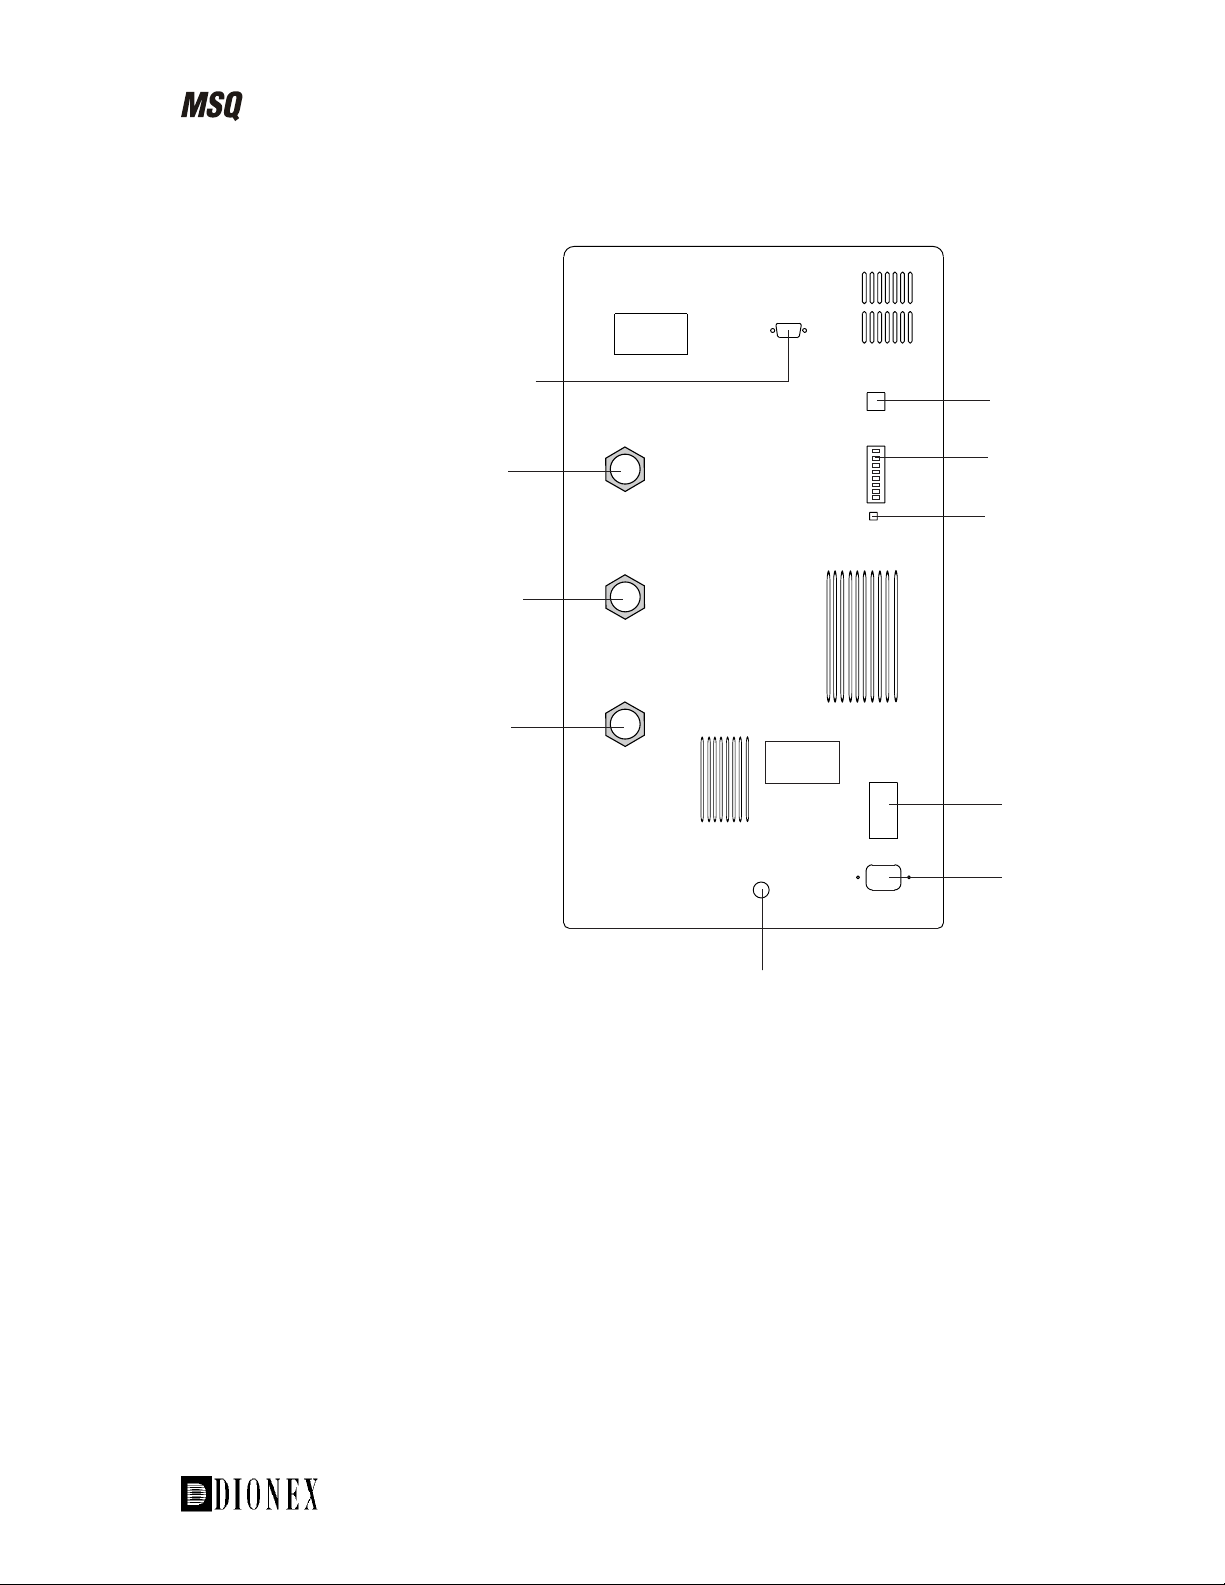
Figure 1-5 is a schematic of the rear view of the MSQ.
MODEL:
RATING: 220-240v
50/60 Hz
1000 VA
SOURCE
EXHAUST
BACKING
PUMP RELAY
USB
USER I/O
RESET
MAINS ON/OFF
MAINS IN
GAS IN
6 BAR MAX
To rotary pump
To rotary pump
Exhaust from API
source
Rotary pump power
To PC
Contact closure and
analog inputs
Power switch
Power supply
Gas inlet for nebulizer
and sheath gas
Reset communications
Figure 1-5. Rear view of the MSQ
___________________________MSQ Hardware Manual ____________________________ 1-7

Introducing the MSQ
The Source–An Introduction to API Techniques ________________________________________________
The Source–An Introduction to API
Techniques
The source, or interface, performs four main functions:
Separates the analytes from the solvent and buffer systems used in LC•
•
•
Ionizes the analyte molecules
Allows efficient transfer of ions into the mass analyzer for detection
LC eluent enters the source through the orthogonal sample introduction
probe. The primary objective of an orthogonal probe is to direct any
involatile components present in the LC eluent, such as those from buffers,
ion-pairing agents, or matrices, away from the entrance orifice. Under
operating conditions, however, both the sample ions and the charged liquid
droplets (containing any involatile components, if they are present) are
deflected by the electric field towards the entrance orifice. This leads to a
gradual buildup of involatiles and a concomitant loss in sensitivity with
time. The self-cleaning source delivers a constant, low flow of solvent (the
cone wash™) to the edge of the inlet orifice, helping to prevent a buildup of
involatiles during an LC/MS run.
1-8 ___________________________ MSQ Hardware Manual ____________________________

Introducing the MSQ
_______________________________________________ The Source–An Introduction to API Techniques
Rotary
pump
Entrance cone
From HPLC
Orthogonal sample
introduction probe
Cone wash
Exit cone
To the mass
analyzer
Figure 1-7. Schematic of the MSQ source showing the cone wash
Two types of API are commonly encountered. These are Electrospray
Ionization (ESI) and Atmospheric Pressure Chemical Ionization (APCI).
The following sections discuss the mechanism of ion generation in each.
Electrospray
Electrospray Ionization (ESI) is regarded as a soft ionization technique
providing a sensitive means of analyzing a wide range of polar molecules.
Since the first combined ESI LC/MS results were announced in 1984, and
its first application to protein analysis four years later, the technique has
become an established analytical tool in separation science.
When applied to smaller molecules up to 1000 Daltons in molecular mass,
electrospray ionization results in either a protonated, [M+H]+(see Figure
1-8) or deprotonated, [M-H]-, molecule. Choice of ionization mode is
governed by the functional chemistry of the molecule under investigation. In
ESI, fragmentation is generally not apparent; however, increased source
voltages can induce fragmentation to provide structural information.
___________________________MSQ Hardware Manual ____________________________ 1-9

Introducing the MSQ
The Source–An Introduction to API Techniques ________________________________________________
60 80 100 120 140 160 180 200 220 240 260 280 300
m/
z
0
100
%
240
241
HO
HO
OH
NH tBu
Chemical structure of salbutamol,
(molecular weight 239)
Figure 1-8. Electrospray mass spectrum of salbutamol in positive ion
mode
The base peak at m/z 240 (see Figure 1-8) corresponds to the protonated
salbutamol molecule. It is notable that ESI results in a prominent base peak
with minimal fragmentation, quite dissimilar from the results often achieved
with GC/MS.
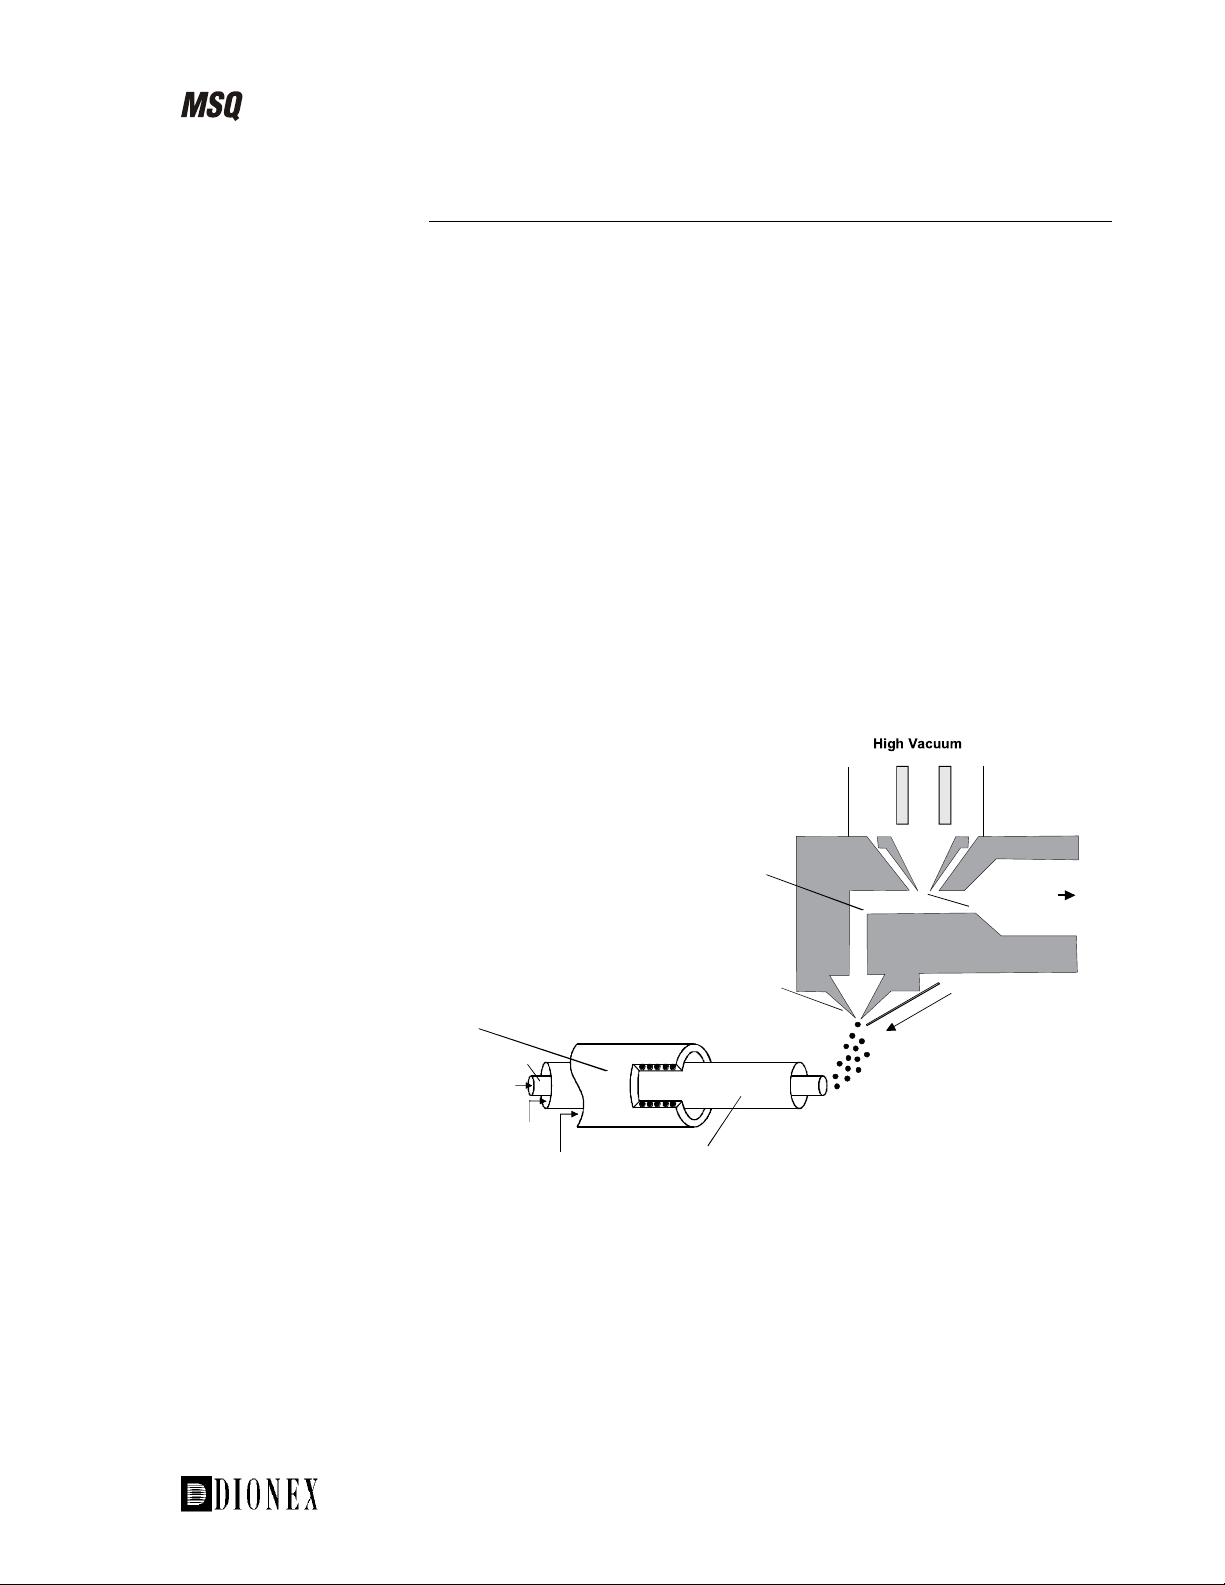
Mechanism of Ion Generation
Electrospray ionization operates by the process of emission of ions from a
droplet into the gas phase, a process termed Ion Evaporation. A solvent is
pumped through a stainless steel insert capillary that carries a high potential,
typically 3 to 5 kV (see Figure 1-9). The strong electric field generated by
this potential causes the solvent to be sprayed from the end of the insert
capillary (hence, electrospray), producing highly charged droplets. As the
solvent is removed by the desolvation process, the charge density on the
surface of the droplets increases until the Rayleigh limit is exceeded; after
this, a multitude of smaller droplets are formed by coulombic explosion.
This process is repeated until charged sample ions remain. These ions are
then available for sampling by the ion source.
+
+
+
+
+
++
+
+
++
+
+
+
+
+
+
+
++
-
-
-
--
--
---
+
+
+
+
+
++
-
Insert capillary +3-5 kV Droplet
containing
ions
As the droplet
evaporates, the
electric field
increases and ions
move towards
the surface
Ions evaporate
from the surface
+
+
+
+
+
+
+++
+
+
++
Figure 1-9. Positive ion electrospray mechanism
1-10 __________________________ MSQ Hardware Manual ____________________________
Introducing the MSQ
_______________________________________________ The Source–An Introduction to API Techniques
Electrospray Ionization Using the MSQ Source
The sample, in solution, enters the source via a stainless steel insert capillary
held at a voltage of 3 to 5 kV. The insert capillary is surrounded by a tube
that directs a concentric flow of nitrogen nebulizing gas past the droplets of
liquid forming at the probe tip. The action of the nebulizing gas, high
voltage, and heated probe produces an aerosol of liquid droplets containing
ions of the sample and solvent. The ion evaporation process is assisted by a
second concentric flow of heated nitrogen gas. This is the sheath gas. This
highly efficient evaporation process close to the entrance cone enables the
routine use of high LC flow rates (up to 2.0 mL/min) in ESI mode.
The newly formed ions then enter the focusing region through the entrance
cone. This is due to the following:
The high electric field. The insert capillary is at 3 to 5 kV with respect
to the rest of the source, which is typically at 20 to 30 V.
•
• The gas flow into the focusing region.
Ions then exit the focusing region and pass into the RF lens. The RF lens
(square quadrupole) helps to focus the ions before they enter the mass
analyzer region.
Atmospheric
Pressure
Region
Insert capillary
Region
LC eluent
Nebulizing gas, N
2
Sheath gas, N
2
Probe
Insert
Intermediate
Pressure
Region
Rotary
pump
Entrance cone
Exit cone
Cone Wash
Figure 1-10. Schematic of the ESI source on the MSQ, showing the
principal components and pressure regions
___________________________MSQ Hardware Manual ___________________________ 1-11

Introducing the MSQ
The Source–An Introduction to API Techniques ________________________________________________
Spectral Characteristics
Polar compounds of low molecular weight (<1000 amu) typically form
singly charged ions by the loss or gain of a proton. Basic compounds (for
example, amines) can form a protonated molecule [M+H]+, which can be
analyzed in positive ion mode to give a peak at m/z M+1. Acidic
compounds (for example, sulphonic acids) can form a deprotonated
molecule [M-H]-, which can be analyzed in negative ion mode to give a
peak at m/z M-1. As electrospray is a very soft ionization technique, there is
usually little or no fragmentation and the spectrum contains only the
protonated or deprotonated molecule.
Some compounds are susceptible to adduct formation if ionization takes
place in the presence of contamination or additives such as ammonium or
sodium ions. The spectra will show other ions in addition to, or instead of,
the quasi-molecular ion. Common adducts are ammonium ions NH4
+
[M+18]+, sodium ions Na+[M+23]+, and potassium ions K+[M+39]+.
60 80 100 120 140 160 180 200 220 240 260 280 300 320 340 360 m/z
0
100
%
322
241
100
80 99
103
145
141 187
181
244
282
261 279
344 363
[M+H]+
[M+Na]+
Figure 1-11. Electrospray spectrum showing a sodium adduct
The singly charged ions arising from samples of relatively low molecular
masses can be interpreted directly, as they represent the protonated or
deprotonated molecule. Electrospray, however, can produce multiply
charged ions for analytes that contain multiple basic or acidic sites, such as
proteins and peptides. As an MS detector measures mass-to-charge ratio
(m/z), these ions appear at a m/z value given by the mass of their protonated
molecule divided by the number of charges:
zm
n
nHM n
=
++
Where, M = actual mass, n = number of charges, and H = mass of a proton.
Electrospray allows molecules with molecular weights greater than the mass
range of the MS detector to be analyzed. This is a unique feature of
electrospray.
1-12 __________________________ MSQ Hardware Manual ____________________________

Introducing the MSQ
_______________________________________________ The Source–An Introduction to API Techniques
Flow Rate
The electrospray source can be used with flow rates from 5.0 µL/min to
2.0 mL/min.
Atmospheric Pressure Chemical Ionization
Atmospheric Pressure Chemical Ionization (APCI) is also a very soft
ionization technique and has many similarities to electrospray ionization.
Ionization takes place at atmospheric pressure and the ions are extracted into
the MS detector in the same way as in electrospray.
Similarly, as observed in ESI, [M+H]+and [M-H]-ions are usually formed
providing molecular weight information. Fragmentation can be induced in
the source by increasing the source voltage to give structural information.
Mechanism of Ion Generation
In APCI, the liquid elutes from an insert capillary, surrounded by a coaxial
flow of nitrogen nebulizing gas into a heated region. The combination of
nebulizing gas and heat form an aerosol that evaporates quickly to yield
desolvated neutral molecules (see Figure 1-12).
At the end of the probe is a corona pin held at a high potential (typically 2.0
to 3.5 kV). This produces a high-field corona discharge that causes solvent
molecules eluting into the source to be ionized. In the atmospheric pressure
region surrounding the corona pin, a series of reactions occur that give rise
to charged reagent ions. Any sample molecules, which elute and pass
through this region of reagent ions, can be ionized by the transfer of a proton
to form [M+H]+or [M-H]-. This is a form of chemical ionization; hence the
name of the technique, Atmospheric Pressure Chemical Ionization.
+
Heated nebuliser
Liquid
N2
N2
An aerosol
is formed
Solvent and
sample molecules
are desolvated
Solvent molecules
are ionized
Collisions and
proton transfer
Sample
[M+H]+
ions formed
Solvent molecules
Sample molecules
Corona pin
+
+
+
+
+
+
+
+
Figure 1-12. Positive ion APCI mechanism
___________________________MSQ Hardware Manual ___________________________ 1-13

Introducing the MSQ
The Source–An Introduction to API Techniques ________________________________________________
APCI Using the MSQ Source
The sample is carried to a spray region via a stainless steel insert capillary.
The action of both the nebulizing gas and the heated probe leads to the
formation of an aerosol. The desolvation process is assisted by a second
concentric flow of nitrogen gas, the sheath gas.
In contrast to electrospray, APCI is a gas phase ionization technique.
Ionization occurs as the aerosol leaves the heated nebulizer region. A corona
pin, mounted between the heated region and the entrance cone, ionizes the
sample molecules with a discharge voltage of approximately 3.0 to 3.5 kV
in positive ion mode and 2.0 to 3.0 kV in negative ion mode.
Atmospheric
Pressure
Region
Region
Intermediate
Pressure
Region Rotary
pump
Entrance cone
Exit cone
Cone Wash
Nebulizing gas, N
2
Sheath gas, N
2
LC eluent
Probe
Corona pin
Figure 1-13. Schematic of the APCI source on the MSQ, showing the
principal components and pressure regions
The newly formed ions then enter the focusing region through the entrance
orifice and pass into the RF lens region. The RF lens (square quadrupole)
helps to focus the ions before they enter the mass analyzer region.
1-14 __________________________ MSQ Hardware Manual ____________________________

Introducing the MSQ
_______________________________________________ The Source–An Introduction to API Techniques
Spectral Characteristics
Like electrospray, APCI is a soft ionization technique and forms singly
charged ions–either the protonated, [M+H]+, or deprotonated, [M-H]-,
molecule–depending on the selected ionization mode. Unlike electrospray,
however, APCI does not produce multiply charged ions and so is unsuitable
for the analysis of high molecular weight compounds such as proteins or
peptides.
Although a high temperature is applied to the probe, most of the heat is used
in evaporating the solvent, so the thermal effect on the sample is minimal. In
certain circumstances (for example, with very thermally labile (unstable)
compounds), the heated probe may cause some thermal fragmentation.
Flow Rate
Flow rates of 0.2 to 2.0 mL/min can be used with APCI.
___________________________MSQ Hardware Manual ___________________________ 1-15

Introducing the MSQ
The Source–An Introduction to API Techniques ________________________________________________
Source Fragmentation
Both electrospray and APCI are regarded as soft ionization techniques.
Ionization generally results in spectra dominated by either the protonated
molecule [M+H]+(positive ion mode) or deprotonated molecule [M-H]-
(negative ion mode), depending on whether positive or negative ionization
mode has been selected. Choice of ionization mode is governed by the
functional chemistry of the molecule under investigation.
Source fragmentation can be induced to give additional information on a
compound, such as diagnostic fragment ions for structural determination or
an increased response on a particular confirmatory ion for peak targeting.
Formation of Diagnostic Fragment Ions
The MSQ allows the simultaneous acquisition of MS data at a number of
different source voltages. For example, the MSQ can be programmed to
acquire data at source voltages of 20, 40, and 60 V on an alternating scan
basis within a single acquisition. The benefits of setting up acquisitions in
this way are:
The optimum source voltage for a particular ion can be determined in
one acquisition for compounds where sample volume is at a premium.
•
• The intensity of fragment ions can be maximized to gain structural
information.
Fragmentation at increased source voltages is useful for most compounds.
For example, using source fragmentation of salbutamol in electrospray
ionization, a number of confirmatory fragment ions can be generated and
their intensity maximized (see Figure 1-14).
The mechanism for the formation of the fragment ions is characteristic for
not only salbutamol, but also for related β-agonists such as clenbuterol,
terbutaline, and metaproterenol. It involves loss of water (-18 amu; resulting
in the fragment ion at m/z 222 (middle trace)) and an additional loss of the
tert-butyl group (-56 amu; resulting in the fragment at m/z 166 (lower
trace)).
Note. The MSQ uses the term “cone voltage” to represent source voltage.
1-16 __________________________ MSQ Hardware Manual ____________________________
Table of contents
Other Dionex Laboratory Equipment manuals

Dionex
Dionex P680 User manual

Dionex
Dionex ProPac WCX-10 Assembly instructions

Dionex
Dionex ICS-90 User manual

Dionex
Dionex UltiMate 3000 User guide

Dionex
Dionex ICS-1000 User manual

Dionex
Dionex TCC-100 User manual

Dionex
Dionex UltiMate 3000 Series User manual

Dionex
Dionex ICS-2100 User manual

Dionex
Dionex ICS-900 User manual

Dionex
Dionex DX-120 User manual


Popular Laboratory Equipment manuals by other brands

LaboGene
LaboGene CoolSafe 100-9 Touch Superior XS instruction manual

ANAND MEDICAIDS
ANAND MEDICAIDS HI VAC PLUSS 60 LTR/MIN user manual

Promega
Promega Maxwell AS1840 Instructions for use

Gilson
Gilson PIPETMAN P2L user guide

Accurion
Accurion i4 Series operating instructions

Nordson
Nordson CoolWave 2 product manual


