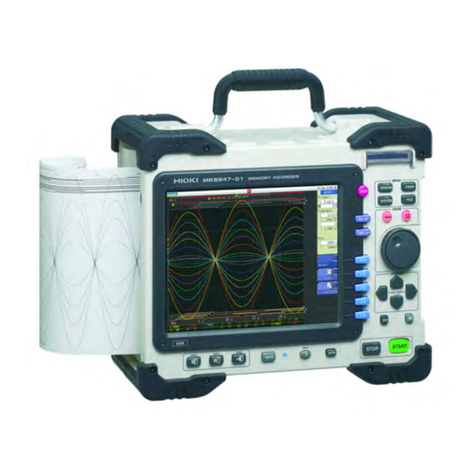
Hioki Memory HiCorder MR6000 User manual

EN
Instruction Manual
Feb. 2018 Edition 1
MR6000A966-00 18-02H
MR6000-01
MEMORY HiCORDER
MR6000


Contents
i
3.3 Fine-Adjusting Input Values
(Vernier Function) .......................... 48
3.4 Inverting the Waveform
(Invert Function)............................. 49
3.5 Copying Settings
(Copy Function).............................. 50
3.6 ConguringModule-Specic
Settings ........................................... 51
Setting Model 8968 High Resolution
Unit .............................................................51
Setting Model 8967 Temp Unit....................52
Setting Model U8969 Strain Unit ................54
Setting Model 8970 Freq Unit .....................56
Setting Model 8971 Current Unit ................59
Setting Model 8972 DC/RMS Unit ..............61
Setting Model MR8990 Digital Voltmeter
Unit .............................................................62
Setting Model U8974 High Voltage Unit .....64
4 Saving/Loading Data
andManagingFiles 65
4.1 Data That Can Be Saved and
Loaded ............................................ 66
4.2 Saving Data..................................... 67
Save types and setting procedure ..............67
Saving waveform data automatically ..........68
Real-time save............................................72
Freely selecting data items to be saved
and save les (SAVE key) ..........................74
4.3 Loading Data .................................. 77
Data loading procedure ..............................77
Loading the settings automatically
(Auto-setup function) ..................................78
4.4 ManagingFiles ............................... 79
5 Setting the Trigger 81
5.1 Trigger Setting Procedure ............. 82
5.2 Enabling the Trigger Function ...... 83
5.3 Setting the Trigger Timing............. 84
5.4 Setting the Pre-trigger and
Post-trigger..................................... 86
To observe the input waveforms while
the instrument is waiting for a trigger..........90
5.5 Setting the Trigger Logical
Conditions (AND/OR) among
Trigger Sources.............................. 91
5.6 Triggering the Instrument Using
Analog Signals ............................... 93
5.7 Triggering the Instrument With
Logic Signals (Logic Trigger)...... 102
Contents
Introduction................................................ 1
HowtoRefertoThisManual .................... 2
1 MeasurementMethod 3
1.1 MeasurementProcedure ................. 3
1.2 ConguringMeasurement
Conditions ........................................ 5
Sampling rate setting guideline.....................7
Using the envelope .......................................9
1.3 Setting Input Channels ...................11
Analog channels .........................................13
Logic channels............................................17
1.4 Setting the Sheets.......................... 18
Switching sheets on the waveform
screen .........................................................19
1.5 Starting/Stopping the
Measurement .................................. 20
2 Operating the
Waveform Screen and
Analyzing Data 21
2.1 ReadingMeasuredValues
(Trace Cursors)............................... 22
2.2 Specifying the Waveform Range
(Section Cursor) ............................. 26
Changing the display magnication of
the waveforms while moving the section
cursor..........................................................27
2.3 Displaying Vertical Scales
(Gauge Function) ........................... 28
2.4 Scrolling Waveforms...................... 30
Scrolling waveforms....................................30
Checking a position of waveforms with
the scroll bar ...............................................31
2.5 Changing the Display Position
andDisplayMagnicationofthe
Waveforms ...................................... 32
Differentiating the waveform display
position and display magnication for
each analog channel...................................33
2.6 Operating the Rotary Knob ........... 36
2.7 Enlarging a Part of the
Waveform (Zoom Function)........... 37
3 Advanced Functions 39
3.1 Overlaying New Waveforms
With Previously Acquired
Waveforms ...................................... 40
3.2 Converting Input Values
(Scaling Function).......................... 42
When using Model U8969 Strain Unit.........47
MR6000A966-00
10
9
8
7
6
5
4
3
2
1
Index

Contents
ii
5.8 Triggering the Instrument at
Regular Intervals
(Interval Trigger)........................... 104
5.9 Triggering the Instrument
Externally (External Trigger) ....... 106
5.10 Triggering the Instrument
Manually(ForcibleTrigger) ......... 106
6 Search Function 107
6.1 Searching For Peak Values ......... 108
6.2 Searching For the Positions
Where Trigger Condition Is
Satised .........................................110
6.3 Searching For Differences from
the Fundamental Wave
(MemoryHiConcierge)..................114
6.4 Allowing the Display to Jump to
theSpeciedPosition...................116
7 Numerical Calculation
Function 119
7.1 Numerical Calculation
Procedure ..................................... 120
7.2 Setting Numerical Calculation .... 122
Displaying the numerical calculation
results .......................................................131
7.3 Evaluating the Calculation
Results on a Pass/Fail Basis....... 132
Displaying the evaluation results and
outputting signals externally .....................135
7.4 Numerical Calculation Types
and Descriptions .......................... 136
8 Setting the System
Environment 143
9 Connecting the
Instrument to PCs 149
9.1 ConguringtheLANSettings
and Connecting to the
Network ......................................... 150
Conguring the LAN settings with the
instrument .................................................150
9.2 ManagingDataintheInstrument
With the FTP Server Function .... 155
Setting the FTP sever with the
instrument .................................................156
Operating the instrument with a PC
(FTP server function) ................................157
9.3 Sending Data to a PC With the
FTP Client Function ..................... 158
Setting up an FTP server on a PC............159
Setting the FTP client with the
instrument .................................................163
9.4 Operating the Instrument with a
Browser Installed in a PC ............ 164
Connecting the PC to the instrument
with Internet browser ................................165
Operating the instrument remotely ...........166
Starting/Stopping the instrument ..............167
Setting the comment.................................168
Acquiring data from the instrument...........169
Setting the clock .......................................170
Handling les ............................................170
9.5 Sending Emails ............................ 171
Conguring the basic setting for sending
email .........................................................172
Setting email contents ..............................173
Setting authentication, compression,
and encryption for emails to be sent.........174
9.6 Controlling the Instrument with
Command Communications
(LAN) ............................................. 176
10 Controlling the
Instrument Externally 179
10.1 External Input and Output ........... 180
External input (IN1), (IN2).........................180
External output (OUT1), (OUT2)...............181
Trigger output (TRIG.OUT).......................183
External trigger terminal (EXT.TRIG) ........185
10.2 External Sampling
(EXT.SMPL) ................................... 187
11 Appendix 189
11.1 Information for Reference
Purposes....................................... 189
Waveform le size (for reference).............189
Maximum recording time when the
real-time save is on (reference) ................193
Scaling method for strain gauges .............199
Example of a waveform text le................200
Index Ind.1
1
Introduction
Introduction
Thank you for purchasing the HIOKI MR6000, MR6000-01 Memory HiCorder. To obtain maximum
performance from the instrument over the long term, be sure to read this manual carefully and keep
it handy for future reference.
Model MR6000-01 Memory HiCorder is a model of Model MR6000 equipped with the following
calculation functions (options):
• Digital lter calculation
• Real-time waveform calculation
Following manuals are provided along with these models. Refer to the relevant manual based on
the usage.
Type Contents Print PDF
Operating Precautions Information on the instrument for safe operation –
Quick Start Manual Basic instructions and instrument specications –
Instruction Manual
(this document) Functions and instructions for the instrument –
Calculation Guide (Options) Method to use the calculation functions, etc. available
only with Model MR6000-01 –
Notations
*Additional information is presented below.
Indicates the initial setting values of the items. Initialization sets the items to these
values.
(p. ) Indicates the location of reference information.
START
(Bold-faced) Indicates the names and keys on the windows in boldface.
[ ] Menus, dialogs, buttons in a dialog, and other names on the screen are indicated in
brackets.
Windows Unless otherwise specied, “Windows” represents Windows 7, Windows 8, and
Windows 10.
Current sensor Sensors measuring current are referred to as “current sensor.”
S/s
The number of times per second the analog input signals are digitized by the
instrument is expressed in terms of “samples per second (S/s).”
Example: “20 MS/s” (20 megasamples per second) indicates that the signal is digitized
20 × 106times per second.
Accuracy
We dene measurement tolerances in terms of f.s. (full scale), and rdg. (reading) with the following
meanings:
f.s. (maximum display value or scale length)
The maximum displayable value or scale length.
rdg. (displayed value)
The value presently being measured and indicated on the measuring instrument.

2
How to Refer to This Manual
How to open a screen
Indicates the order of tapping
the screens.
The button represents the
setting key.
Sequence numbers
Numbered same as a
corresponding step-by-step
instruction.
Options and explanations
Describes selectable
settings when an item is
tapped.
The icon indicates the
default setting of the item.

3
1Measurement Method
1.1 Measurement Procedure
Inspecting the instrument before measurement
Conguring the basic settings for measurement
Set the sampling rate. (p. 5)
Set the recording length. (p. 6)
Advanced settings: “Using the envelope” (p. 9)
“3.1 Overlaying New Waveforms With Previously
Acquired Waveforms” (p. 40)
Setting the input channels (p. 11)
Set the analog channels. (p. 13)
Set the logic channels. (p. 17)
Advanced settings: “3.2 Converting Input Values (Scaling Function)” (p. 42)
“3.3 Fine-Adjusting Input Values (Vernier Function)” (p. 48)
“3.4 Inverting the Waveform (Invert Function)” (p. 49)
Setting the sheets
Set the display format of waveforms. (p. 18)
Setting the triggers (p. 81)
Starting a measurement (p. 20)
Finishing the measurement
Advanced operation: “2.2 Specifying the Waveform Range (Section Cursor)” (p. 26)
“Scrolling waveforms” (p. 30)
“2.5 Changing the Display Position and Display
Magnication of the Waveforms” (p. 47)
“4 Saving/Loading Data and Managing Files” (p. 65)
“7 Numerical Calculation Function” (p. 119)
1 Measurement Method
1
Measurement Method

4
Measurement Procedure
To perform the automatic setup
On the waveform screen, tap [Auto range] to set the sampling rate, measurement range, and zero
position of input waveforms automatically, and then start a measurement.
Refer to “3.7 Measurement With the Auto-range Setting” in Quick Start Manual.
To load settings registered previously
Load the settings le on the le screen.
Refer to “4.3 Loading Data” (p. 77).
To load saved settings automatically at the time of startup
Congure the setting for the instrument so as to load the le containing the instrument settings at
the time of startup.
Refer to “Loading the settings automatically (Auto-setup function)” (p. 78)
To initialize the instrument (restoring the basic settings)
Restore the instrument settings to the factory default by tapping [Initialize], which is accessible by
proceeding in the following order:
> [System] > [Initialize]
The setting after the initialization is suitable for simple measurement.
If any unexpected or complicated behavior is observed, initialize the instrument.
Refer to “6.2 Initializing the Instrument” in Quick Start Manual.

5
Conguring Measurement Conditions
1.2 Conguring Measurement Conditions
Congure conditions required for measurement including the sampling rate ([Sampling]) and
recording length ([Shot]).
> [Status] > [Condition]
6
2
3
4
1
5
7
1
Type a comment in the [Title comment] box.
Number of characters: up to 40
2
Set [Sampling].
Refer to “Sampling rate setting guideline” (p. 7).
200 MS/s, 100 MS/s, 50 MS/s, 20 MS/s, 10 MS/s, 5 MS/s, 2 MS/s, 1 MS/s,
500 kS/s, 200 kS/s, 100 kS/s, 50 kS/s, 20 kS/s, 10 kS/s, 5 kS/s, 2 kS/s, 1 kS/s,
500 S/s, 200 S/s, 100 S/s, 50 S/s, 20 S/s, 10 S/s, 5 S/s, 2 S/s, 1 S/s
When the real-time waveform calculation (Model MR6000-01 only) is set to [On], a sampling rate of 200 MS/s
cannot be selected.
When the real-time save is set to [On], due to the combination of the number of channels to be used and save
destinations, the maximum sampling rate that can be set varies as follows:
Number of channels to be used
Maximum sampling rate that can be set
SSD HDD
USB ash drive
SD card
FTP transmission
1 channel to 2 channels 20 MS/s 10 MS/s 5 MS/s
3 channels to 4 channels 10 MS/s 5 MS/s 2 MS/s
5 channels to 8 channels 5 MS/s 2 MS/s 1 MS/s
9 channels to 16 channels 2 MS/s 1 MS/s 500 kS/s
17 channels to 32 channels 1 MS/s 500 kS/s 200 kS/s
Only if the following Hioki-designated options are used, the real-time save operation with the instrument is
guaranteed:
• Model U8332 SSD Unit
• Model U8333 HD Unit
• Model Z4006 USB Drive
• Model Z4001 and Model Z4003 SD Memory Card
1
Measurement Method

6
Conguring Measurement Conditions
3
Set [External sampling].
The external sampling is disabled when the envelope is used.
OffDisables the external sampling function.
On Select this option to sample data at a sampling rate dened by a signal input into the
external sampling terminal (EXT.SMPL).
Samples data at rising edges of the input signal.
Samples data at falling edges of the input signal.
4
Set [Shot].
Tap [Points] to set the number of measurement points.
2.5 k, 5 k, 10 k, 20 k, 50 k, 100 k, 200 k, 500 k, 1 M, 2 M, 5 M, 10 M, 20 M, 50 M, 100 M, 200 M,
500 M, 1 G
Enabling [Any] and tapping [Points] allows you to set the number of points in increments of 100.
When the real-time save is set to [On], [Shot] cannot be set in terms of [Points].
Set [Recording time] on the [Save] screen. (p. 73)
The maximum recording length that can be set varies depending on the number of channels to be measured.
5
Set [Mode].
Single Measures waveforms only once. Pressing the START key starts recording waveforms,
and then stops when the specied recording length of the waveforms have been
acquired.
RepeatMeasures waveforms repeatedly. Pressing the STOP key stops the measurement in
progress.
When [Repeat] mode is set and [Count] is set to [On], the specied number of measurements are performed.
Only [Single] mode can be selected when [Realtime save] is set to [On].
6
Set [Overlay].
Refer to “3.1 Overlaying New Waveforms With Previously Acquired Waveforms” (p. 40).
7
Set [Realtime save] to [On].
Data can be recorded in the optional storage device while measuring waveforms.
Refer to “Real-time save” (p. 72).

7
Conguring Measurement Conditions
Sampling rate setting guideline
Select a sampling rate using the following table as a guideline.
Maximum display
frequency Sampling rate Maximum display
frequency Sampling rate
8 MHz 200 MS/s 400 Hz 10 kS/s
4 MHz 100 MS/s 200 Hz 5 kS/s
2 MHz 50 MS/s 80 Hz 2 kS/s
800 kHz 20 MS/s 40 Hz 1 kS/s
400 kHz 10 MS/s 20 Hz 500 S/s
200 kHz 5 MS/s 8 Hz 200 S/s
80 kHz 2 MS/s 4 Hz 100 S/s
40 kHz 1 MS/s 2 Hz 50 S/s
20 kHz 500 kS/s 0.8 Hz 20 S/s
8 kHz 200 kS/s 0.4 Hz 10 S/s
4 kHz 100 kS/s 0.2 Hz 5 S/s
2 kHz 50 kS/s 0.08 Hz 2 S/s
800 Hz 20 kS/s 0.04 Hz 1 S/s
If the instrument plots non-existent waveforms (aliasing)
If a measured signal oscillates at a higher frequency compared to the specied sampling rate, the
instrument may plot non-existent waveforms oscillating at a lower frequency than that of the actual
signal when the signal frequency reaches a certain level. This phenomenon is called aliasing.
Actual input signal
Sampling interval
: Sampled points
Observed waveform
A sampling interval longer than the cycle
of the input signal causes aliasing.
To plot a sign wave that allows you to observe the peaks of the sine wave on the LCD without any
aliasing, the instrument needs to sample the waveform at a minimum of 25 points per cycle.
To set the sampling rate automatically
Refer to “3.7 Measurement With the Auto-range setting” in Quick Start Manual.
1
Measurement Method

8
Conguring Measurement Conditions
Update rate of each module
The data update rate is not allowed to exceed the maximum sampling rate of each module.
The same data are measured until they get updated, causing the instrument to plot a stair-step
waveform.
In addition, even though the same signal is measured simultaneously, values may vary due to
differences in the sampling rate, frequency range, and frequency characteristics of modules.
Module Sampling rate of module Reference
Model 8966 Analog Unit 20 MS/s (50 ns) –
Model 8967 Temp Unit Varies according to the data refresh
setting. p. 52
Model 8968 High Resolution Unit 1 MS/s (1 µs) –
Model U8969 Strain Unit 200 kS/s (5 µs) p. 54
Model 8970 Freq Unit Varies according to the setting. p. 56
Model 8971 Current Unit 1 MS/s (1 µs) p. 59
Model 8972 DC/RMS Unit Varies according to the response setting. p. 61
Model 8973 Logic Unit 20 MS/s (50 ns) –
MR8990
Digital Voltmeter Unit Varies according to the NPLC setting. p. 62
Model U8974 High Voltage Unit 1 MS/s (1 µs) p. 64
Model U8975 4ch Analog Unit 5 MS/s (200 ns) –
Model U8976 High Speed Analog Unit 200 MS/s (5 ns) –

9
Conguring Measurement Conditions
Using the envelope
> [Status] > [Condition]
1
2
3
1
Set [Measurement method] to [Envelope].
NormalDoes not use the envelope.
Envelope Uses the envelope.
• Normal:
The instrument records data at the specied sampling rate.
• Envelope:
At the specied recording interval, the instrument records the maximum and minimum values among data
sampled within each specied recording interval at an over-sampling rate* of 100 MS/s. Hence, even though
a relatively longer recording interval is set, peaks of uctuations can be recorded without being missed.
*: Over-sampled data (indicated by blue dots in the gure) are not saved.
• Values to be acquired using the envelope
Maximum
Minimum
Recording
interval
Oversampling interval (10 ns)
: Over-sampled data
: Stored data (data of the maximum and minimum
values)
: Waveform shown on the screen
A set of sampled data acquired using the envelope consists of two values: the maximum value and the
minimum value. These values are taken from the measured values acquired at an over-sampling rate during
the recording interval set in [Sampling]. When shown on the screen, they are displayed as if they range in
amplitude. When saved in an external storage device, the data of the maximum and minimum values are
stored for a single instance of measurement.
1
Measurement Method

10
Conguring Measurement Conditions
2
Set [Sampling].
The following are the sampling rates that can be selected when the envelope is used.
10 MS/s, 5 MS/s, 2 MS/s, 1 MS/s, 500 kS/s, 200 kS/s, 100 kS/s, 50 kS/s, 20 kS/s, 10 kS/s,
5 kS/s, 2 kS/s, 1 kS/s, 500 S/s, 200 S/s, 100 S/s, 50 S/s, 20 S/s, 10 S/s, 5 S/s, 2 S/s, 1 S/s,
30 S/min, 12 S/min, 6 S/min, 2 S/min, 1 S/min
3
Set [Shot].
Tap [Points] to set the number of measurement points.
2.5 k, 5 k, 10 k, 20 k, 50 k, 100 k, 200 k, 500 k, 1 M, 2 M, 5 M, 10 M, 20 M, 50 M, 100 M, 200 M,
500 M,1 G
Enabling [Any] and tapping [Points] allows you to enter [Points] in increments of 100 points.
When the real-time save is set to [On], [Shot] cannot be set in terms of [Points].
Set [Recording time] on the [Save] screen. (p. 73)
The maximum recording length that can be set varies depending on the number of channels to be measured.

11
Setting Input Channels
1.3 Setting Input Channels
Congure the settings of the analog and logic channels.
> [Channel]
Operation available on the [Channel] screen
• Adding a comment to a channel
• Setting measurement conditions for a channel
• Setting the display method of waveforms
• Converting measured values into physical quantities and displaying them
1
Measurement Method

12
Setting Input Channels
Channel setting procedure
Analog channels (CH1 through CH32) setting procedure
Conguring input settings
Set the measurement mode. (p. 13)
Select an appropriate range for measurement. (p. 14)
Convert input values. (Scaling function) (p. 16)
Set the input coupling. (p. 15)
Set the low-pass lter (if noise is observed). (p. 15)
Conguring the display settings
Set the display color of waveforms. (p. 16)
Convert input values. (Scaling function) (p. 16)
Logic channels (Model 8973 Logic Unit) setting procedure
Conguring the display settings
Set the logic recording width. (p. 17)
Set the display positions of waveforms. (p. 17)
Set the display colors of waveforms. (p. 17)

13
Setting Input Channels
Analog channels
For details on setting each module, refer to “3.6 Conguring Module-Specic Settings” (p. 51).
> [Channel] > [UNIT]
4
7
12
3
5
6
The waveform screen is displayed during measurement.
When no measurement is not performed, the presently
input waveforms are displayed on the monitor.
8
9
8
8
1
Set [Use] to [On] or [Off].
OnSets the module as the measurement device.
Off Does not set the module as the measurement device.
Since no data is acquired, nothing can be displayed or saved.
2
Type a comment in the [Comment] box.
Number of characters: up to 40
3
Set [Mode].
VoltageMeasures a waveform in voltage mode.
Temperature Measures a waveform in temperature mode.
Settings vary depending on the installed modules.
Refer to “3.6 Conguring Module-Specic Settings” (p. 51).
1
Measurement Method

14
Setting Input Channels
4
Set [Range (f.s.)].
Set the measurement range for each channel. The value of the range represents its maximum displayable
value (f.s.).
See the following table for the full-scale resolution of each module.
If the input voltage exceeds the measurable range (overrange occurs), change the measurement range to one
having a lower sensitivity.
After changing [Range (f.s.)], check the [Level], [Upper], [Lower], and other values of the trigger, search,
and numerical calculation functions.
Module Resolution [LSB]
Model 8966 Analog Unit, Model 8971 Current Unit, Model 8972 DC/RMS Unit 2,000
Model 8967 Temp Unit 20,000
Model 8968 High Resolution Unit, Model U8974 High Voltage Unit,
Model U8975 4ch Analog Unit 32,000
Model U8976 High Speed Analog Unit 1,600
Model U8969 Strain Unit 25,000
Model 8970 Freq Unit (Power frequency mode) 2,000
Model 8970 Freq Unit (Count mode) 40,000
Model 8970 Freq Unit
(Frequency mode, rotation speed mode, duty ratio mode, pulse width mode) 10,000
Model MR8990 Digital Voltmeter Unit 1,000,000
*: For the Model 8967 Temp Unit, the valid range varies depending on the thermocouples. For more
information about resolution, refer to “Model 8967 Temp Unit” in “5.2 Specications for Options” in Quick
Start Manual.

15
Setting Input Channels
5
Set [Coupling], [L.P.F.], and [Probe ratio].
Tap the screen to open the settings dialog box.
(1)
(2)
(3)
(1) Set [Coupling].
The input signal coupling method can be specied. In general, use the DC coupling.
DCMeasures both DC and AC components of an input signal.
AC Measures an AC component only of an input signal. A DC component can be
eliminated.
GND Connect the input terminal to the ground (Enables you to check the zero position).
(2) Set [L.P.F.] (low-pass lter).
Enabling the low-pass lter installed in the module allows elimination of unwanted high-frequency components.
The lters that can be set varies depending on the type of modules. Select a lter according to the
characteristics of the input signals.
Example: For Model 8966 Analog Unit
Off, 5 Hz, 50 Hz, 500 Hz, 5 kHz, 50 kHz, 500 kHz
(3) Set [Probe ratio].
Select this setting when the measurement is to be performed with a connection cable or probe.
1:1Select this option when using Model L9197, Model L9198, Model L9790, or Model
L9217 Connection Cord.
1:10 Select this option when using Model 9665 10:1 Probe.
1:100 Select this option when using Model 9666 100:1 Probe, Model P9000-01 Differential
Probe, or Model P9000-02 Differential Probe.
1:1000 Select this option when using Model 9322 Differential Probe, Model P9000-01
Differential Probe, or Model P9000-02 Differential Probe.
1
Measurement Method

16
Setting Input Channels
6
Set [Display].
OnDisplays the waveforms on the waveform screen.
Color Allows you to select display colors of the waveforms. You can also select the
same color as the lines acquired through other channels.
Invert
(Off, On)
When the signs of displayed waveforms are reversed, the waveforms can be
inverted.
Refer to “3.4 Inverting the Waveform (Invert Function)” (p. 49).
Vernier Allows you to ne-adjust the input voltage freely on the waveform screen
(display adjustment only). When recording physical values such as noise,
temperature, and acceleration with sensors, you can adjust those amplitudes,
facilitating calibration.
Refer to “3.3 Fine-Adjusting Input Values (Vernier Function)” (p. 48).
Off Displays no waveforms.
7
Set [Scaling].
Refer to “3.2 Converting Input Values (Scaling Function)” (p. 42).
8
Switch the channels.
Tap the corresponding location to switch the channels.
9
Set [Digital lter] for each channel. (Model MR6000-01 only)
The [Df] setting is displayed for only channels with [Digital lter] set to [On], allowing you to set the digital
lter for each channel.
For more information, refer to “Setting the Digital Filter Calculation” in Calculation Guide.
Other manuals for Memory HiCorder MR6000
4
This manual suits for next models
1
Table of contents
Other Hioki Measuring Instrument manuals

Hioki
Hioki CM3286 User manual

Hioki
Hioki 8715-01 User manual

Hioki
Hioki PW3335 User manual

Hioki
Hioki CM4373-50 User manual

Hioki
Hioki CT6845-05 User manual

Hioki
Hioki PW3365 User manual

Hioki
Hioki 3284 HiTester User manual

Hioki
Hioki MR8880-20 User manual

Hioki
Hioki 3275 User manual

Hioki
Hioki CT6710 User manual