HP 8754A Owner's manual

-~
ARTISAN
®
~I
TECHNOLOGY
GROUP
Your definitive source
for
quality
pre-owned
equipment.
Artisan Technology
Group
Full-service,
independent
repair
center
with
experienced
engineers
and
technicians
on staff.
We
buy
your
excess,
underutilized,
and
idle
equipment
along
with
credit
for
buybacks
and
trade-ins
.
Custom
engineering
so
your
equipment
works
exactly as
you
specify.
•
Critical
and
expedited
services
•
Leasing
/
Rentals/
Demos
• In
stock/
Ready-to-ship
•
!TAR-certified
secure
asset
solutions
Expert
team
ITrust
guarantee
I
100%
satisfaction
All
tr
ademarks,
br
a
nd
names, a
nd
br
a
nd
s a
pp
earing here
in
are
th
e property of
th
e
ir
r
es
pecti
ve
ow
ner
s.
Find the Keysight / Agilent 8754A at our website: Click HERE

HP Archive
This vintage Hewlett Packard document was preserved
and distributed by
www. hparchive.com
Please visit us on the web !
On-line curator: Bob Freeman
Artisan Technology Group - Quality Instrumentation ... Guaranteed | (888) 88-SOURCE | www.artisantg.com

OPERATING
INFORMATION
8754A
NETWORK
ANAL
VZER
4
MHz
-1300
MHz
HEWLETT
11
~
PACKARD
Artisan Technology Group - Quality Instrumentation ... Guaranteed | (888) 88-SOURCE | www.artisantg.com

HEWLETT
i:/;
PACKARD
OPERATING INFORMATION
8754A
NETWORK
ANALYZER
4
MHz
-
1300
MHz
©Copyright
HEWLETT-PACKARD
COMPANY
1978
1400
FOUNTAIN
GROVE
PARKWAY,
SANTA
ROSA,
CALIFORNIA
95404
U.S.A.
MANUAL
PART
NO.
08754-90016
Printed:
May
1979
Artisan Technology Group - Quality Instrumentation ... Guaranteed | (888) 88-SOURCE | www.artisantg.com

CONTENTS
INSTRUMENT
DESCRIPTION 3
Block Diagram Description
Measurement Accessories
8754A
Specifications
8754A
Performance Characteristics
FRONT PANEL
INTRODUCTION
10
Select Measurement
Set CRT Display'
Set Frequency Sweep
Set Signal Levels
Measurement Calibration
Electrical Length Compensation
Read measured'Value
TRANSMISSION MEASUREMENTS 17
Test Setup
Insertion Loss
or
Gain
Relative Measurements
Insertion Phase
Simultaneous Measurements
REFLECTION MEASUREMENTS
21
Test Setup
Return Loss
Reflection Coefficient
Impedance -Using the Smith Chart
Simultaneous Measurements
POWER
LEVEL
MEASUREMENTS 25
S-PARAMETER MEASUREMENTS 25
Test Setup
Transistor Bias
Calibration
Measurement
Impedance -Using the Smith Chart
USING THE 8750A STORAGE-NORMALIZER 29
Installation
Alignment Test
Digital Storage
Normalization
Matching
the
8750A
to
the
8754A
USING AN
EXTERNAL
SOURCE 33
Narrowband Sweep Using Source With
FM
Capabilities
Wideband Sweep Using Source With FM Capabilities
Narrowband Sweep Using External Swept Source
CONTROLS, INDICATORS,
and
DISPLAYS SUMMARY 36
CRT Display
Source
Receiver
INPUTS/OUTPUTS
SUMMARY
39
Rear Panel
J7, Programming Connector
QUICK REFERENCE
GUIDE
44
Artisan Technology Group - Quality Instrumentation ... Guaranteed | (888) 88-SOURCE | www.artisantg.com

PREFACE
This operating information
booklet
will help
you
make transmission and reflection measure-
ments
with the
HP
8754A
Network Analyzer and its associated test sets and accessories.
This information is placed in Section 3
of
the
8754A
Operating and Service Manual
as
well
as
being supplied
as
aseparate
booklet
to
be
kept
with
the
instrument for use
by
the
operator.
This booklet introduces the
8754A
and its standard measurement accessories,
as
well
as
its
specifications and its operating characteristics. Then
it
describes basic measurement setup
operations, such
as
setting
frequency sweep and measurement calibration, performed for
all measurements. Specific step-by-step sequences used
to
measure and interpret response
of
the
test device are found in
the
Transmission Measurements, Reflection Measurements,
Power Level Measurements,
and
S-Parameter Measurements topics. Using
the
Storage-
Normalizer describes setup and use
of
the
HP
8750A
Storage-Normalizer. Adiscussion
of
Using an External Source describes use
of
astabilized source such
as
the
HP
8640B
to
im-
prove resolution for narrowband measurements. Summaries
at
the
end
of
this section de-
scribe the functions
of
the
8754A
controls and indicators and
the
input/output
connections.
8754A
Network
Analyzer
Artisan Technology Group - Quality Instrumentation ... Guaranteed | (888) 88-SOURCE | www.artisantg.com

Display
Model 8754A
RF
Output
4-1300
MHz
Leveling
Loop
>--~'-------IO
Detection
Sweep Markers
CRT
Display
R
(Reference) X
Magnitude
Detector
y
A&B
(Test)
Magnitude
Channell
Detector
Display
Processor
Phase
Detector
X
Polar
Detector
y
2
1
MHz
Reference
Oscillator
3.6-4.3
GHz
1
MHz
Modulator
...
----o<C
3.6 -3.0
GHz
1
MHz
8754A
Receiver
A
8754A
Source
5
to
30
MHz
Frequency
MHz
Harmonic
Generator
Phase-Lock
Loop
Sweep
Shaping
Frequency
Conversion
a
Tuning
I
8
~I
r
Input
8
@~~
1-----
o
to
-80
dBm
Instrument Description
Artisan Technology Group - Quality Instrumentation ... Guaranteed | (888) 88-SOURCE | www.artisantg.com

Model 8754A
INSTRUMENT DESCRIPTION
Introduction
The 8754A Network Analyzer consists
of
an internally leveled 4to 1300 MHz swept source with crystal
markers, athree input tuned receiver with two independent measurement channels,
and
a
CRT
display with
rectangular
and
polar graticules. Together with appropriate signal separation accessories,the 8754Aisa
complete stimulus/response test system
that
measures magnitude
and
phase characteristics
of
linear net-
works by comparing the incident signal with the signal transmitted by the device
or
reflected from its input.
The basic transmission measurements described here are: insertion loss
or
gain, insertion phase, and trans-
mission coefficient,
S21
or
S12.
Basic reflection measurements are: return loss, from which SWR can be
calculated, and reflection coefficient, SII
or
S22'
from which impedance can be calculated
or
read from a
Smith
Chart
overlay.
Block Diagram Description
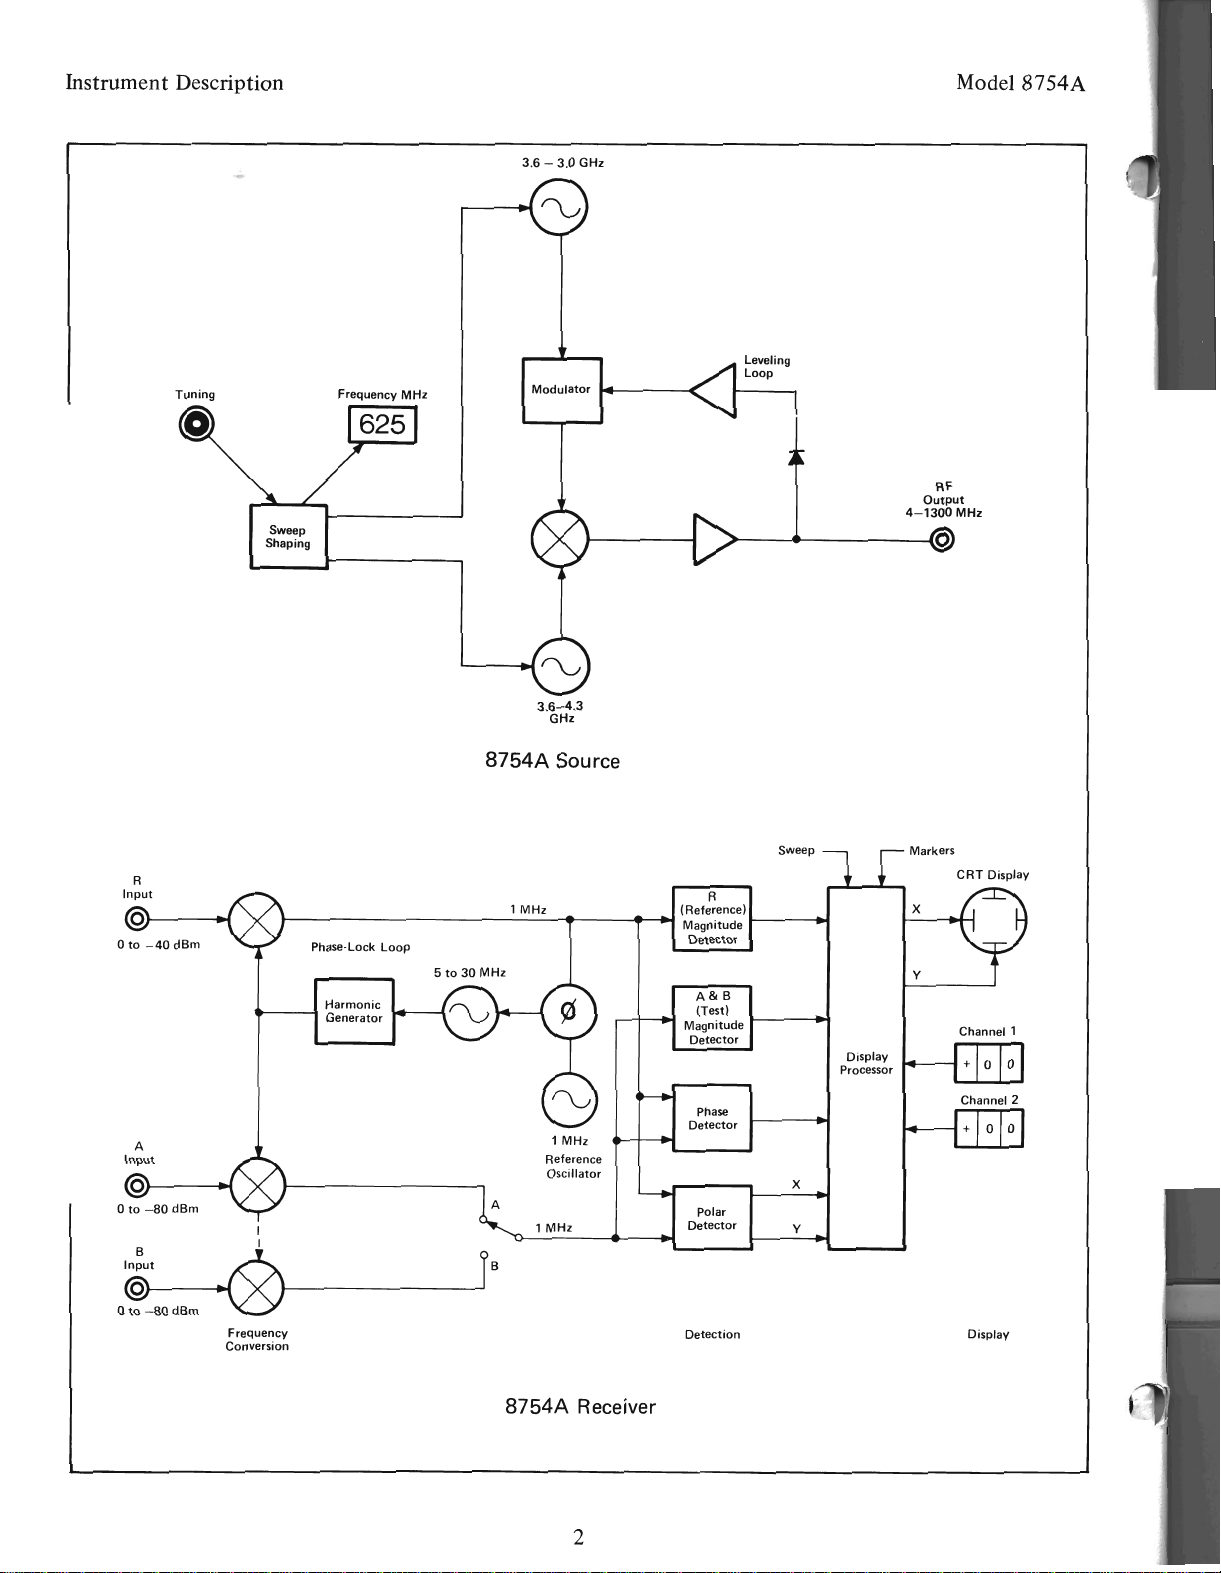
The source provides RF to the test device. It uses two varactor tuned microwave oscillators, one swept up
in frequency from 3.6
to
4.3
GHz
and
one swept down in frequency from 3.6 to 3.0 GHz, in a
"see-saw"
configuration. The oscillator outputs are mixed and the difference frequency
is
amplified to provide the 4
to
1300
MHz
RF output.
An
internal leveling loop maintains constant RF
output
powerlevel over the sweep.
The receiver provides signal processing
to
convert incident (R)
and
test (A
and
B)
inputs
to
dc levels for
display. Signal separation accessories route the signal incident
at
the test device
to
the Rinput
and
the
reflected and transmitted signals
to
the A
or
Binputs. The receiver uses the sampling technique to convert
the three input signals
to
1
MHz
IF
for detection while maintaining theirmagnitude andphase relationships.
An
automatic phase lock loop tunes the receiver
to
the frequency
of
the Rinput signal; the A
and
Binputs
are used as full range test inputs. Two measurement channels allow measurement
of
any two parameters
using asingle test setup.
For
simultaneous transmission and reflection measurements
the
A
or
B
IF
is switched
to
the detectors on alternate sweeps. Absolute magnitude
of
the three inputs as well as the magnitude
ratio
and
phase angle difference between the Rinput
and
either
of
the test inputs are processed for display
on
the built-in CRT.
3
Artisan Technology Group - Quality Instrumentation ... Guaranteed | (888) 88-SOURCE | www.artisantg.com

50n
50n
75n 75n
c::[]
50n
11852A
:::::5.7
dB Loss
75n
75n
c::[]
50n
Model
8754A
50n
Incident
H"'+---~
50n
Test
75n
16.7n
50n
11850A
:::::
9.5
dB Loss Each Path
H"'+---~
75n
Test
75n
c=[]
50n
11852A
:::::5.7
dB loss
o--~\IV"Ir--........---vvo._----Q
50n
RF Input
50n
11850B
:::::
7.8 dB Loss Each Path
o-----~-.JVV\~~
75n
75n
c::[]
50n
RF Input
50n
HE:ItJ'l-€T1">"AC!(il,Rt,l
~
..
).,-.;.:.;
........
.;
.::;.
•
,1~:I
:~ArRAN5MI$S;~N!HF.'FLE:CVOf'
Tf.ST
~~~:",,?o.~~t·:VGH~,
•
11850A/B
Three-Way Power Spl
itter
8502A
Transmission/Reflection
Test
Set
Transmission/Reflection Test Set.
The
8502A (50n)
or
8502B (75n).
Transmission/Reflection
Test Set contains a
power splitter
and
directional bridge allowing transmission
and
reflection measurements using
the
same test setup. It
also incorporates a 0
to
70 dB,
10
dB step
attenuator
to
reduce
the
incident signal level
without
affecting the signal
level
at
the R
input.
The
8502B includes one 11852A
50n
to
75n
Minimum
Loss
Pad
for matchir:g
the
75n Test
output
to
the 8754A
50n,
Binput.
The
11851A
RF
Cable Set consisting
of
three 610
mm
(24")
cables phase
matched
to
±4
degrees
and
one 860
mm
(34'
')
cable
is
recommended for use with the
8502. This cable set
or
its equivalent
is
required
to
perform
phase calibration.
The
equal length cables connect the 8754A
RF, R;
and
Ainputs
to
the
test set
and
the
longer cable serves
as the transmission
return
to
the B
input.
4
S-Parameter Test Set. Transmission and reflection measurements
on
two
port
devices wh.ich require
measurement
of
both
forward
and
reverse characteristics can be accomplished using
the
8748A
S-Parameter
Test Set. This test set contains
the
necessary splitter, couplers, and switches
to
measure forward and reverse
characteristics
without
disconnecting
the
reversing
the
test device, a 0
to
70 dB, 10 dB step
attenuator
to
control
the
incident signal level, and includes
the
necessary equal length signal cables and interface cable
to
connect the test set
to
the
8754A. Connect
the
test device using
the
11857ATest Port Extension Cables
or
the
11608A, 11600B,
or
11602B Transistor Fixtures.
Measurement Accessories
Several test set,-, signal cable sets,
and
other
measurement accessories are designed especially for use with
the 8754A.
Power Splitter.
For
precision transmission measurements,
use the 11850A (50n)
or
11850B (75n) Three
Way
Power
Splitter
and
the 11851 A
RF
Cable Kit.
One
output
port
provides the reference signal
and
.the
other
two ports can be
used for independent transmission measurements.
The
11850B includes three 11852A 50n
to
75n
Minimum
Loss
Pads
for matching the
75n
11850B
outputs
to
the 8754A 50n,
R, A,
and
Binputs.
Instrument Description
Artisan Technology Group - Quality Instrumentation ... Guaranteed | (888) 88-SOURCE | www.artisantg.com

Mode18754A Instrument Description
6dB
Coupling
-6
dB iI
I
I
I
____________
J
Port
---..---I-----~
2
DC
Bias
--
------------,
I
I
t
I
I
-6
dB I
Port
1
Reference
Plane
Extension
I
I
I
I
I
I
I
~.....-.+--<
A
I
II
~------------~
II
I
I
rt
I
I
I
I
511/521
o---------J
8748A
L _
RF
Input
8748A
Reference Plane
Extension
Cables
8748A
S-Parameter
Test
Set
Measurement setup instructions for the 8748A will refer
to
the rear panel Reference
Plane
Extension cables. These are
the rigid loops provided with the 8748A
to
equalize the
lengths
of
the reference
and
test signal paths
to
achieve
correct phase calibration. Six
of
these loops are provided.
Connect one between the 8748A
rear
panel
REFERENCE
PLANE
EXTENSION
connectors depending
upon
the
method
used
to
connect the test device
to
the test ports. The
table below lists their
part
numbers
and
application in order
of
increasing lengtll.
HP Part
No.
Appl
ication
Storage-Normalizer. Two storage-normalizer units are offered
for use with the 8754A. Both use digital storage
to
provide
crisp, flicker-free CRT displays regardless
of
sweep rate, and
normalization
to
remove
the
frequency response character-
istics
of
astandard from the measurement.
08748-20020
08748-20021
08478-20022
08478-20023
08478-20024
08748-20025
Test device
connected
directly
to
Port
1
or
Port
2
(reflection
only).
60
to
120
mm
adapter
length
at
Port
1
or
Port
2
(reflection
only).
11608A
Transistor
Fixture
(transmission/reflection)
or,
120
to
190
mm
adapter
length
at
Port
1
or
Port
2
(reflection
only).
190
to
250
mm
adapter
length
at
Port
1
or
Port
2
(reflection
only).
116008
or
116028
Transistor
Fixture
with
11858A
Transistor
Fixture
Adapter
(transmission/reflection)
Test device
connected
between
two
11857
A
(610
mm,
24")
Test
Port
Extension
Cables
(transmission/reflection)
8750AStorage
Normalizer
The 8750
is
an economical way
to
provide digital storage and normalization for rectangular magnitude and
phase traces.
All
standard features
of
the
8750 apply
to
operation with
the
8754A. The rectangular measure-
ment
trace
is
digitized
at
250 points/sweep with 500-point y-axis resolution. The
8750A
does
not
process
the
polar trace.
The 850IAprocessing includes averaging and
magnification. In addition,
the
8501 Awill pro-
cess apolar trace. Asingle internal adjustment
(DAC gain)
is
required
to
match
the
8501A
to
the
8754A. All standard features
of
the
850lA
apply
to
operation with the
8754A
except dis-
play
of
operating mode labels. Data can be read
from the 8501 Amemory via the HP-IB. Graphics
written
into
the
8501A
via the HP-IB can be
displayed by the 8754ACRT
but
reduced writing
speed
of
the 8754A CRT causes dropouts and
distortion
of
figures.
8501AStorage Normalizer
5
Artisan Technology Group - Quality Instrumentation ... Guaranteed | (888) 88-SOURCE | www.artisantg.com

HP
8754A
Network
Anal.yzer
Specifications
(I
of
2)
SPECIFICATIONS
Specifications
SOURCE
FREOUENCY
Range: 4MHz
to
1300
MHz
Sweep
Modes:
Linear
full sweep
(4
MHz
to
1300
MHz)
and
calibrated
sweep
widths
with
variable
start
or
center
frequency.
Markers:
Internal,
crystal-generated
harmonic
mark-
ers;
amplitude
markers
for
rectangular
displays,
intensity
markers
for
polar
displays.
Spacing:
I,
10,and
50
MHz
Accuracy:
iO.OI %
Digital
Frequency
Readout:
Indicates
frequency
of
variable
marker
in
linear
full
sweep
mode
and
start
or
center
freq
uency
in
cali
brated
sweep
width
mode.
Resolution:
IMHz
Accuracy:
ilO
MHz
(20°C
to
30°C).
Readout
is
adjustable
for
calibration
to
internal
crystal
markers.
OUTPUT
Power:
Range:
Calibrated
0
to
+ I0
dBm
Accuracy:
iO.8
dB at
50
MHz
Flatness:
iO.5
dB
Spectral
Purity
(at
+10
dBm RF
output
level):
Residual
FM
1:
~7
kHz
RMS
(10
kHz
bandwidth)
bandwidth)
Harmonics:
-
28
dBc
Spurious
Signals: 4MHz
to
500
MHz,
-65
dBc
500
MHz
to
1300
MHz,
-50
dBc
GENERAL
Trigger Modes:
AUTO
(repetitive)
and
TRIG
(single
sweep
triggered
by
front-panel
pushbutton
or
rear-panel
PROGRAMMING
connector)
RF
Output
Connector:
Type
N
Female
1Applies in
swept
and
CW
modes.
6
Mode18754A
RECEIVER
INPUT
Frequency
Range: 4MHz
to
1300
MHz
Input
Channels:
Three
Inputs,
R,
A,
and
B.
Two
test
inputs
(A
and
B)
with
80
dB
dynamic
range
and
a
reference
input
(R)
with
40
dB
dynamic
range.
Impedance:
son.
Input
port
match
~20
dB
return
loss
(~1.22
SWR).
Maximum
Input
Level: 0
dBm
Damage Level:
+20
dBm
(50
Vdc)
Noise Level:
<-80
dBm,
A
and
B
inputs
Minimum
R
Input
Level:
-40
dBm
(~-40
dBm
required
to
operate
R
input
phase
lock)
Crosstalk
Between
Channels:
>83
dB
Error
Limits:
rii 10.0
1!!!!!"!!!!!~~~~~~1!!I!!!!!!"!!!-.pB-----t-~-~!!!"'!!I100
~
~
~
~
~
'c
1.0 10
~
~
~
~
~
g
0.1
Q)
~
g
~
0.1
~
,~
0.01
~
~
~
~
0.001
~
o
-20
-40
-60
_80
0.
01
£
Test
Input
Level
(dB relative
to
highest level applied
to
other inputs)
MAGNITUDE
Frequency
Response
(flatness):
Absolute
(A,
B,
R):
il
dB
Ratio
(A/R,
B/R):
iO.3
dB
Dynamic
Accuracy
(+20°C
to
+30°C):
iO.3
dB
from
0
to
-50
dBm
iO.5
dB
from
-50
to
-60
dBm
il
dB
from
-60
to
-70
dBm
i2.5
dB
from
-70
to
-80
dBm
Artisan Technology Group - Quality Instrumentation ... Guaranteed | (888) 88-SOURCE | www.artisantg.com

Model
8754A
HP
8754A
Network
Analyzer
Specifications
(2
of
2)
Specificatio.ns
RECEIVER
(Cont'd)
Reference
Offset:
Range:
±199
dB in 1dB steps
Accuracy:
Included
in
Dynamic
Accuracy
above.
Display
Resolution:
10,2.5,1,0.25
dB/div
Display
Accuracy:
±2% ±0.05 division
PHASE
Frequency
Response:
~±2.5°
Range:
±180°
Dynamic
Accuracy:
±2° from 0
to
-50
dBm
±4° from 0
to
-70
dBm
Reference
Offset:
Range:
±199° in 1° steps
Accuracy:
±1%
Display
Resolution:
90~
45°, 10°, 2.50ftnajor division
Display
Accuracy:
±2%
±0.05
division
POLAR
See Magnitude
and
Phase specifications
for
Freq-
uency
Response,
Dynamic
Accuracy,
and
Ref-
erence Offset.
Display
Accuracy:
Actual
value is
within
2.5
mm
of
displayed value.
DISPLAY
Measurement
Functions:
CRT
displays
either
polar
trace
or
two
independent
rectangular
traces.
Channel
1: AMagnitude
Absolute
(dBm)
RMagnitude
Absolute
(dBm)
A/R
Magnitude
Ratio
(dB)
B/R
Magnitude
Ratio
(dB)
Channel
2:
BMagnitude
Absolute
(dBm)
B/R
Magnitude
Ratio
(dB)
B/R
Phase (degrees)
Polar:
A/R
Magnitude
Ratio
(dB)
and
Phase (degrees)
7
DISPLAY
(Cont'd)
Reference
Position:
Reference
lines for
Channell,
Channel
2,
and
Polar
Center
can be
indepen-
dently
set
to
any
position
on
the
CRT
for
calibration.
Display
resolution
expands
about
the
Reference
Position
line.
G
raticule
size:
Rectangular
(cartesian):
100
mm
(3.94 in.) hori-
zontal
by
80
nlm
(3.15
in.) vertical.
Polar:
80
mm
(3.15
in.)
in
diameter
Both
graticules
internal
to
CRT
Smith
Chart
Overlays:
Viewing:
0.2
expanded,
0.1
expanded,
com-
pressed
2.0,
regular
Photographic: 0.2
expanded,
0.1
expanded,
compressed,
2.0,
regular
Phosphor:
P39
GENERAL
Magnitude/Phase
Output:
-10
mY/degree
and
-100
mY/dB
at
BNC female
connector
miJti-
plexed
by
TTL
level
or
contact
closure
at
pin
of
PROGRAMMING
connector
for use
with
external
digital
voltmeter.
Accuracy:
Magnitude:
See Magnitude
Dynamic
Accuracy
specifi-
cation.
Phase:
±1.5%
(0
to
±170o),
±2%
(±170°
to
±1800).
Environmental:
Tem
peratu
re:
Operating:
0°C
to
+55'0 C
except
where
noted
Storage:
-40°C
to
+75°C
Power:
Selection
of
100,
120,
220,
and
240
Vac
+5%,
-10%;
48
to
66 Hz;
200
VA
maximum
Dimensions:
133
mm
x
425
mm
x505
mm
(5.25 in. x 16.75 in. x 19.875 in.)
Weight:
Net,
17.7
kg (39
lb);
Shipping:
20
kg (44 lb)
Artisan Technology Group - Quality Instrumentation ... Guaranteed | (888) 88-SOURCE | www.artisantg.com

HP
8754A
Performance Characteristics
(1
of
2)
RECEIVER
-80
1300
Model 8754A·
1000
500
Frequency
(MHz)
RECEIVER (Cont'd)
o
Specification
~.
1'1P\C~
I
o4
Frequency Response (Flatness): Ratio (AIR, B/R):
2.5
-------~.......--....-~.......--...---..--
Reference Offset:
Accuracy: Typically
less
than
±O.l
%
of
value.
Vernier
Range:
Typically ±80
dB
of
variable
offset used for calibration
of
ratio mea-
surements.
Error Resulting from
Change
in
Harmonic Number:
Ratio (A/R and B/R): Typically
~0.05
dB
Absolute (A,
B,
and
R):
Typically
~0.2
dB
Absolute Power Measurements
(A,
B,
and R):
Calibrated
in
dBm; typically
<±0.5
dBm
with
o
dBm,
50
MHz
input
Dynamic Accuracy (+20° to +30°C): Typically
less
than 0.01 dB/dB from
-10
dBm
to
-40
dBm
al
2.
0
...--r---+_______!f---~____!r-----____!I--
]
Note:
.~
1.5
t--------tf---
Referred
to
-20
dBm
c:
.~
1.0
.---+---+----~-+---~~-
---,----1
Q)
(,)
c:
:::>
0.5
.---+---+-
Speci~ication
0.3i--'--1II!III1
---
....
--L~
-20
-40
Input
Level
(dBm)
±0.1
dB
±0.2
dB
±0.3
dB
8
1300
1000
500
Frequency
(MHz)
.
SOURCE
I
Specification
I
\
~TVPical
I
I
l
o4
Sweep Time:
Approximately 10
ms
to
500
ms
in
FAST mode
Approximately 1
sec
to
50
sec
in
SLOW
mode
Frequency Response (flatness): Absolute (A,
B):
Impedance: son. Source match typically
less
than
1.4
SWR
(>
16
dB
return loss).
Power Range:.Uncalibrated to typically +13
dBm
Spectral Purity (at +10 d8m):
Harmonics: Typically
-35
dBc
Spurious Signals:
4to
500
MHz:
Typically
-75
dBc
500
to
1300
MHz:
Typically
-60
dBc
±1
dB
±0.5
dB
Sweep
Width
Accuracy:
500
to
1000
MHz:
Typically ±2%
50
to
200
MHz:
Typically ±5%
1to
20
MHz:
Typically ±8%
Stability:
Temperature: Typically
±400
kHz/oC
Time: Typically ±1
00
kHz/hour
MAGNITUDE
CHARACTERISTICS
GENERAL CHARACTERISTICS
FREOUENCY
CHARACTERISTICS
OUTPUT
CHARACTERISTICS
Specifications
Artisan Technology Group - Quality Instrumentation ... Guaranteed | (888) 88-SOURCE | www.artisantg.com

Model
8754A
Specifications
HP
8754A Per!orlnance Characteristics
(1
of'2)
RECEIVER
(Cont'd)
GENERAL
CHARACTERISTICS
(Cont'd)
Frequency
Response:
DISPLAY:
GENERAL
CHARACTERISTICS
PHASE
CHARACTERISTICS
POLAR
CHARACTERISTICS
Electrical
Length
Adjustment
Range:
Typically
160
mm,
resulting in an 80-mITl
adjustment
to
the
reference plane in a
reflection
measurement.
X-Y
Recorder/External
CRT
Output:
Horizontal:
0.1 V/Div.
(0
to
1
V).
Vertical:
O.1V/Div.
(±0.4
full scale).
Penlift/Blanking:
+5V
Blanking
and
Penlift
~
-5V
intensifies crystal 111arkers.
Connectors:
BNC female.
External
Marker
I
nput:
typically
-13
dBm
RF
signal
into
the
External
Marker
Input
will
produce
an
ampli
tude
(rectilinear)
or
in
tensity
(polar)
marker
on
the
trace
at
the
frequency
of
the
RF
signal.
BNC
fe111ale
connector,
50n.
Probe
Power:
+15
Vdc
and
-12.6
Vdc,
for use
with
10855A
Preanlp
or
1121A
AC
Probe.
Two
probe
power
jacks
are available.
Storage-Normalizer
I
nterfaces:
directly
compatible
with
both
the
HP
8750A
Storage-Normalizer
and
the HP
8501
AStorage-Normalizer. All 8501A
features
except
CRT
labels
and
graphics are avail-
able
when
the
8501A
is
used in
conjunction
with
the
8754A.
Programming
Connector:
Function:
25 pin
Amphenol
connector
(with
nlat-
ing
connector).
Outputs
include
nlagnitude/
phase
and
sweep
outputs
and
inputs
described
above as well as
measurement
mode
selection
by
TTL
levels
or
con
tact
closures.
Warm
Up:
One-half
hour
is
required
for
temperature
to
stabilize.
13001000
500
Frequency
(MHz)
I
...
ISpecificatIOn
t
Tvp;cal----
II
4
o
Video
Filter:
Typically
100
Hz
(10kHz
without
filter)
Reference
Offset
Range:
Vernier
provides
typically
±20°
of
variable
offset
used
for
phase
calibration.
Electrical
Length
Adjustment
Range:
Typically
160
mm.
Phase
Error
Resulting
from
Change
in
Harmonic
Numbe~:
Typically
~0.5°.
External
Sweep
Input:
0
to
+10V
nominal.
BNC
female
connector
used
to
sweep
CRT
display
when
receiver is used
with
an
externally
swept
source
or
to
remotely
program
the
frequency
of
an
internal
RF
source
from
an
external
digital-to-
analog
converter.
Sweep
Output:
-5V
to
+5V
nominal,
BNC female
connector,
used
to
frequency
modulate
(sweep)
external
generator.
9
Artisan Technology Group - Quality Instrumentation ... Guaranteed | (888) 88-SOURCE | www.artisantg.com

For those operators who are familiar with the 8754A, the Quick Reference Guide
on
44
and 45 may be
sufficient.
Model
8754A
Frequency
------.~
1
dB
dBm
deg
FRONT PANEL INTRODUCTION
A=power level
at
A
input
(dBm)
B=power level
at
B
input
(dBm)
R=power level
at
R
input
(dBm)
(R
is
selected when Channels Iand 2are
both
off.)
A/R
=power ratio between Aand Rinputs (dB)
B/R
=power ratio between
Band
Rinputs (dB)
PHASE
B/R
=phase difference between
Band
Rinputs
(degrees)
A/R
=reflected/incident =return loss (dB)
or
re-
flection coefficient =SII
B/R
=transmitted/incident =gain/loss =
S21
10
Rectangular Measurements:
Front
Panel Introduction
Select Measurement
Set CRT Display
Set Frequency Sweep
Set Signal Levels
Measurement Calibration
Electrical Length Compensation
Read Measurement Value
For
more detailed operating instructions, the following paragraphs are supplied. They provide instructions
for the following operations which are common
to
all measurements.
For
example, when the
8754A
is
used with
the
8502A
or
8748A
test sets,
the
R
input
is
the
incident signal, the A
input
is
the reflected signal, and
the
B
input
is
the
transmitted signal.
Select
Measu
rement
Polar
A/R
displays
the
complex coefficient consisting
of
the
magnitude ratio and the phase angle between
the
Aand Rin-
puts. Polar Full scale is selected by changing the Channel I
Reference value; polar phase
rotation
is
selected
by
changing
the Channel 2Reference value.
These
buttons
select the measurement displayed
on
the CRT.
Two independent channels are provided for rectangular measure-
ments
(vs.
frequency). POLAR
A/R
mode overrides the
other
selections and provides an 'X-Y display
of
magnitude and phase.
Rectangular scale/division
is
set independently for each mea-
surement channel.
Artisan Technology Group - Quality Instrumentation ... Guaranteed | (888) 88-SOURCE | www.artisantg.com

Model
8754A
Set CRT Display
The CH Iand CH 2
buttons
are pressed
to
select display
of
the
rectangular reference position line for each channel instead
of
the measurement trace. They provide ameans
to
identify
the
trace for each channel,
and
to
establish
the
vertical position
which corresponds
to
the
REFERENCE value
readout
on
the
corresponding lever switches.
Screwdriver adjustments are provided
to
adjust
the
position
(POSN) and
the
length (GAIN)
of
the
horizontal sweep when
making rectangular measurements.
Front
Panel
Introduction
As
shown
in the
diagrams
below,
for
rectangular displays
of
magnitude
and
phase
the reference position
line is the position
from
which scale/division expands
or
contracts
the trace.
The
reference
position
line for
each
measurement
channel
can
be independently set
to
any
vertical
location
using the
CH
1
~
or
CH2
~
verniers
and
can
bevChanged
at
any
time
without
affecting display calibration. This allows
you
to
set the reference
position
line
to
the
most
convenient
location
for
viewing the trace, usually the center
CRT
graticule.
SCALE/DIVISION
10 2.5
+40 +10 +4 •
•
+30 +7.5 +3
+20 +5 +2
+10 +2.5
+1
•0 0 0
•
-10
-2.5
-1
-20
-5
-2
-30
-7.5
-3
-40 -10
-4
REFERENCE
POSITION
LINE
I
I
I,...
--
~
10
dB/DIV
/""
"""-
VI
V---=
",...-
\\i'..
1\
vj.2.511/ ,
",
f-dB/Orl.
........
~,
II'
1\
'\
1dB/DIV
I I \'
/
II
\\
V\\
SCALE/DIVISION
10
2.5
0 0 0
.
-10
-2.5
-1
-20
-5 -2
-30
-7.5
-3
-40 -10
-4
-50
-12.5
-5
-60
-15
-6
-70
-17.5
-7
-80
-20
-8
POLAR CENTER
is
pressed
to
display
the
polar beam
center
position instead
of
the
polar trace. Use
the
~
and
~~
verniers
to
position
the
polar
center
dot
at
the
center
of
the
polar graticule.
11
Artisan Technology Group - Quality Instrumentation ... Guaranteed | (888) 88-SOURCE | www.artisantg.com

250
SWEEP
WIDTH
MHz
100
©
CENTER
Model
8754A·
REAR
PANEL
FRONT
PANEL
Display Indicates
Center Frequency
SWEEP
INT
-=:J
EXT
/-
-
/\
I\
I
/\
7100 -
~
-
./
MHz
_-
~
I
FREQUENCY MHz
150 200
300
SWEEP
WIDTH
MHz
100
©
START
Display Indicates
Start Frequency
I--
\\\
"-
"-
100 MHz
~
"-
,
....
~
FREQUENCY MHz
200
1300
©
TUNING
FULL
4-1300
Display Indicates
Tuning Marker Frequency
I~
1iI
.........
TUNING
MARKER
I
~J
~
...
l...lIl....
-
4200
_l_t-.
FREQUENCY MHz
12
Usual settings for the SWEEP controls are: AUTO
to
select
the internally-generated sweep trigger, and either FAST
or
SLOW
to
select
the
sweep time range. (Also, set
the
rear
panel SWEEP control
to
INT.) The vernier controls
the
sweep
time within the fast and slow ranges.
Markers are displayed
on
arectangular trace
as
apositive amplitude mark (
SL
)
or
an intensified
short
dash
on
the
polar trace. The MARKERS
buttons
select display
of
internal crystal-generated harmonic
markers
at
50, 10,
or
1
~1Hz
intervals. (1 MHz markers are active only at 20
MHz
and below sweep widths.)
Front
Panel
Introduction
·The frequency
readout
is accurate
to
±10 MHz over the full range and can be calibrated
to
1MHz crystal
marker accuracy
at
the frequency
of
interest using any trace
on
the
rectangular display
and
the
CAL
vernier adjacent
to
the readout.
(If
the
trace is difficult
to
read, use the REFERENCE POSITION line
of
the
unused measurement channel
to
display
the
markers.) Calibrate the readout
as
follows: Select CENTER
sweep mode,
200
MHz sweep width, and 50 MHz markers. Use
the
TUNING control
to
center amarker
(
Jl_
)nearest
the
frequency
of
interest exactly over
the
centervertical graticule. With
the
marker centered,
adjust
the
CAL vernier for a
readout
of
XXOO
or
XX50 (some multiple
of
50
or
100 MHz).
Set Frequency Sweep
As
shown below, the major sweep modes are FULL, START,
and CENTER. Press
FULL
4-1300
and use TUNING
to
set
the start
or
center frequency
of
the sweep
as
indicated by the
digital frequency display and
the
movable tuning marker.
Then select START
or
CENTER and zoom in
on
the
re-
sponse
of
the area
of
interest, using
the
switch selected
sweep widths.
The
8754A
source can sweep
the
full
4-1300
MHz range
or
any intermediate sweep width from 1000 MHz
to
less
than
1MHz. The FREQUENCY MHz display combined with
the
crystal markers make setting and reading frequency simple
and fast.
Artisan Technology Group - Quality Instrumentation ... Guaranteed | (888) 88-SOURCE | www.artisantg.com

Model
8754A
Front
Panel
Introd~ction
You may continue this sequence
at
sweep width positions below 20 MHz and use
the
1MHz markers
to
set
the readout with greater precision. The center
of
the
marker,
not
the
leading
or
trailing edge, indicates
the
50, 10,
or
1
MHz
harmonic frequency.
Another
use for
the
crystal markers is
to
set an intermediate sweep width. Select asweep width one step
higher
than
the width
you
require and select appropriate markers,
then
adjust
the
inner sweep width vernier
counterclockwise from
the
CAL position
to
achieve
the
desired width.
Set Signal Levels
Source Output Power. The
output
dBm
control
sets
the
source
output
level
at
the
RF
OUTPUT connector.
This
output
is
internally leveled between 0dBm and +10 dBm. External precision
attenuation,
such
as
incorporated in the 8502A/B and
8748A
test sets, may be used
to
control
the
incident signal level
at
the
test device.
Input Power. Maximum power which should be applied
to
the
R,
A,
and Binputs
is
0dBm. Above 0dBm,
measurement errors may result from
input
sampler compression. To maintain receiver phase-lock,
the
R
input
level must be between 0dBm and
-40
dBm. The red UNLOCI(ED indicator will light when
the
R
input
falls below
-40
dBm.
The Aand Binputs are identical, each with a 0 dBm
to
-80
dBm range. Best measurement accuracy
is
achieved when
the
R
input
is between 0and
-30
dBm and
the
A
or
Btest inputs are near maximum.
For
example, dynamic accuracy is ±2.5
dB
with
the
test
input
level
at
-75
dBm
but
improves
to
±0.3 dB
above
-50
dBm.
Measurement uncertainty caused
by
crosstalk between inputs can become
important
when
the
signal
levels differ significantly.
For
example, with
the
R
input
at
0dBm and
the
B
input
at
-75
dBm,
the
mea-
surement uncertainty
contributed
by
crosstalk is
about
1dB. This uncertainty can be reduced
to
"about
0.1 dB
by
reducing
the
R
input
level
to
-30
dBm.
The
input
level
at
calibration determines
the
available measurement range without overload
or
excessive
measurement uncertainty.
For
reflection measurements and transmission loss measurements,
the
incident
signal level should be
as
high
as
the
test device characteristics will permit.
For
gain measurements, set
the
incident signal level
to
avalue
at
which
the
expected device
output
will
not
exceed 0dBm at
the
A
or
B
input.
When using
the
8502A/Bor
8748A
test sets,
the
incident signal can be
attenuated
without
reducing
the
signal level
at
the
Rinput.
Two examples are shown in this chart. Example (1) repre-
sents calibration levels for apassive device with
both
Rand
test inputs at 0dBm. When calibrated
at
these levels, loss and
phase may be measured
to
-80
dBm. Example (2) shows
calibration levels for atest device with expected 20
dB
of
gain. The R
input
level
is
set
to
0dBm and
the
test channel
input
level
is
set
to
-25
dBm.
At
these levels,
the
8754A
can
measure up
to
25 dB
of
gain and
about
55 dB loss. Refer
to
the
Power Level Measurements sequence
to
measure
the
signal level at each
input
port.
Example 1Example 2
0
-10
-20
E
-30
OJ
:9.
....
:::J
~
.:
-40
~
a:;
>
-50
Q)
..J
...
Q)
~
0
-60
0-
-70
-80
13
Artisan Technology Group - Quality Instrumentation ... Guaranteed | (888) 88-SOURCE | www.artisantg.com

14
After calibration, the OFFSET vernier should
not
be moved
or
calibration will no longer be valid.
~fodel
8754A
Any device with known characteristics may be used as acalibration standard. The usual calibration stan-
dard
for transmission measurements
is
a
"through"
connection (connect the points
at
which the test device
will be connected
to
achieve azero length, zero loss transmission line). The usual
standard
for reflection
measurements
is
a
short
circuit
at
the measurement plane (connect the short circuit
at
the point
at
which the
test device will be connected). Thus, calibration establishes the magnitude
and
phase response
of
the test
setup
to
aknown value. All cables, adapters etc. used in calibration must also be used in measurement
or
the calibration will
not
be exact.
Connect calibration standard
Set REFERENCE switch
to
-00
Depress OFFSET
button
Adjust OFFSET vernier
to
position trace
at
reference position
Magnitude ratio calibration eliminates any offset caused by unequal losses between the reference
and
test
signal paths
to
establish a 0 dB reference from which test device response can be measured. Magnitude
ratio calibration?is accomplished by connecting the
standard,
setting the
REFERENCE
display
to
00, then
using the
OFFSET
vernier
to
move the trace
to
the reference position line. When the
OFFSET
button
is
depressed the offset determined by the vernier
is
applied to the measurement; when the
button
is
released,
the offset
is
not
applied
to
the measurement.
Front
Panel Introduction
Measurement Calibration
When measuring
A,
B,
or
Rabsolute power in dBm, simply release the OFFSET
button
to
disengage
the
vernier.
Since the network analyzer displays the difference between its inputs in
dB
or
degrees, any unequal losses between between
the
A,
B,
and Rsignal paths
will cause avalue
to
be displayed which
is
different from the characteristics
of
the
network
being measured. Hence,
the
system must first be calibrated
to
astandard with known response characteristics. Measurements on atest
device are then made relative
to
the calibration standard.
If
the calibration trace has frequency response errors,
they
must be accounted for. Using
the
OFFSET
vernier, move a
point
on the trace
to
the
reference position line. Then, using agrease pencil, write
the
trace
onto
the CRT. (Remove
the
blue filter
to
reduce parallax.) An alternate
method
is
to
use
the
8750A
Storage Normalizer
to
store
the
calibration trace in memory and automatically subtract
it
from the mea-
surement,
as
described later.
The general sequence for magnitude and phase calibration
is
as
follows:
Artisan Technology Group - Quality Instrumentation ... Guaranteed | (888) 88-SOURCE | www.artisantg.com

Model
8754A
Electrical Length Compensation
Front
Panel
Introduction
Phase calibration requires equal electrical lengths in the reference and test signal paths. The electrical
length
is
equal when the phase angle
is
constant over the frequency sweep with the standard connected.
For
fine adjustment
of
electrical length
two
independent controls, PHASE
B/R
LENGTH for
the
trans-
mitted signal
path
and POLAR
A/R
LENGTH for the reflected signal path, provide up
to
16 centimeters
of
intemalline
length equalization adjustment. Beyond this limit the reference and test signal
path
cables
must be selected
to
obtain equal electrical lengths.
Reference Reference
-90
Constant phase response
is
identified
by
aflat trace for arectangular display
or
asmall cluster for apolar
display.
If
the
phase angle becomes more negative with increasing frequency, then
the
test signal
path
is
longer
than
the
reference signal path. Therefore, length
must
be added
to
the
R-input signal
path
if
the
range
of
the front-panel LENGTH controls
is
insufficient.
If
the
phase angle becomes more positive with
increased frequency
then
length must be added
to
the
A
or
B
input
signal path.
When making reflection
or
transmission measurements using
the
8502
or
8748
test set,
the
usual test setup
uses R
input
as
the
incident signal, A
input
as
the
reflected signal, and B
input
as
the
transmitted signal.
With this setup, first adjust
the
Aand Rlengths
to
equalize
the
POLAR
A/R
display when calibrating
reflection coefficient (open
or
short). Then adjust
the
Blength
to
equalize
the
PHASE
B/R
display when
calibrating transmission (through).
15
Artisan Technology Group - Quality Instrumentation ... Guaranteed | (888) 88-SOURCE | www.artisantg.com
Table of contents
Other HP Measuring Instrument manuals
Popular Measuring Instrument manuals by other brands

LaserLiner
LaserLiner CableTracer Pro operating instructions

VOLTCRAFT
VOLTCRAFT VC-533 AC/DC operating instructions

Benning
Benning CM 9-2 operating manual

UEi
UEi DL479 instruction manual

GeoMax
GeoMax Zipp02 user manual

Swan Analytical Instruments
Swan Analytical Instruments AMI INSPECTOR Resistivity Operator's manual

FCI
FCI PETROSENSE PHA-100Plus Training guide

Agilent Technologies
Agilent Technologies E8356A Configuration guide

ProMinent
ProMinent DULCOMETER DMT Series operating instructions

Arcom Digital
Arcom Digital Quiver XT user guide

Conlog
Conlog BEC23 Technical manual

Tektronix
Tektronix Keithley 2182A quick start guide