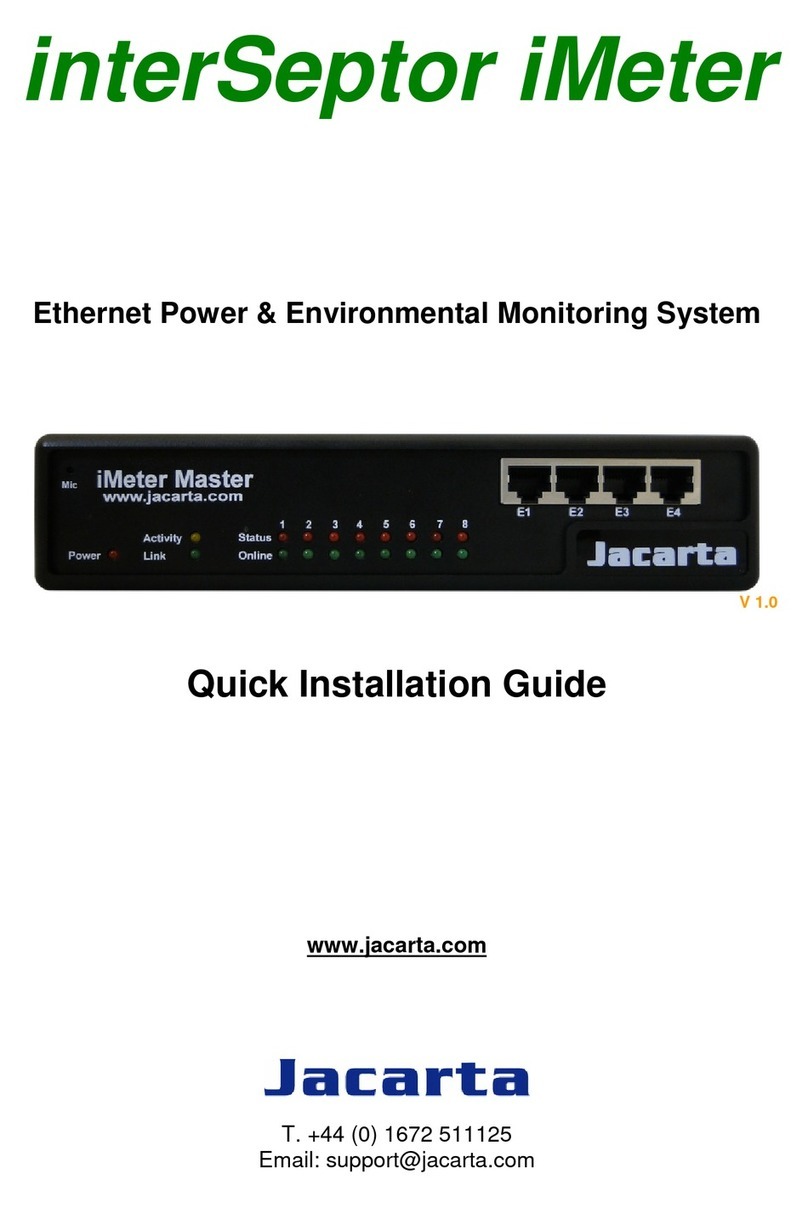
jacarta iMeter Master User manual

iMeter

iMeter
All trademarks belong to their respective proprietors.
Electronic Emission Notice
Federal Communications Commission
This equipment has been tested and found to comply with the limits for a Class B digital
device, pursuant to Part 15 of the FCC Rules. These limits are designed to provide
reasonable protection against harmful interference when the equipment is operated in a
commercial environment.
CE Mark
This device complies with the EMC directive of the European Community and meets or
exceeds the following technical standard:
•EN 55022:1998 ⎯”Limits and Methods of Measurement of Radio interference
Characteristics of information Technology Equipment.” This device complies with the
CISPR Class B standard
•EN 55024:1998 ⎯”Electromagnetic compatibility⎯Generic immunity standard Part1:
Residential, and light industry.”
RoHS
This device is RoHS compliant.
WEEE
In accordance with the European Directive 2002/96/EC on Waste Electrical and Electronic
Equipment (WEEE) Jacarta will arrange for the appropriate disposal of the product (upon
return of the product at the end of its serviceable life).
Safety Information
•To reduce the risk of fire or electric shock, install the unit indoors in an area free of
conductive contaminants. Do not place the unit near liquids.
•Do not allow liquids or foreign objects to enter the unit
•The unit does not contain any user-serviceable parts. Please do not open the unit.
•Before shipment, the unit must be completely switched off and unplugged and all
connections must be removed.
•Before connecting the power adapter to mains input supply and the iMeter, please make
sure the rating of the power source conforms with the required rating of the power adapter
of the iMeter.

iMeter
Table of Contents
Electronic Emission Notice
3
Safety Information
3
Table of Contents
4
1 - Presentation
5
1.1 Introduction
5
1.2 How to use this manual
5
1.3 Package contents
5
1.4 Front and rear panels
7
2 - Installation
8
2.1 Setting the IP address
8
2.2 Testing the IP address
8
2.3 Firmware upgrade
10
2.4 Setting up a sensor
18
2.5 Expansion ports
19
3 - Notifications
26
3.1 Adding a notification
26
3.2 SNMP Trap
27
3.3 Email
30
3.4 SMS
30
4 - Mapping
35
4.1 Adding a map
35
4.2 Monitoring via map interface
37
5 - Filters
39
5.1 Sensor filters
39
5.2 Syslog filters
39
6 - FAQ
43

iMeter
1. Presentation
1.1 Introduction
The iMeter is an IT power and environmental monitoring device that provides remote
monitoring of current (amps), voltage, temperature, humidity, and other environmental
conditions via a standard web browser or network management system.
1.2 How to use this manual
This manual is meant to provide a step by step guide on how to configure and set up
an iMeter unit. It utilizes screen shots in an effort to make things simpler for the user
to follow. It is split up into sections that form “mini tutorials”. These cover the basic set
up and common configurations of the unit, and give an introduction to its most useful
features.
At the end of the manual there is a FAQ section that provides some further in-depth
information regarding specific set ups and answers some commonly asked questions.
If you need any further information or help with using your unit then please contact us
and one of our technical support staff will be only too pleased to help you with any
information you require.
1.3 Package Contents
The iMeter Master package contains the following items:-
•1x Product CD
•1x 5ft Crossover cable
•1x 7.5, 3A power supply
•2x Brackets for rack mounting
1.4 Front and rear panels
Fig 1. Front panel
The front panel has several LEDs which display the units status and notify you as to its
activity.
1. Power LED
When the unit is powered up the power LED will be lit continuously. If the power
LED is flashing then it indicates a problem with the CPU.
2. Ethernet LED
The Activity and Link LEDs indicate network connectivity and activity. The Link
LED will light up when there is a network connection present. The activity LED
will flash when there is network traffic being sent or received by the unit.

iMeter
3. Status / Online LEDs
These are numbered 1 –8. They are used to indicate the connectivity status of
the sensors connected to each port. These LEDs also can be used to indicate
system status when undertaking various operations.
•The LEDs will indicate the progress of an upgrade. The red LEDs will
move from left to right to indicate activity, and the green LEDs will
indicate overall progress of the upgrade. When all the red lights are off
and all green are on the upgrade / recovery process is complete.
•These lights will indicate if the unit is operating in safe mode. This is
when the unit loads the Operating System (OS) with a minimal set of
drivers. If your device enters safe mode after rebooting then please
•The unit may enter recovery mode if a firmware upgrade has been
incomplete. This will be indicated by the unit displaying a continuously lit
4. Mic
The mic is a small hole for access to the internal microphone. This can be used
as a sound sensor (or an external mic can be used).
5. Expansion Ports
There are four expansion ports numbered from E1 –E4. These are expansion
ports for connecting either the iMeter Slave 8x port expansion or the iMeter DC16
16x dry contact expansion modules.
Fig 2. Rear panel.
The rear panel of the unit is home to various ports and connections. The functions of these
are as follows :-
1. Reset button.
The black tact switch button is used to perform the following functions
•Turns off password checking when accessing the web based
interface (hold down for 7 seconds)
2. External GND.
This is for connecting an external ground to the unit.
3. Sensor ports
There are 8 RJ45 ports numbered from 1 –8. These are for connecting the
sensors to the unit.

iMeter
4. USB port
The unit is equipped with a single USB 1.1 port. This can be used, for example, to
connect a USB GPRS/GSM compatible modem.
5. Mic Out
This is used to connect an external microphone for voice modem applications.
6. Audio in / out
The in is used to connect an external microphone, the output for external
speakers.
7. RS485 Port
Used for Modbus connectivity. The iMeter supports Modbus master or slave.
8. Power Connector
This is a 7.5V DC plug. We recommend you using a 7.0 –9 V, 3A power supply.
9. Ethernet Port
This RJ45 port is used to connect the iMeter to the network.

iMeter
2. Installation
2.1 Setting up the IP address
Every unit is shipped with the default IP address of 192.168.0.100. First we will go
through the process of changing this IP address to fit another network configuration.
Ensure the following items are available before starting:-
•RJ45 CAT5 crossover cable with RJ45 male connection
•A PC with Ethernet card or LAN socket.
•Power socket for the unit to connect to
a) Connect the unit via the Ethernet port of the unit to the computers LAN or
Ethernet port with a CAT5 crossover cable.
b) Set a static TCP/IP details on the computer of;
oIP address: 192.168.0.1
oSubnet Mask: 255.255.255.0
oDefault Gateway 192.168.0.1
c) Open a web browser and type the default IP address in to the address bar, hit
enter.

iMeter
d) You will now be presented with the following screen.
e) Click on “Ethernet network” from the list on the left frame of the page.
Don’t forget to set the subnet mask, default gateway and domain name server if
DHCP is not used. The unit ships with DHCP disabled. If DHCP is required to obtain
the IP address then select ‘Yes’ against the Use DHCP option and click Save.

iMeter
2.2 Testing the new IP address with the “ping” command
Once you have assigned the new IP address either connect the device to the local
area network, or change the PC IP address so that it can route to the new IP address.
Once this is done use the “ping” command to test the unit. This can also be used as a
diagnostic tool in order to check whether your unit is connected to the network.
After hitting “enter” you will get an MS DOS prompt window that will show the test
results (as below). If unsuccessful you will get a message saying “request timed out”.
This indicates either an incorrect IP address or a unit that is not connected to the
network.
Table of contents
Other jacarta Measuring Instrument manuals

