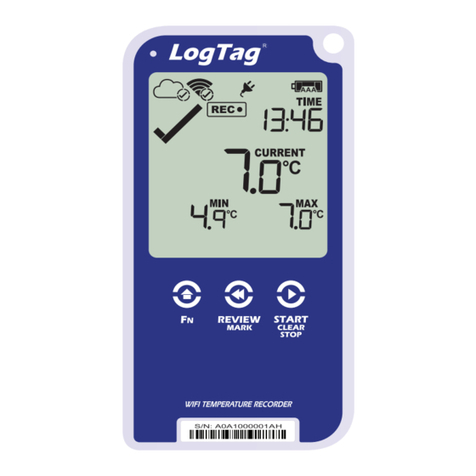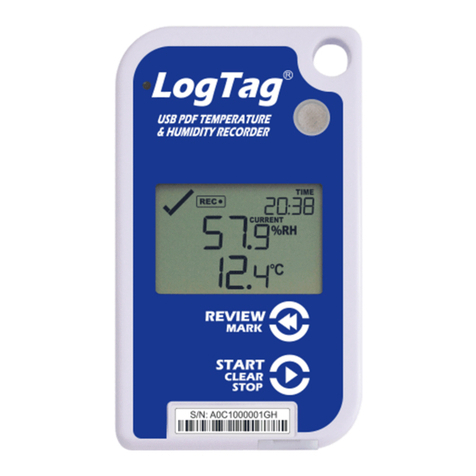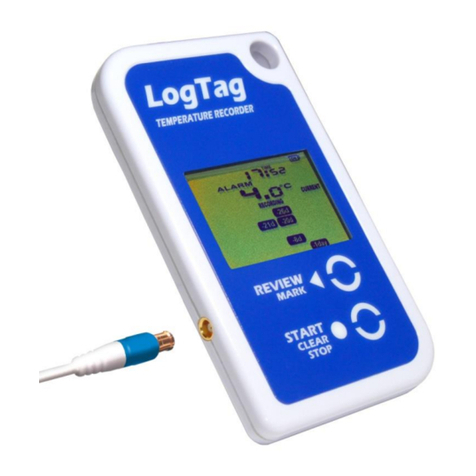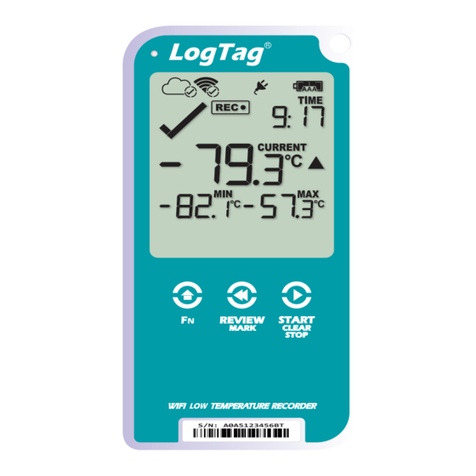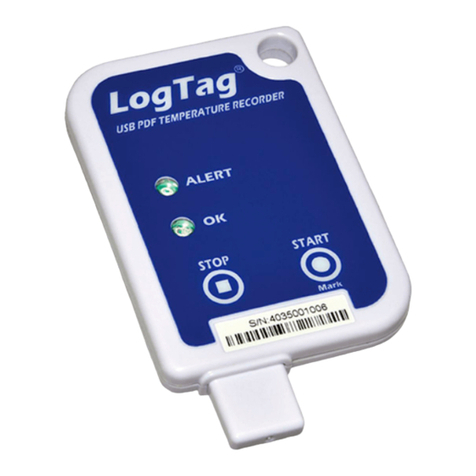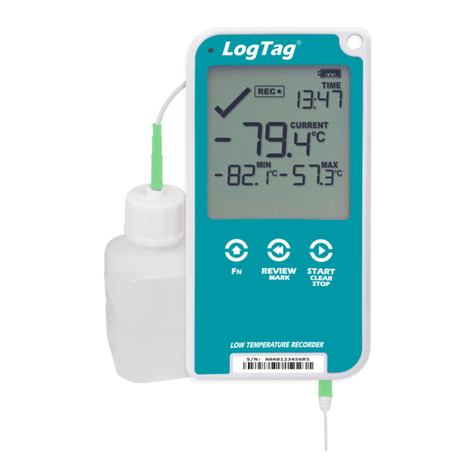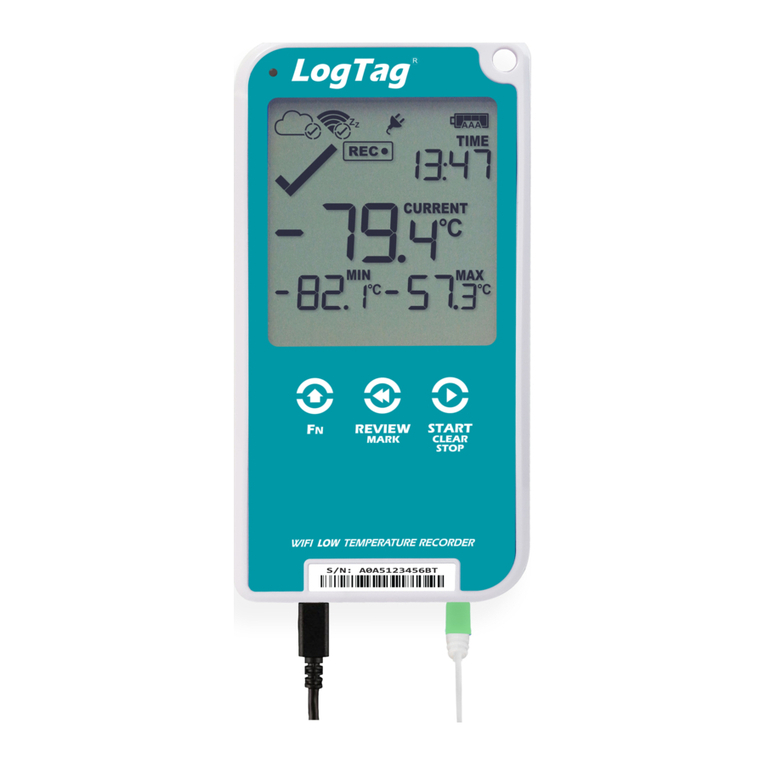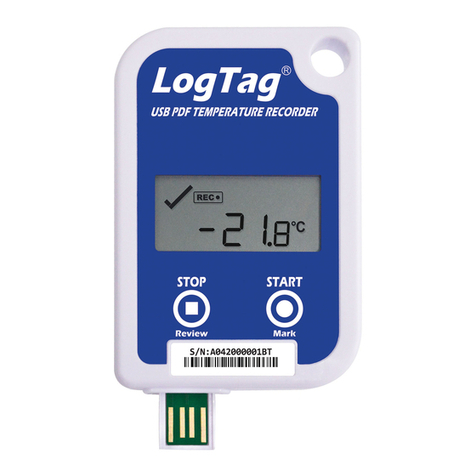
Document Revision F, 20160812 - © Copyright 2017, LogTag Records Ltd. LogTag® is a registered trade mark of LogTag Recorders Ltd.
LogTag Recorders reserves the right to change this specication without notice.
startIng the logger
If the Logger has been congured with a Date/Time start,
it will start automatically.
Only when the display shows READY can the Logger be started manually. Press
and hold the START button. Continue to hold while
STARTING ashes on the display; release the button
when the ashing stops (after approx 5 seconds).
e Logger will now display the delayed start time
remaining (if congured). is example shows a start
delay of 30 minutes remaining.
At the end of the delayed start (if congured) the
Logger will start collecting data and show the symbol
on the display.
paused functIon
If enabled, any button activity will suspend processing of readings and the Logger
will display PAUSED. is allows the user to review the statistics or clear an alarm
without causing an invalid reading, alarm or statistic.
settIng the dIsplay clock
LogTag Analyzer sets the Loggers internal real time clock to the conguration
PC’s time however the user can manually change the display clock if required.
Press and hold the and buttons together continuously for 8 seconds. During
this period the display will ash CLOCK ADJ. Release the buttons when the
ashing stops to enter ‘clock adjust’ mode.
e minutes will ash. Press to increment the minutes and
to accept the minute changes and to start editing the hours.
e hours will now ash, press to increment the hours and
to accept and store the new time. If recording is active a clock change event
will be recorded with the next logged reading, which will be displayed in the
downloaded data.
recordIng dIsplay
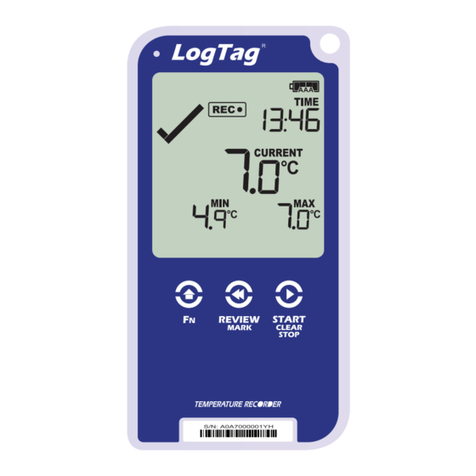
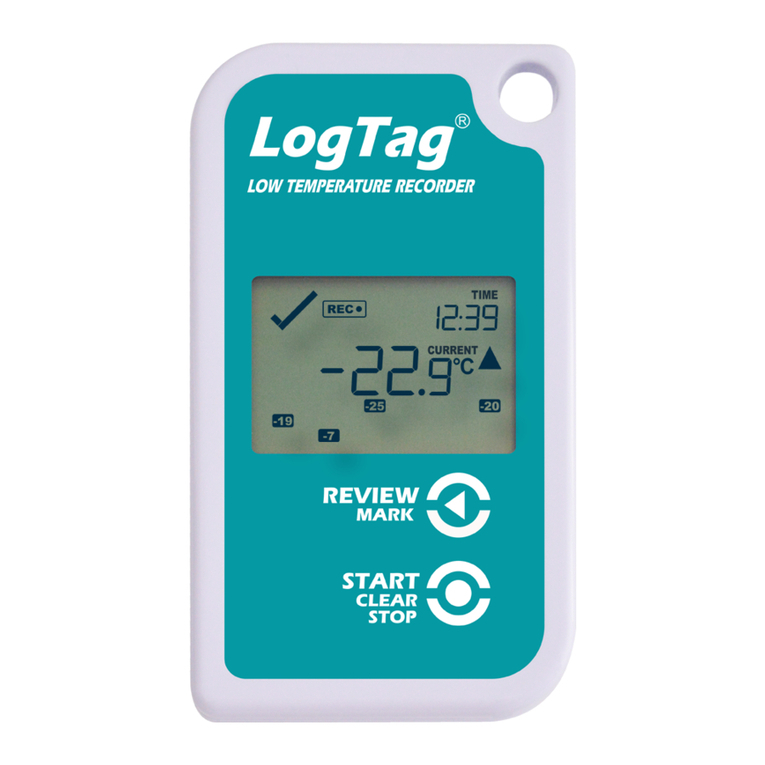
During recording, the display shows the temperature of the last reading taken,
the current time, battery status and a combination of alarm status and history. A
reading is taken and the display updated every logging interval as congured in
LogTag Analyzer. Following are some examples:-
Here the display shows that alarm events occurred 7, 19,
20 and 25 days ago. e current temperature is over the
upper limit (indicated by the
) but has not been over
for long enough to trigger an alarm.
20 minutes later the over temperature has triggered an
alarm. e symbol and the marker day alarm are
shown.
e next day, the temperature has returned to the
acceptable range but the alarm remains present.
e day summary has shifted by 1 day as the time has
gone through midnight.
clearIng an alarm
When an alarm event has occurred, the symbol is displayed.
To clear the symbol from the display, press and hold the Clear button until
the symbol stops ashing then immediately release.
Alarm events continue to be displayed in the history area of the display and can be
reviewed with the day statistics.
Note: e option to clear and latch alarms can be disabled see advanced options
in LogTag® Analyzer.
revIeWIng day statIstIcs
e Logger will display up to 30 days of max/min/duration and alarm statistics. If
the Logger is congured to record longer than 30 days (or continuously) then the
day statistics will contain up to the latest 30 days.
To review the day statistics press the Review button. Each press of the button
will step through the Max and Min temperatures for each day starting with today
and moving backwards through the days (displayed day will ash).
Any button activity during recording will place an inspection mark in the next
reading of logged data which will be displayed when the data is downloaded.
Following are some examples:-
Pressing the Review button displays current days‘
MAX statistic.e today segment ashes and DAY 00
is shown to indicate the ‘Today’ selection. e
selected day (today) does not have any recordings
outside the preset limits.
Pressing the Review button again displays the
days‘ MIN statistic.
e MIN statistic is not below the limit and did not
trigger an alarm.
Pressing the Review button again displays the next
previous days‘ MAX statistic. ere are recordings that
are above the upper limit. e MAX statistic is above
the upper limit (indicated by
) and the ALARM was
triggered for a duration of 12 hours and 30 minutes.
Pressing the Review button again displays the
days‘ MIN statistic.
e MIN statistic is not below the limit and did not
trigger an alarm.
If less than 30 day‘s of recordings have been collected, the day marker only
advances as far as there is data available. After the last day for which statistics have
been collected is displayed, the next press of the button rolls the summary back
to the statistic for today . Pressing the button at any time shows the normal
recording display again.
stoppIng the logger
If enabled you can stop the Logger; press and hold the Stop button.
Continue to hold while STOPPED ashes on the display; release the button when
the ashing stops. e Logger will no longer take any readings, however you can
still review the day statistics and download the logged results to a PC with
LogTag® Analyzer.
Note: e option to stop the Logger can be disabled, see advanced options in
LogTag® Analyzer.
re-actIvatIng the logger
If enabled, the Logger can be re-activated for re-use by either re- conguring using
LogTag® Analyzer or using the Start button.
To re-activate using the Start button, press and hold the Start button
observing the READY text ashing on the display; release the button when the
ashing stops. e Logger will then be ready for a push button start. Data/time
start is only possible by re-conguring with LogTag® Analyzer.
Re-activating the Logger will erase all previously recorded readings and statistics!
Note: e option to re-activate the Logger can be disabled, see advanced options
in LogTag® Analyzer.
battery
e Logger contains a Lithium Battery. Dispose or recycle the battery
in accordance to your local regulations. Do not expose to extreme
temperatures.
e end of battery life is indicated by a low battery symbol, the
Battery/ Logger should be replaced within 30 days when this symbol appears.
e TRID30-16R has a replaceable CR2032 battery. Battery access sits behind
the square white label on the back of the Loggers case. Contact your supplier or
check the LogTag Recorders website for further details.
doWnloadIng data
• Start LogTag® Analyzer software.
• Insert the Logger into the Interface Cradle.
• e screen will show ‘A new LogTag has been detected..... Please wait.....‘.
• After a few seconds, the downloaded data will appear (by default shown as a
chart, see below).
• Data can be displayed in Chart, Data, Summary or Day Summary formats by
clicking the tabs at the bottom of the chart dialog.
• Data can also be saved in a number of formats including TXT, PDF, HTML
and CSV for import into a spreadsheet program.
gettIng help
If after reading this guide you still need further information, please visit the
LogTag Recorders website.
For support visit https://www.logtag-recorders.com/support.
Example of a Zoomed in chart within LogTag Analyzer.
