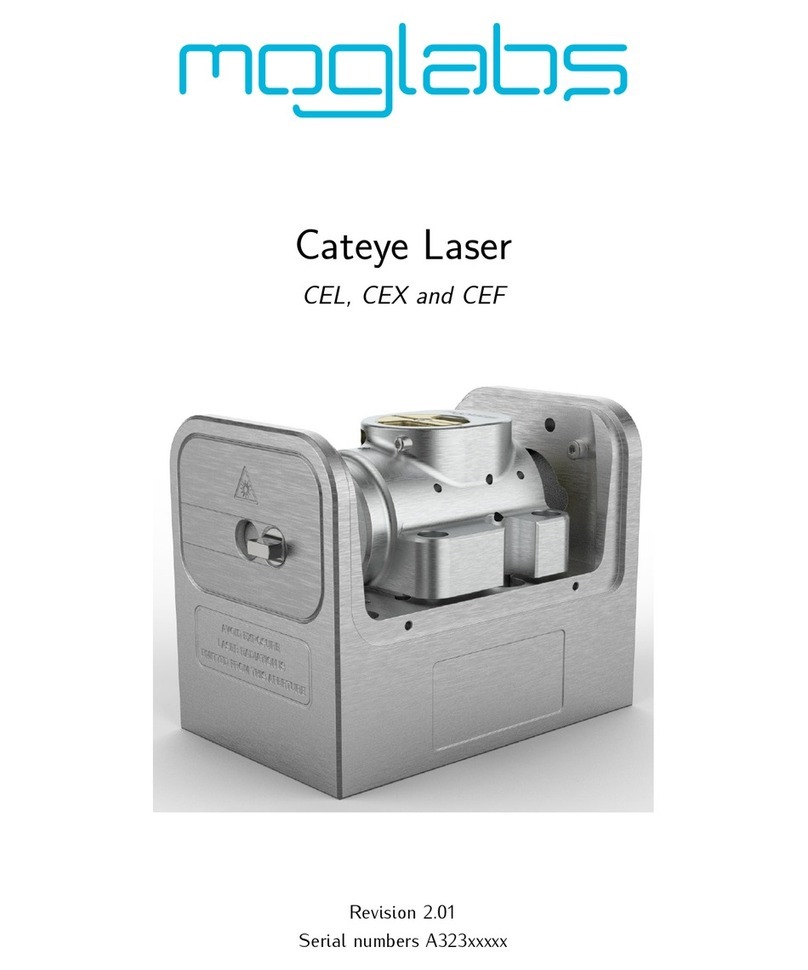
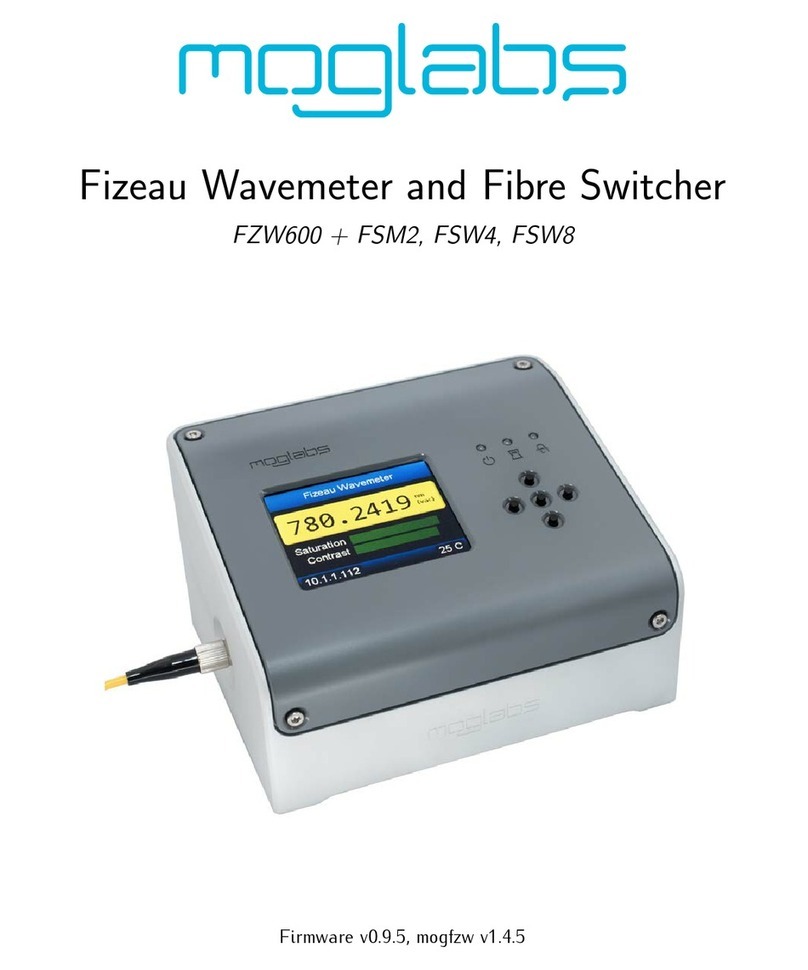
MOGlabs FZW600 User manual

Fizeau Wavemeter
FZW600
Version0.1.2,Rev2hardware

Limitation of Liability
MOGLaboratoriesPtyLtd(MOGLabs)doesnotassumeanyliabi-
lity arising out of the use of the information contained within this
manual. This document may contain or reference information and
products protected by copyrights or patents and does not convey
any license under the patent rights of MOGLabs, nor the rights of
others. MOGLabs will not be liable for any defect in hardware or
softwareorlossorinadequacyofdataofanykind,orforanydirect,
indirect, incidental, or consequential damages in connections with
orarisingoutoftheperformanceoruseofanyofitsproducts. The
foregoing limitation of liability shall be equally applicable to any
serviceprovidedbyMOGLabs.
Copyright
Copyright c
MOGLaboratoriesPtyLtd(MOGLabs)2017–2020.
Nopartofthispublicationmaybereproduced,storedinaretrieval
system, or transmitted, in any form or by any means, electronic,
mechanical, photocopying or otherwise, without the prior written
permissionofMOGLabs.
Contact
Forfurtherinformation,pleasecontact:
MOGLaboratoriesP/L
49UniversitySt
CarltonVIC3053
AUSTRALIA
+61399390677
MOGLabsUSALLC
41914thSt
HuntingdonPA16652
USA
+18142514363
www.moglabs.com

Contents
Getting started iii
1 Introduction 1
1.1 Howitworks....................... 1
1.2 Features.......................... 2
2 Connections and controls 3
2.1 Frontpanelinterface . . . . . . . . . . . . . . . . . . . 3
2.2 Rearpanelcontrolsandconnections. . . . . . . . . . 6
3 User interface 7
3.1 On-boardUI........................ 7
3.2 WebUI........................... 8
3.3 SoftwareUI........................ 9
4 Operation 15
4.1 Fringeidentificationandoptimisation . . . . . . . . . 15
4.2 Auto-exposurealgorithm. . . . . . . . . . . . . . . . . 18
4.3 Wideandfastmodes . . . . . . . . . . . . . . . . . . . 18
4.4 Pulsedlasermeasurement. . . . . . . . . . . . . . . . 19
4.5 Externallytriggeredmode. . . . . . . . . . . . . . . . 19
4.6 Measurementaveraging . . . . . . . . . . . . . . . . . 20
4.7 PIDcontrol........................ 21
4.8 Calibrationadjustment . . . . . . . . . . . . . . . . . . 22
5 Optical switcher 25
5.1 Overview.......................... 25
5.2 Operation......................... 26
5.3 SoftwareUI........................ 26
i

ii Contents
5.4 SimultaneousPID . . . . . . . . . . . . . . . . . . . . 26
A Specifications 27
B Firmware updates 31
C Command language 33
C.1 Generalfunctions . . . . . . . . . . . . . . . . . . . . . 33
C.2 Displaysettings . . . . . . . . . . . . . . . . . . . . . 34
C.3 Measurementsettings . . . . . . . . . . . . . . . . . . 34
C.4 Camerasettings...................... 35
C.5 Opticalswitch....................... 36
C.6 PIDcontrol........................ 37
D Communications 39
D.1Protocol.......................... 39
D.2TCP/IP........................... 39
D.3USB............................ 41
E Dimensions 43

Getting started
1. Connect to +5 V power viatheUSBportortheDCbarreljack.
When powering with USB, it is important that the host can
supplyupto600mA.Someoldercomputersmaydetectthisas
ashort-circuitandpowerdownthedevice;USB-3.0compliant
hubsarerecommended.
2. Power on usingtherockerswitchontherear.
3. Connect fibre using the supplied fibre patchcord. Typically
this is FC/PC (black) on one end and FC/APC (green) on the
other. TheFC/PC sidemustbeconnectedtotheFZW.
IfthedevicewasorderedwiththeFC/APCoption(asindicated
onthechassis),thesuppliedfiberisFC/APC onbothendsand
eitherendcanbeconnectedtotheFZW input.
Single-modefibresarestronglypreferred,althoughsmall-core
multi-modefibres(upto62.5µm)canbeusedattheexpense
ofreducedaccuracy.1
4. Input light withthesuppliedfree-spacetofibreadapter. Typi-
callytheFZWonlyneedsafewmicrowattstooperate,sohigh
couplingefficiencyisnotrequired. Thesaturation (Figure1)
isameasureofthepowerreachingthedetector
Theauto-exposurealgorithmtunestheexposuretimetomatch
theinputpowerandoptimisethemeasurementrate. Insome
casesitmaybepreferabletosettheexposuretimemanually,
suchaswhenperformingmaintenanceonthesourcelaserand
thelaseroutputpowertendstofluctuaterapidly.
That’sit: withacoupledfiberyoushouldbeabletoreadthewa-
velength within two seconds of power-on. It is recommended to
1Absoluteaccuracyspecificationsareonlyvalidwhenusingsingle-modefibres.
iii

iv Getting started
Figure 1: Both the built-in wavemeter display (left) and host software
(right) provide saturation indicators that measure the optical power rea-
chingthedetector.
periodically inspect the measured interference fringes for correct
structure(§4.1)toensurereliablemeasurement.
TypicallytheFZW willreachthermalequilibriumandfullaccuracy
within15minutesofbeingturnedon. Themostaccurateresultswill
beobtainedinawell-stabilisedlabenvironment. Itisrecommended
thattheFZWnotbeinthermalcontactwithanyotherequipmentto
preventformationofthermalgradients.
Host connection
TherecommendedmodeofoperationisusingtheWindowsTM host
application (chapter 3) which provides a simple interface for con-
trollingdevicefunctionality. Instructionsforconnectingviaethernet
andUSB areprovidedinAppendixD.

1. Introduction
1.1 How it works
TheFZWisahigh-precisiondevicethatmeasureslaserwavelengths
using a set of Fizeau interferometers. A Fizeau interferometer is
formed by two planar surfaces with a small wedge angle between
them,whichgeneratesspatially-varyinginterferencefringesasthe
opticalpathlengthchanges(Fig.1.1). Boththefringespacingand
phase of the resulting interference pattern are related to the wa-
velength of the incident light, so analysing their structure allows
precisedeterminationofthelaserwavelength.
Figure 1.1: CollimatedmonochromaticlaserlightandFizeauetalonscre-
ateinterferencepatternsonanimagingdetector. Thewavelengthiscalcu-
latedbycombiningmeasurementsofthefringesfromfourdifferentetalons.
A rough estimate of the wavelength is obtained directly from the
fringe spacing, to an absolute accuracy of one part in 100. This
initialestimateisthenimprovedbythephaseofthefringepattern.
Multipleetalonswithdifferentfree-spectralranges(FSRs)areused
to refine the wavelength measurement without sacrificing absolute
accuracy. TheMOGLabsFZWusesfoursuchstages,withtheFSRof
thefinaletalon being7.5GHz. Thisenablesthe wavelengthtobe
determinedtoanabsoluteaccuracyofonepartin107.
1

2Chapter 1. Introduction
1.2 Features
The MOGLabs FZW has no moving parts, and very high sensitivity
semiconductor imaging, enabling high measurement speed (up to
350persecond)andmeasurementofpulsedsourceswithonlyafew
microwattsoflight.
Longlifetimeisassuredastherearenomechanicalpartstowearout.
Theetalonsareoptically-contactedfusedsilica,withalowthermal
expansioncoefficient,makingtheinstrumentincrediblyrobust,reli-
able, and stable. High precisionMEMS-based sensors areusedto
make small corrections for environmental variations. Recalibration
isnotrequiredtomaintainthestatedaccuracy;infact,theFZW is
morestablethantheneonlampusedinsomeotherwavemetersas
acalibrationsource.
TheFZW alsointegratesamodern32-bitmicroprocessorandhigh-
resolutioncompactcolourdisplay. Wavelengthcalculationisperfor-
medautomaticallyonthedevicesothatnohostcomputerisrequired.
ItiscompactandcanbepoweredfromUSB orevenarechargeable
battery,soyoucanmoveitaroundyourlabandmeasurewavelength
rightwhereyouareadjustingyourlaser.
Fast ethernet and USB communications combined with a sophisti-
cated software suite enable display on your lab computer or your
smartphone. MultipleFZW devicescanbeeasilyrun fromasingle
computer, and integration with common data acquisition systems
issimpleusingtext-basedcommandsoverstandardprotocols,with
simplebindingstoLabVIEW,MATLAB,andpython provided. PIDfre-
quency feedback locking is also included with every device, also
withoutrequiringahostcomputer.

2. Connections and controls
2.1 Front panel interface
The FZW front panel (Figure 2.1) includes an interactive colour
screenwithpush-buttoninterface,andanumberofstatusindicator
lights. This allows autonomous usage of the wavemeter indepen-
dentlyofacomputer.
Figure 2.1: MOGLabsFZW frontpanellayout.
Thebuttonsarearrangedasa“directionalpad”withup,down,left
and right buttons, and an additional OK button in the centre. In
wavelengthdisplaymode,theup/downbuttonschangethedisplay
units, and the left/right buttons swap between different diagnostic
modes(see§3.1). PressingOK opensthemenusystem.
The display includes a sleep mode which reduces the brightness
whennotinuse. Wherethisfeatureisundesirableitcanbedisabled
bysettingthesleeptimetozerointhemenusystem.
3

4Chapter 2. Connections and controls
TheLED indicatorsdisplaythecurrentstateofthedevice,aslisted
inthetablebelow.
Indicator Colour Status
PWR ÊOff Unitispoweredoff
Green Normaloperation
Blue Firmwareupdatemode
ERR ! Off Nomeasurementinprogress
Green Normaloperation
Yellow Measurementerror
Red Criticaldeviceerror
LOCK Off PID/analogoutputdisabled
Green PIDlocked
Yellow PIDengagedbutnotlocked
Red PIDoutputsaturated
Blue Analogoutputerror
2.1.1 Menu system
Themenusystemallowsforinteractivecontrolofthedevicewithout
acomputerinterface(Figure2.2). ItisstartedbypressingtheOK
buttonfromthemeasurementdisplaymode,andexitingbypressing
theleftdirectionalbutton.
Figure 2.2: Primary settings menu, showing measurement options (left)
anddevicesettings(right)whichincludesdisplaysettings.

2.1 Front panel interface 5
Within the menu system, the up and down buttons control the se-
lecteditem. PressingOK onaselecteditemactivatesittoallows
editingthevalue,enteringthesubmenu,orexecutingthecommand.
Pressing the left button returns to the previous menu, or exits the
menusystem.
When a value is selected for editing, a digit will be highlighted.
Usingtheup/downkeysmodifiesthisdigit,andusingtheleft/right
keyschangeswhichdigitisselected. PressingOK againexitsedi-
tingmode.
Inparticular,itisusefulforconfiguringtheEthernetsettingsinan
networkingenvironmentwhereDHCP isdisallowed(Figure2.3). In
this situation, an appropriate static IP should be allocated to the
unit,thegatewaysetasrequiredbythenetworkconfiguration,and
DHCP settoOFF.
Figure 2.3: The Ethernet settings menu provides control of connection
settings (left), including DHCP and static addresses. Any changes only
takeeffectoncetheEthernetcontrollerisrestarted(right).

6Chapter 2. Connections and controls
2.2 Rear panel controls and connections
Figure 2.4: MOGLabsFZW Rev3rearpanellayout.
Fromlefttoright,thefeaturesoftherearpanel(Figure2.4)are:
Power switch Switchestheuniton/off.
DC supply 2.1mmcentre-positivebarrel-jackconnectorforsupplyingpowerthe
unit. NotrequiredifpowerissuppliedoverUSB.Useofafloating
(unearthed)“plugpack”powersupplyisnotrecommended.
USB StandardUSBtype-Bconnectorforpoweringand/orcommunicating
withthedevice. Whenusedtopowerthedevice,mustbeconnected
toaUSBportcapableofsupplying600mA.
Ethernet RJ-45 jack for 10/100 MB/s TCP/IP communications, which is the
recommendedinterfaceforcomputercontrolandmonitoring.
SMA output AnalogoutputportforwavelengthmonitoringorPIDcontroloflaser
wavelength(see§4.7). 16-bitresolutionwith±2.5Voutputrange.
TRIG input Active-lowTTLinputforsynchronisingthewavemetermeasurement
toanexternaltrigger(see§4.5).
Shutter control M8connectorforinterfacingwiththeFSW4/FSW8multi-channelop-
ticalswitcher(seechapter5).

3. User interface
3.1 On-board UI
TheFZWincludesanintegrateduserinterfaceforoperatingthewa-
vemeter independently of a host computer. The primary display
showsthecurrentlymeasuredwavelength(Figure3.1)inunitsthat
canbeselectedviatheup/downbuttons.
Figure 3.1: Primary wavelength display showing the measured wave-
length,saturationandcontrast,aswellasthedeviceIPaddress.
Thesaturation isameasureoftheopticalpowerreachingthede-
tector, and the contrast isa measure of fringe quality. In general,
higher saturation is preferred as this permits faster measurement,
however oversaturation (as indicated by the bar turning red) will
degrademeasurementaccuracy.
Pressingtheleft/rightbuttonschangestoanalternatedisplaymode
(Figure3.2),permittingdiagnosticofthefringepatternasexplained
in§4.1,aswellasdisplayingarudimentarytime-seriesofvariations
in the measured wavelength over time. Pressing the central OK
buttonopensthemenusystem(see§2.1.1).
7

8Chapter 3. User interface
Figure 3.2: Diagnostic modes of the FZW on-board UI: etalon display
(left)permitsverification offringequality, andtime-seriesdisplay(right)
showsvariationinthemeasuredwavelengthovertime.
3.2 Web UI
The FZW includesasimplewebinterfaceformonitoringthedevice
remotelythroughawebbrowser,suchasusingasmartphone. Na-
vigating to the device IP address displays the currently recorded
wavelength,whichisautomaticallyupdated(Figure3.3). Atpresent
thisinterfacedoesn’tprovidecontroloptions,butincreasedfunctio-
nalitywillbeprovidedinfuturefirmwareupdates.
Figure 3.3: Demonstrationoftheintegratedwebinterfaceshowingmea-
suredwavelengthandsaturation(representedbythecolouredbar).

3.3 Software UI 9
Inenvironmentswhereembeddeddevicesrunningwebserverscon-
stituteasecurityconcern,thewebinterfacecanbedisabledusing
thecommandETH,WEB,0 orthroughtheMenuSystembyselecting
Options→Ethernet→Webserver→OFF.
3.3 Software UI
Afully-featuredcontrolanddiagnosticprogramsuiteforWindowsTM
operatingsystemsisavailablefromtheMOGLabswebsite.
Figure 3.4: Demonstrationofthe host softwareinterface, showingexpo-
surecontrols(1),convergencemonitor(2),interferencefringes(3),measu-
redwavelength(4), display units selector(5),anddevicediagnostics (6).
Thefontsizeofthemeasuredwavelengthcanbeenlargedbydraggingthe
splitterbarvertically.

10 Chapter 3. User interface
Most of the user interface is dedicated to displaying the etalon
fringes,whichareimportantformeasurementdiagnostics(see§4.1).
Thewavelengthdisplayboxhasselectableunits,andcanberesized
toincreasethefontsizeandmakethemeasurementeasiertoread
fromadistance.
The exposure controls on the left-hand side include a scale bar
showingtheopticalsaturation. Boththeexposuretimeandcamera
gaincanbemanuallyadjusted,althoughinmostscenariostheauto-
exposurealgorithmwilloptimisethesevalues.
Theconvergence monitor onthelower-leftindicateshowstablethe
iterative measurement is. In most situations the bars should re-
main below the dotted line, indicating that the iterative algorithm
isconvergingreliably. Insituations where the laserwavelengthis
changing rapidly, or the calibration has been perturbed, the bars
mayexceedtheindicatedregionindicatingthereliabilityoftheme-
asuredvalueisreduced.
3.3.1 Time-series measurement
Clicking the Time-series button on the lower-left of the window
bringsupadialogthatshowshowthemeasuredwavelengthischan-
ging over time (Figure 3.5). This can be beneficial for measuring
long-termdriftsinlaserwavelength,suchasdiagnosinglaserlocks.
3.3.2 Scan-range measurement
Thetime-seriesfeaturecanalsobeusedtodisplayrapidmeasure-
ments,wherethemeasurement interval issetto zero. Thiscan be
useful, for example, to measurethe mode-hop free scanrange ofa
tunablelaser(Figure3.6). Notethatattheend of the laser scan,
thewavelengthchangesveryrapidlyandcancausethewavelength
tovarynon-triviallyduring thecameraexposure,whichmaycause
a“jump”inthemeasuredwavelengthatthispoint.

3.3 Software UI 11
Figure 3.5: The time-series window shows how the wavelength measu-
rement is changing over time, for measuring drift. The graph displays
Duration seconds of data, with a datapoint collected every Interval se-
conds. WhenAveraging isenabled,thewavelengthmeasurementsduring
eachintervalareaveragedtoenhancethemeasurementprecision.

12 Chapter 3. User interface
Figure 3.6: When configured for maximummeasurement speed, the FZW
can be used to measure the mode-hop free scan-range of a laser. Set-
tingtheInterval tozeroensuresmeasurementsarerecordedasrapidlyas
possible,asindicatedbythelabelinthebottomleft.

3.3 Software UI 13
3.3.3 PID configuration
Theapplicationalsoincludesawindowforadjustingtheconstants
used for the PID control loop (§4.7). This provides a convenient
interface for optimising the gain values, and verifying the state of
thecontrolloop. Whenthecontrolloophassaturatedatoneofits
limits,theboxwillbehighlightedinmagenta.
Figure 3.7: InteractivewindowforadjustingthePID constants,including
displayoftheinstantaneousPIDerrorvalue(inMHz)andtheoutputvalue
(inVolts)fordiagnosticpurposes.

14 Chapter 3. User interface
Other manuals for FZW600
2
Table of contents
Other MOGlabs Measuring Instrument manuals
Popular Measuring Instrument manuals by other brands

Velleman
Velleman DVM854 user manual

Hanna Instruments
Hanna Instruments HI 254 instruction manual

HP
HP HP 8753E Programming and Command Reference Guide

CS Instruments
CS Instruments VA 520 instruction manual

Capetti Elettronica
Capetti Elettronica WineCap WLRD00THCOP user manual

janitza
janitza UMG 801 user manual