• TAPE/DIRECT, LINE
&
PHONES: switching of the playback signal o~ of
the direct signal on the line outputs, headphones and loudspeaker; switch
inactive on TEST
• TAPE/DIRECT, METER: switching of the playback signal or of the direct
signal on the circuit of rIleter 14; this switch cannot be locked on TAPE
• POWER: power selector switch i.e. built-in batteries or accumulators or
external power supply connected to plug 48
• Main function switch
STOP: recorder at • standstill
TEST: power sopplied to all circuits, except record and erase
RECORD: power supplied to all circuits and the motor; record and erase on
the 3 tracks
PLAYBACK: the recorded signal can be heard on the headphones and is fed
to the line outputs of connectors 41, 42,43,45 and 46 when switch 1 is on
TAPE (or on DIRECT if the output signal is reintroduced into the direct
chain. see 42)
PLA YBACK with Loudspeaker: playback of tape using loudspeaker
•LIGHT; meter 14 lights up momentarily: remains illuminated when the
button is turned to the right
o
Main attenuator CHANNEL 2: in steps of 10 dB for channel 2,Iower track
• Vernier attenuator CHANNE L 2; in steps of 1 dB for channel 1
• Main attenuator CHANN.E L 1: in steps of 10 dB for channel I, upper track
• Vernier attenuator CHANNE L 1: in steps of 1 dB for channel 1
dB scale: for the microphone inputs, in relation to the sound pressure
level 0.OOO2pbar
=
0 dB
voltage scale; effective voltage applied to the line input, which gives a reading
of OdB on the AVERAGE scale of meter 14
•REF. OSCILLATOR: switched on when the button is depressed, the
reference oscillator supplies a +10 dB signal to the direct amplifier on each
channel, after the attenuator
•
•
•LINE/MIKE: line or microphone input selector, channel 2
LINE/MIKE: line or microphone input selector, channell
FI LTERS: 6-position filter selector switch for channell:
HP high·pass
L1N. linear
WE IGHTING A, B, C, D weighting curves A, B, C and D
METER FUNCTION: six-position selector switch for meter 14
lEVEL. AVERAGE FAST: on the AVERAGE decibel scale, average value
of the sound level, fast characteristic, red needle for channel I, green needle
for channel 2
lEVEL. AVERAGE SLOW; the same as AVERAGE FAST, but slow
characteristic
LEVEL, PEAK: on the PEAK decibel scale, peak value of the sound level,
channels as above
BATT.: on the BATTERIES scale, battery or accumulator check
Red needle: battery voltage per cell (VOLTS/CELL)
Green needle: voltage required by the motor, with the same reduction factor
as battery voltage
PILOT8o CUE:
Green needle: on the PILOT 0 to 100% scale, overall frequency deviation
caused by the pilot and CUE signals, 100% on the scale corresponding to a
deviation of ±40%
Red needle: on the PILOT +4 to -4% scale, frequency shift, as determined by
the built-in OFMS frequency meter, between a signal recorded or played back
on the third track and an internal reference
Position M:
Green needle: same as PILOT
&
CUE
Red needle: on the 0 to 100% scale, current through the motor, 100% on the
scale corresponding to 250 mA
CD
•Fll TERS: filter selector switch for channel 2. identical to II
Meter: indicates sound level and checking functions according to the position
of selector switch 12
I
I
• PILOT: indicator which shows a white lone when frequency and amplitude
of the pilot signal are correct
I
SPEED
&
POWER: indicator which shows a white lone when the following
three conditions are fulfilled:
- power supply voltage higher than the maximum admissible value
- motor regulation within the correct operating range
tachometric speed fluctuations not exceedinq the maximum value
I
«I»
PHONES: connector for mono headphones, impedance 25 to 600n
• CHANNEL, PHONES
&
L.S.: channel selector for listening with headphones
and loudspeaker
• LEVEL, PHONES: adjustment of the headphones volume
• Tape speed selector switch
IS"
=
38.1 cmls
7'/,"
=
19.05cm/s
I
I
3% .•
=
9.525 cm/s
1
'h"
=
3.81 ·cm/s
I
• BIAS: 5'position bias selector switch
• Pinch-wheel
6)Fast wind switch:
REW.
I
rewind with main switch 4 in any position
except STOP, lever 32 in disengage position
fast wind when main switch 4 on
PLAYBACK with Loudspeaker
I
• Supply reel
• Tension roller of the supplV reel
• Erase head
•• Stabilizer roller with 50 or 60 Hz stroboscope
• Recording head tracks 1 and 2
e.
Recording and playback head track 3
•• Playback head tracks 1 and 2
CD
Capstan
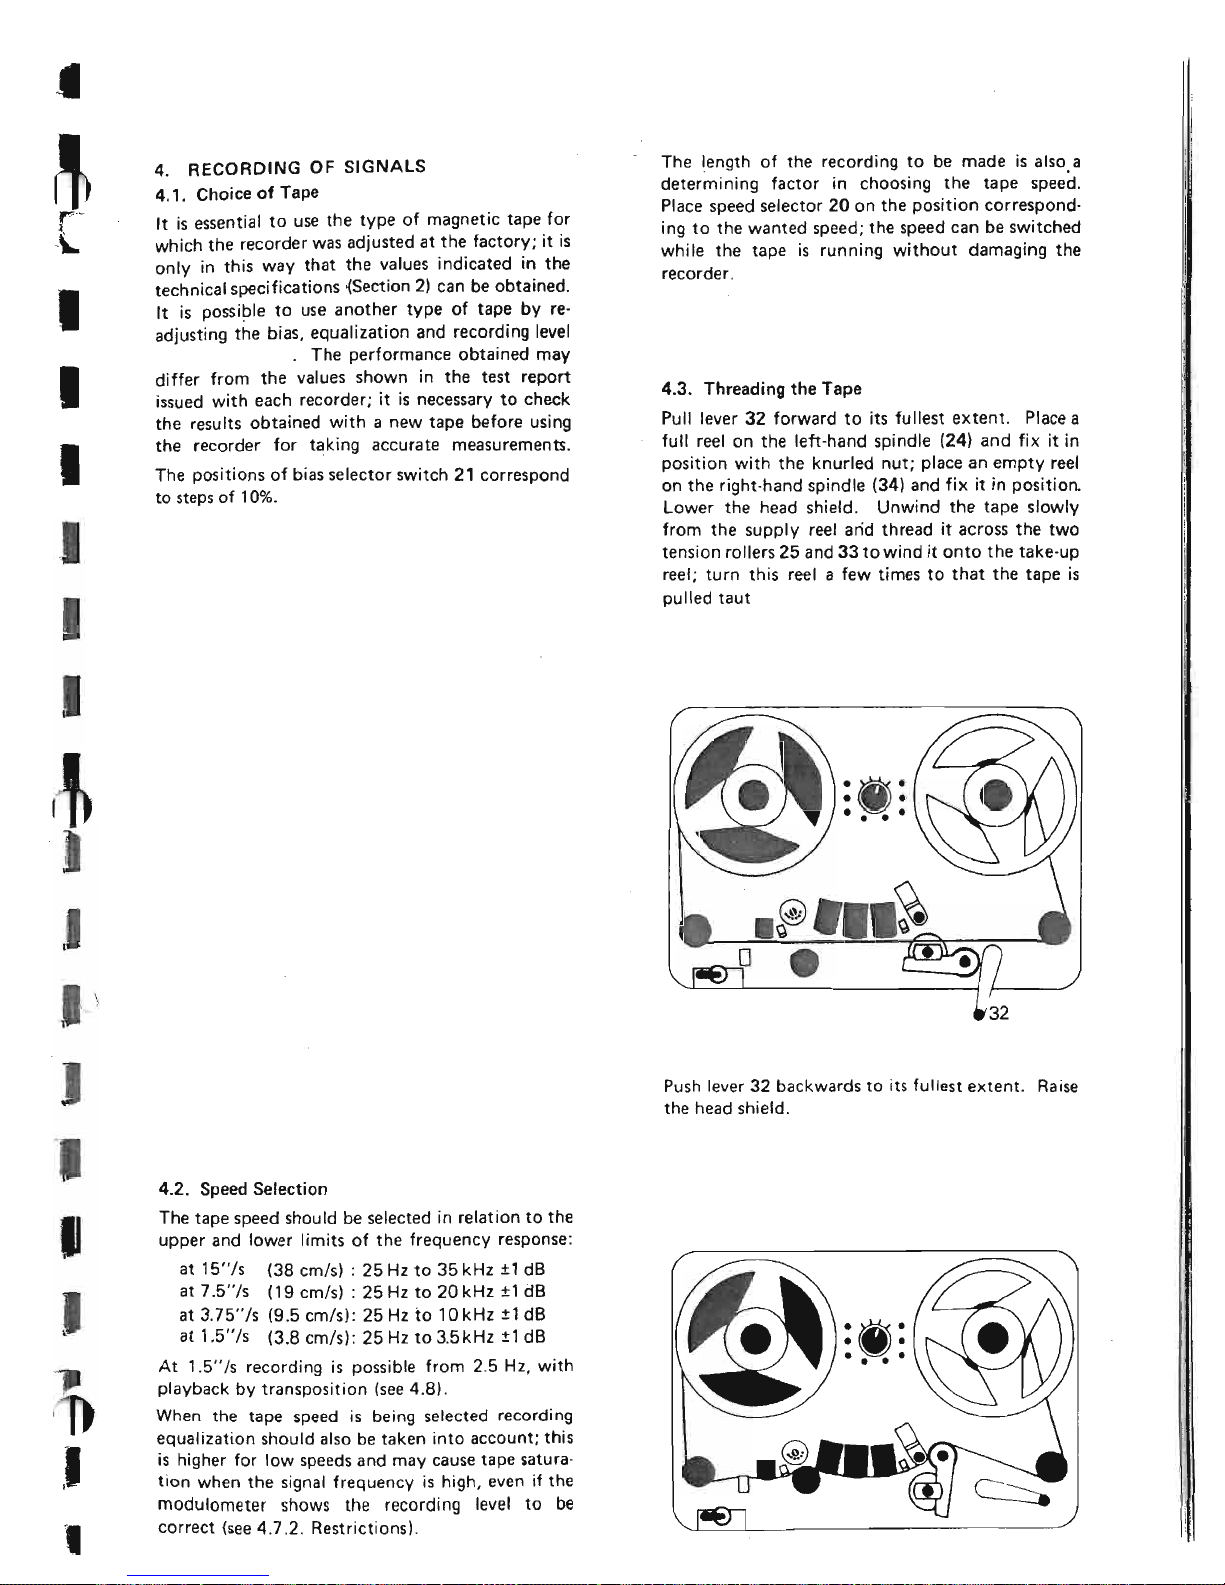
• 3'position lever controlling the pinch-wheel and tape guicles:
. - lever pulled to the left: for threading the tape (rewind possible in this
position)
- lever at 45° to the edge of the tape-deck: motor running, but tape not
moving
- lever pushed backwards: tape running
•• Tension roller of the take-up reel
• Take·up reel
6)RECORDING EOUALIZA TION ADJUSTMENT
I
I
I
I
I
I
I