ii
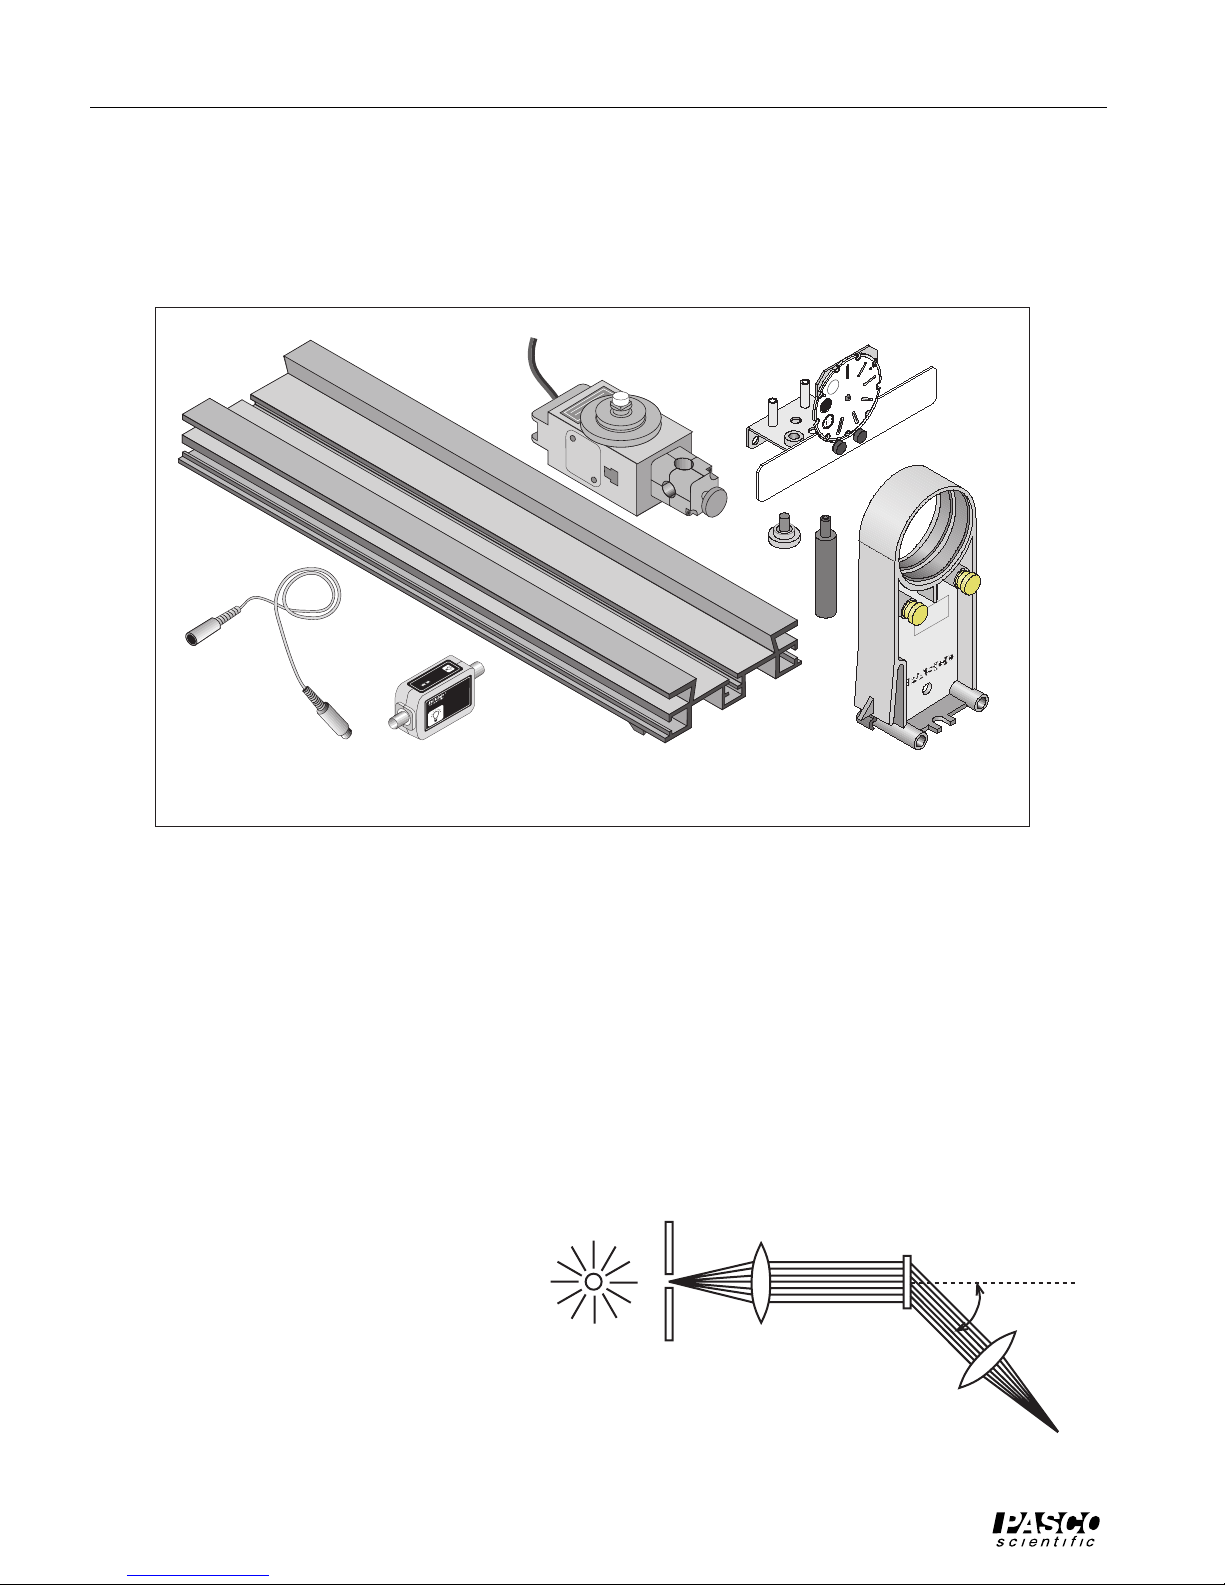
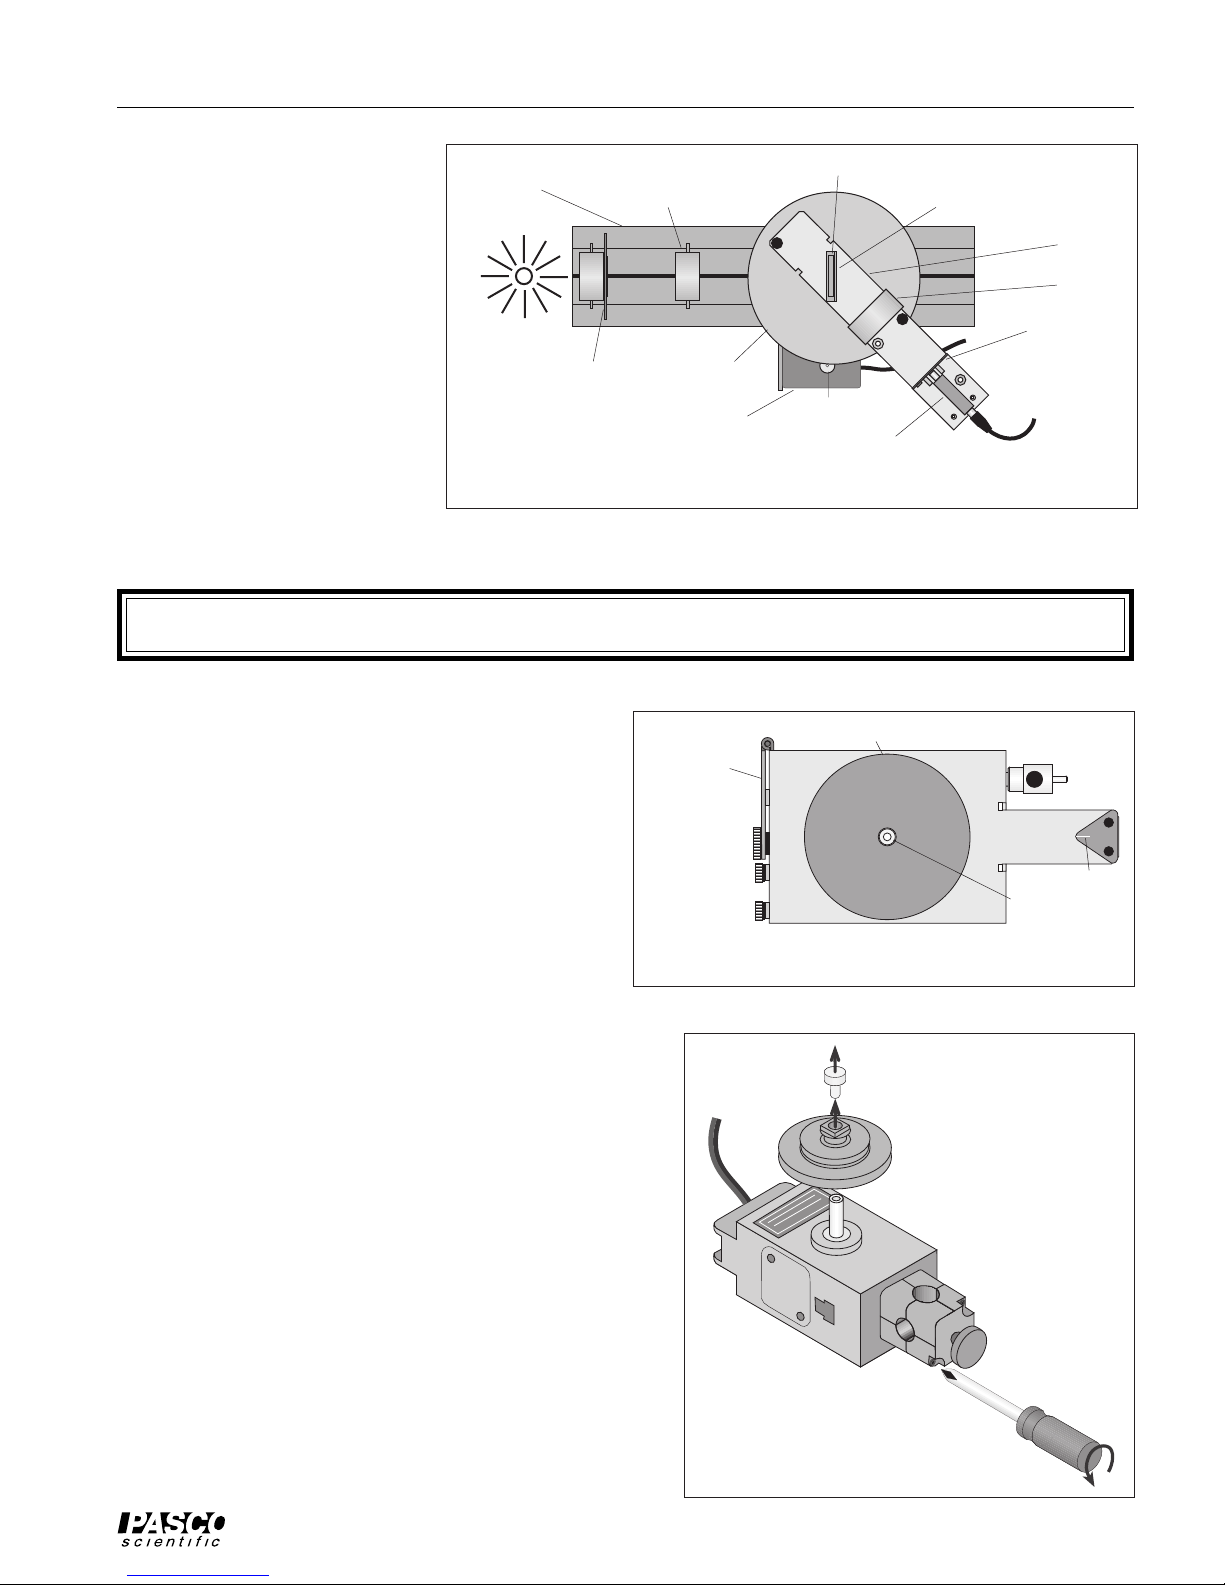
Educational Spectrophotometer 012-06575A
Equipment Return
Should this product have to be returned to PASCO
scientific, for whatever reason, notify PASCO scientific
by letter or phone BEFORE returning the product. Upon
notification, the return authorization and shipping instruc-
tions will be promptly issued.
When returning equipment for repair, the units must be
packed properly. Carriers will not accept responsibility
for damage caused by improper packing. To be certain
the unit will not be damaged in shipment, observe the
following rules:
➀The carton must be strong enough for the item
shipped.
➁Make certain there is at least two inches of packing
material between any point on the apparatus and the
inside walls of the carton.
➂Make certain that the packing material can not shift in
the box, or become compressed, thus letting the instru-
ment come in contact with the edge of the box.
Address: PASCO scientific
10101 Foothills Blvd.
Roseville, CA 95747-7100
Phone: (916) 786-3800
FAX: (916) 786-8905
Copyright Notice
The PASCO scientific manual for the Model OS-8537
Educational Spectrophotometer Accessory Kit and OS-
8539 Educational Spectrophotometer System is copy-
righted and all rights reserved. However, permission is
granted to non-profit educational institutions for repro-
duction of any part of this manual providing the reproduc-
tions are used only for their laboratories and are not sold
for profit. Reproduction under any other circumstances,
without the written consent of PASCO scientific, is
prohibited.
Limited Warranty
PASCO scientific warrants this product to be free from
defects in materials and workmanship for a period of one
year from the date of shipment to the customer. PASCO
will repair or replace, at its option, any part of the product
which is deemed to be defective in material or workman-
ship. This warranty does not cover damage to the product
caused by abuse or improper use. Determination of
whether a product failure is the result of a manufacturing
defect or improper use by the customer shall be made
solely by PASCO scientific. Responsibility for the return
of equipment for warranty repair belongs to the customer.
Equipment must be properly packed to prevent damage
and shipped postage or freight prepaid. (Damage caused
by improper packing of the equipment for return ship-
ment will not be covered by the warranty.) Shipping costs
for returning the equipment, after repair, will be paid by
PASCO scientific.
Copyright, Warranty and Equipment Return
Please—Feel free to duplicate this manual
subject to the copyright restrictions below.
Credits
Edited by: Dave Griffith
➤NOTE:
NO EQUIPMENT WILL BE ACCEPTED FOR
RETURN WITHOUT AN AUTHORIZATION.