Saluki DSO1000 User manual

DSO1000 Digital Storage Oscilloscope
User Manual
Saluki Technology Inc.

www.salukitec.com
2
The document applies to the Digital StorageOscilloscopes of the following models:
DSO1082 Digital Storage Oscilloscope
DSO1102 Digital Storage Oscilloscope
DSO1202 Digital Storage Oscilloscope
DSO1302 Digital Storage Oscilloscope
DSO1064 Digital Storage Oscilloscope
DSO1104 Digital Storage Oscilloscope
DSO1204 Digital Storage Oscilloscope
DSO1304 Digital Storage Oscilloscope
DSO1000 Digital Storage Oscilloscope standard accessories:
Main Machine
Probe x2
USB cable
Power cable
CD

www.salukitec.com
3
Preface
Thank you for choosing DSO1000 Digital Storage Oscilloscope produced by Saluki Technology Inc.
We devote ourselvesto meeting your demands, providing you high-quality measuring instrument and the best after-
sales service. We persist with “superiorquality and considerate service”, and are committed to offering satisfactory
products and service for our clients.
Document No.
DSO1000-03-01
Version
Rev01 2017.06
Saluki Technology
Document Authorization
The information contained in thisdocument is subjectto change without notice. The power to interpretthe contentsof
and terms used in this document rests with Saluki.
Saluki Tech owns the copyright of this document which should not be modified or tampered by any organization or
individual, or reproduced or transmitted for the purpose of making profit without its prior permission, otherwise Saluki
willreserve the rightto investigateand affix legal liability of infringement.
Product Quality Assurance
The warranty period oftheproduct is 36 months from the date of delivery. The instrument manufacturer will repair or
replacedamagedpartsaccording to the actual situation within the warranty period.
Product Quality Certificate
The product meets the indicator requirements of the document at the time of delivery. Calibration and measurement
are completedby the measuring organization withqualificationsspecified bythe state, and relevant data are
provided for reference.
Quality/Settings Management
Research, development, manufacturing and testing of the product comply with therequirements of the quality and
environmental management system.

www.salukitec.com
5
Content
1Safety Tips.............................................................................................................................................................................7
1.1 General Safety Summary.................................................................................................................................................7
1.2 Safety Information.............................................................................................................................................................8
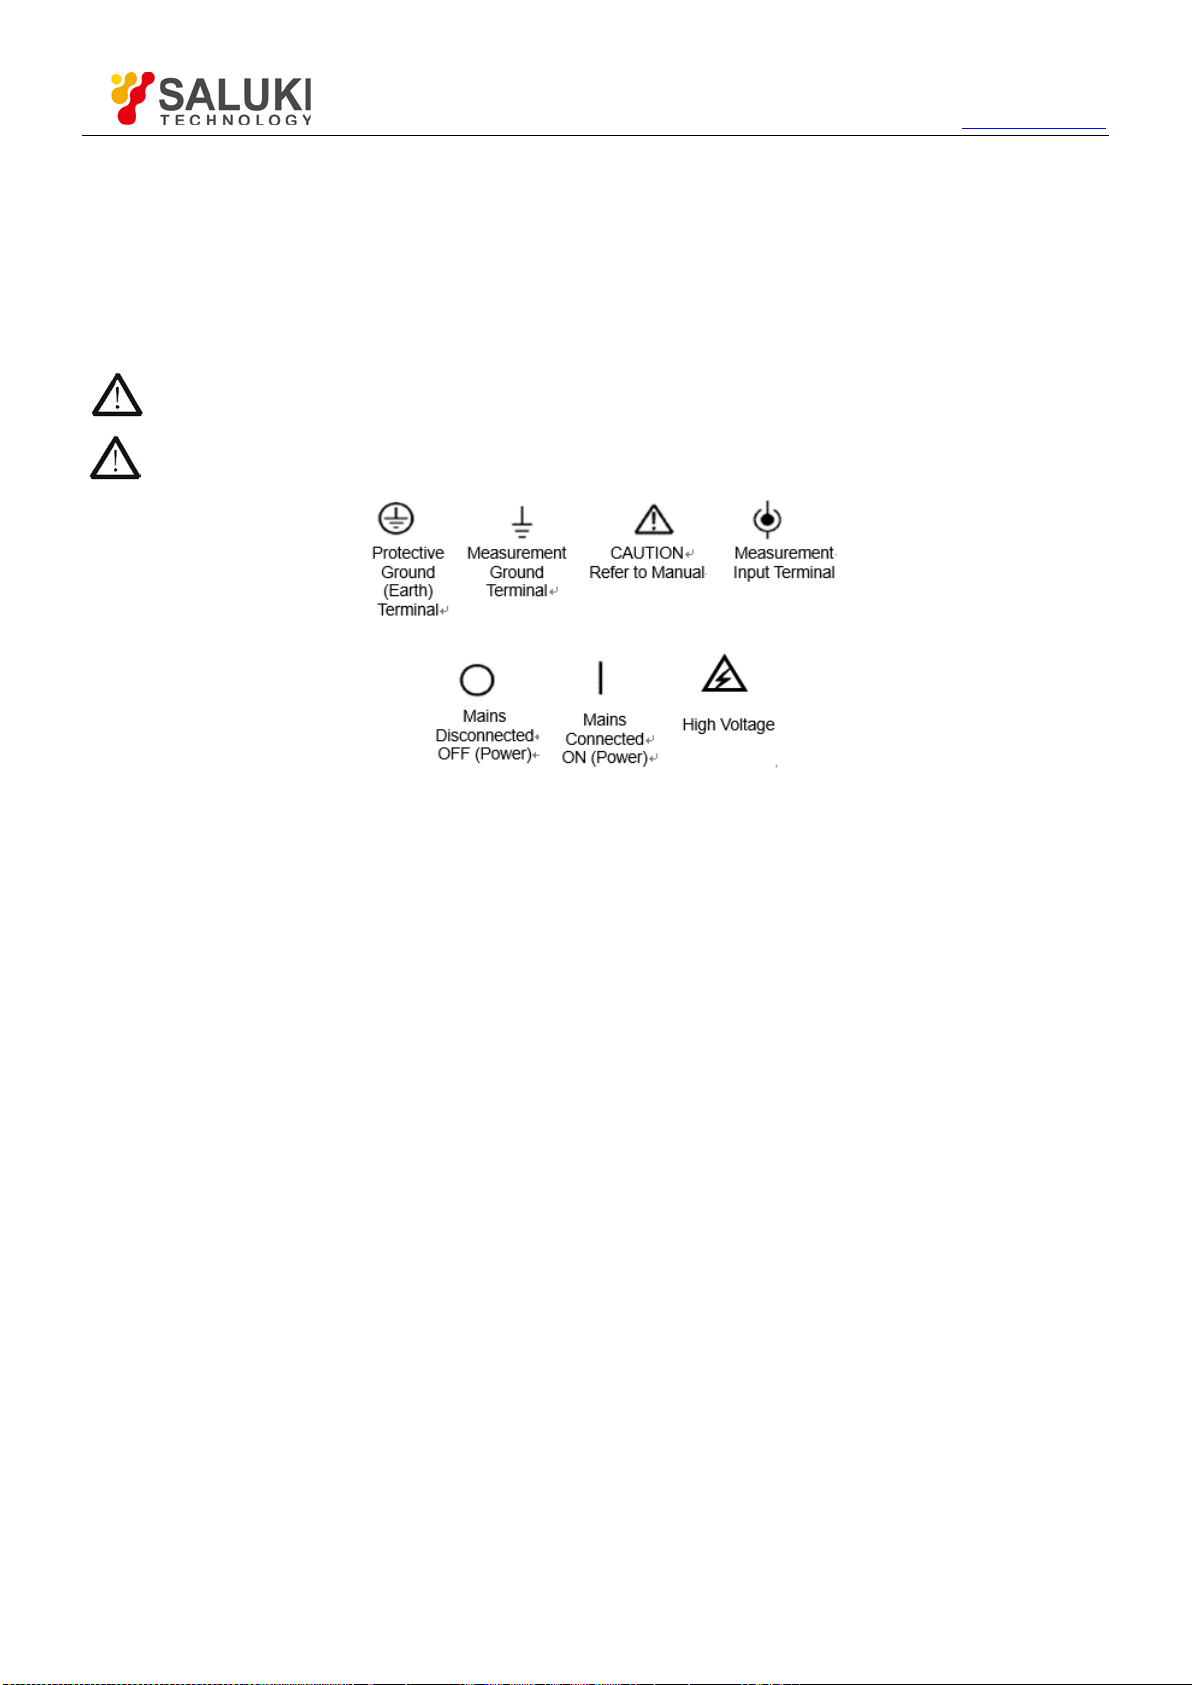
1.3 System Symbols...............................................................................................................................................................8
1.4 System Terms..................................................................................................................................................................8
1.5 Product Scrapping............................................................................................................................................................8
2Overview................................................................................................................................................................................9
2.1 Brief Introduction...............................................................................................................................................................9
2.2 Help System.....................................................................................................................................................................9
3Getting Started Guide...........................................................................................................................................................11
3.1 Installation......................................................................................................................................................................11
3.2 Functional Check............................................................................................................................................................11
3.3 Probe Examination.........................................................................................................................................................12
3.4 Manual Probe Compensation.........................................................................................................................................12
3.5 Probe Attenuation Setting...............................................................................................................................................13
3.6 Self Calibration...............................................................................................................................................................14
4Main Feature Description.....................................................................................................................................................15
4.1 Oscilloscope Setup.........................................................................................................................................................15
4.2 Trigger............................................................................................................................................................................15
4.3 Data Acquisition..............................................................................................................................................................16
4.4 Waveform Scaling and Positioning.................................................................................................................................17
4.5 Waveform Measurement................................................................................................................................................18
5Basic Operation....................................................................................................................................................................19
5.1 User Interface.................................................................................................................................................................19
5.2 Horizontal System...........................................................................................................................................................21
5.3 Vertical Controls.............................................................................................................................................................23
5.4 Trigger Controls..............................................................................................................................................................30
5.5 Menu and Option Buttons...............................................................................................................................................37
5.6 Fast Action Buttons.........................................................................................................................................................46
5.7 Multi-functional Buttons..................................................................................................................................................48
5.8 Signal Connectors..........................................................................................................................................................48
6Application Examples...........................................................................................................................................................49
6.1 Example 1: Taking Simple Measurements.....................................................................................................................49
6.2 Example 2: Taking Cursor Measurements......................................................................................................................51
6.3 Example 3: Analyzing Input Signals to Eliminate Random Noise...................................................................................54
6.4 Example 4: Capturing Single-shot Signal.......................................................................................................................55
6.5 Example 5: Using X-Y Mode...........................................................................................................................................56
6.6 Example 6: Triggering on Pulse Width...........................................................................................................................57
6.7 Example 7: Triggering on Video Signal..........................................................................................................................58

www.salukitec.com
6
6.8 Example 8: Using Slope Trigger to Capture Particular SlopeSignal..............................................................................59
6.9 Example 9: Using Overtime Trigger to Measure Long Pulse Signal...............................................................................60
6.10 Example 10: Using Math Functions to Analyze Waveforms...........................................................................................61
6.11 Example 11:Measuring Data Propagation Delay...........................................................................................................62
7Troubleshooting...................................................................................................................................................................64
7.1 Problem Settlement........................................................................................................................................................64
8General Care and Cleaning..................................................................................................................................................65
8.1 General Care..................................................................................................................................................................65
8.2 Cleaning.........................................................................................................................................................................65
9Harmful and Poisonous Substances or Elements................................................................................................................66

www.salukitec.com
7
1Safety Tips
1.1 General Safety Summary
Read the following safety precautionsto avoid injury and preventdamage to thisproductor any productsconnected
to it. To evade potential hazards, use this product only as specified.
Only qualified personnel should perform maintenance.
Avoid fire or personal injury.
Use suitable power cord.
Use only the power cord specified for thisproduct and certified for the country of use.
Connect and disconnect properly.
Connecta probe with the oscilloscope before it is connected to measured circuits; disconnect the probe from the
oscilloscope after it is disconnected from measured circuits.
Ground the product.
This product is groundedthrough the grounding conductor of the power cord. To avoid electric shock, the grounding
conductormustbe connected to earth ground. Beforemaking connections to the input oroutputterminals of the
product, ensure that the product is properly grounded.
Connect the probe in a right way.
The probe ground lead is atground potential. Do not connect the ground lead to an elevated voltage.
Check all terminal ratings.
To avoidfire or shock hazard, check all ratings and markings on the product. Referto the productmanual fordetailed
information about ratings before making connections to the product.
Do not operate without covers.
Do not operate thisproduct with covers orpanels removed.
Avoid exposed circuitry.
Do not touch exposed connections andcomponents when power is present.
Do not operate with suspected failures.
If you suspect there is damage to thisproduct,have it inspectedby qualified service personnel.
Assure good ventilation.
Do not operate in wet/damp environments.
Do not operate in an explosive atmosphere.
Keep product surfaces clean and dry.

www.salukitec.com
8
1.2 Safety Information
In orderto ensure the correct usingand the bestefficient service, please carefully read the user’s manual.
1.3 System Symbols
These symbols may appearin this manual oron the instrument.
Warning: “Waring” identifies conditionsand actions that pose hazards tothe users.
Caution: “Caution” identifies conditionsand actions that may damage the productor other properties.
1.4 System Terms
The following termsmay appearon the instrument:
Danger: The term “Danger” is used in the manualto indicate that when you readthis mark, personal injury may be
caused to immediately.
Waning: The term “Warning”is used in the manualto indicate that when you read thismark, personal injury may not
be caused to you immediately, but you needto be cautionary.
Notice: The term “Notice” is usedin thismanual to indicate that damages maybe caused on thisproduct orother
properties.
1.5 Product Scrapping
Device Recycling
We need extract and utilize natural resources to produce this device. If you do not reclaim the device in a proper
way, some substances it contains maybecome harmful or poisonous to environments or human bodies. To avoid
them being released outside and to minimize the waste of naturalresources, we suggestyou reasonably call back
this device to ensure proper recovery and recycling ofmost materials within it.

www.salukitec.com
9
2Overview
2.1 Brief Introduction
DSO1000 Series oscilloscopes cover the bandwidths from 60MHz to300MHz, and provide the real-time and
equivalent sample rates respectively up to 1GSa/sand25GSa/s. In addition, theyhave maximum 2Mmemorydepth
for better observation of the waveform details, and 7 inch color TFT LCDas well as WINDOWS-style interfaces and
menus for easy operation.
What’s more, the plentymenu informationand the easy-to-operate buttons allow you to gaininformation asmuch as
possible in measurement; the multifunctional knobs and the powerfulshortcut keyshelp you savea lotof time in
operation; theAutosetfunction letsyou detect sine andsquare wavesautomatically; the Probe Check Wizard guides
you to adjust the probe compensation and set the Probe option attenuationfactor. By using the three methods the
oscilloscope provides (context-sensitive, hyperlinks, and anindex), you may master alloperationson thedevice in
quite a short time soas to greatly improve your efficiency in production anddevelopment.
Model Channels Bandwidth Sample Rate Memory Depth LCD
DSO1082 2 80MHz 2GS/s 64K 7 inch color
DSO1102 2 100MHz 2GS/s 64K 7 inch color
DSO1202 2 200MHz 2GS/s 64K 7 inch color
DSO1302 2 300MHz 2GS/s 64K 7 inch color
DSO1064 4 60MHz 2GS/s 64K 7 inch color
DSO1104 4 100MHz 2GS/s 64K 7 inch color
DSO1204 4 200MHz 2GS/s 64K 7 inch color
DSO1304 4 300MHz 2GS/s 64K 7 inch color
Model List of DSO1000 Series
2.2 Help System
This oscilloscope has a Help system with topics covering all of its features. You canuse the Help system to display
several kinds of information:
General information about understanding and using the oscilloscope, such as Using the Menu System.
Information about specific menus and controls,such as the Vertical Position Control.
Advice to problems you may come across while using an oscilloscope, such as Reducing Noise.

www.salukitec.com
10
The Help systemprovides three methods for you to find the information you want: context-sensitive, hyperlinks, and
an index.
Context-Sensitive
Push the HELP front-panel button and the oscilloscope displays information about the last menu displayed on the
screen. The HELP SCROLL LED lights beside the HORIZONTAL POSITION knob indicate the alternative function of
the knob. If a topic uses more than one page, turn the HELPSCROLL knob to move from page to page within the
topic.
Hyperlinks
Most of the help topics contain phrases marked with angle brackets, such as <Autoset>. They are links to other
topics. Turn the HELP SCROLL knob to move the highlight fromone link toanother. Pushthe Show Topic option
button to display the topic correspondingto the highlighted link. Press the Backoption button to return tothe previous
topic.
Index
Push the front-panel HELPbutton, and then press the Index option button. Push the Page Up or Page Down option
buttonuntil you find the index page which contains the topic you want to view. Turn the HELP SCROLL knob to
highlight a help topic. Press the Show Topic option button to displaythe topic.
NOTE: Press the Exit option button or any menu button to remove the Help text from the screenand return to
displaying waveforms.

www.salukitec.com
11
3Getting Started Guide
3.1 Installation
To keep proper ventilation of the oscilloscope inoperation, leavea spaceof more than 5cm awayfrom the topand
the two sides ofthe product.
3.1.1 Power Supply
Use a power supply that delivers 90 to 240 VRMS, 45 to 440 Hz.
3.1.2 Power Cord
Use only power cords designed for this product.
3.2 Functional Check
Follow the steps below to perform a quick functional check to your oscilloscope.
3.2.1 Power on the oscilloscope
Plug in the oscilloscope and press the ON/OFF button. The default Probe option attenuation setting is 10X.
3.2.2 Connect the oscilloscope
Set the switch on the probe to 10X and connectthe probe to Channel1 on theoscilloscope. First, align the slot in the
probe connector with the protuberance on the CH1 BNC and push to connect; then, turn to right to lockthe probe in
place; after that, connect the probe tip and reference lead to the PROBE COMP connectors. There is a markon the
panel: Probe COMP ~2V@1KHz.
3.2.3 Observe the waveform
Press the AUTOSET button and you should see within a few seconds a square wave of about 2V peak-to-peak at
1kHz in the display. Press the CH1 MENU button twice to remove Channel 1. Push the CH2 MENU button and
repeat Step 2 and Step 3 to observe Channel 2.

www.salukitec.com
12
3.3 Probe Examination
3.3.1 Safety
When using theprobe, keep your fingers behind the guard on the probe body to avoid electric shock. Do not touch
metallic portions ofthe probe head while it is connectedto a voltage source.Connect the probe to the oscilloscope
and connect the ground terminal to ground before youstart any measurements.
3.3.2 Use of Probe Check Wizard
Every time you connecta probe to an input channel, you should use the probe check wizard to verify that this probe
is operating correctly. There are two ways to do this:
1) Use the vertical menu (for example, push the CH1 MENU button) to set the Probe option attenuation factor.
2) Press the UTILITY->F6->F6->PROBE CHECKbuttonto use the Probe CheckWizard and configure the probe
option attenuation factor properly following menu prompts.
3.4 Manual Probe Compensation
Upon thefirstconnection ofa probe and an input channel, you should manually perform this adjustmentto match the
probe to the input channel.Uncompensated or miscompensated probes may leadto errors or faults in measurement.
To adjust the probe compensation,follow the steps below.
1. Set theProbe option attenuation in the channel menu to 10X. Setthe switch onthe probe to10X and connect
the probe to Channel 1 on the oscilloscope. If you use the probe hook-tip, ensure it is firmly inserted onto the

www.salukitec.com
13
probe. Attach the probe tip to the PROBE COMP ~2V@1KHz connector and the reference lead to the PROBE
COMP Ground connector. Display the channeland then press the AUTOSET button.
2. Check the shape of the displayed waveform.
3. If necessary,use a nonmetallic screwdriver to adjust the variable capacity of your probe until the shape of the
waveformturnsto be thesame as the above figure. Repeatthis step as necessary. See the figure below for the
way of adjustment.
3.5 Probe Attenuation Setting
Probes are of various attenuation factors which affect the vertical scale ofthe signal.The Probe Checkfunction is
used to verify if the Probe attenuation option matches the attenuation of the probe.
As an alternative method toProbe Check, you canpush a vertical menubutton (such as the CH1 MENU button) and
select the Probe option that matches the attenuation factor of your probe.
Make sure thatthe Attenuation switch on the probe matches the Probe option in the oscilloscope. Switch settings are
1X and 10X.
When the Attenuation switch is setto 1X, the probe limits the bandwidth of the oscilloscope to 6MHz. To use the full
bandwidth of the oscilloscope, be sure to set the switch to 10X.

www.salukitec.com
14
3.6 Self Calibration
The self calibration routine helps optimize the oscilloscope signalpath for maximum measurement accuracy. You
can run the routine at any time but should alwaysrun it if theambient temperature changes by 5℃or more. For a
more accurate calibration,pleasepower on the oscilloscope and wait for 20 minutes until it has adequately warmed
up.
To compensate the signal path, disconnect any probes or cables from the front-panel input connectors. Then, push
the UTILITY button, select the Do Self Caloption and follow the directions on the screen.

www.salukitec.com
15
4Main Feature Description
This chapter provides some general information that you need to learn before using an oscilloscope. It contains:
1. Oscilloscope setup
2. Trigger
3. Data acquisition
4. Waveform scaling and positioning
5. Waveform measurement
4.1 Oscilloscope Setup
While operating the oscilloscope, you may often use three features: Autoset, saving a setup and recalling a setup.
Hereinafter they are introduced one by one.
Autoset: This function can be used to adjustthe horizontaland verticalscalesof the oscilloscope automatically and
set the trigger coupling, type, position, slope, levelandmode, etc., toacquirea stable waveform display.
Saving a Setup: By default, theoscilloscope will save the setup each timebefore being closed,and automatically
recall the setup once being turned on. (Note: If you modify the setup, please wait for more than 5 seconds
before turning off the oscilloscope to ensure the proper storage of new settings.) You can save 10 settings
permanently in the oscilloscope and reset them as necessary.
Recalling a Setup: The oscilloscope can recall any of your saved setups and the default factory setup.
Default Setup: The oscilloscope is preset for normal operations when it is shipped from the factory. This is the
default setup.
4.2 Trigger
The trigger determines when the oscilloscope begins to acquire data and displaya waveform. Once a trigger is
properlyset up, the oscilloscope can convert unstabledisplays or blank screensto meaningful waveforms. Here
introduce some basic concepts about trigger.
Trigger Source
The trigger can be generated with multiple sources. The most common one is the input channel (alternative between
CH1, CH2, CH3). Whether the input signal is displayed or not, it can trigger normal operations. Also the trigger
source can be any signal connected to an external trigger channel or the AC powerline (onlyfor Edge triggers). The
source with the AC power line shows the frequency relationship between the signaland the AC commercial power.
Trigger Type:
The oscilloscope has six types of triggers: Edge, Video, Pulse Width,Slope,Overtime andAlter.
Edge Trigger uses theanalog ordigitaltest circuits for triggering.It happenswhenthe input trigger source
crossesa specified level ina specified direction.
Video Trigger performs a field or line trigger through standard video signals.

www.salukitec.com
16
Pulse Width Trigger can trigger normal or abnormalpulses that meet trigger conditions.
Slope Trigger uses the rise and fall times on the edge of signal for triggering.
Overtime Trigger happens after theedge of signalreachesthe set time.
Alter Trigger, as a feature of analog oscilloscopes, gives stable displays of signals at two different
frequencies. Mainly it uses a specific frequency to switch between twoanalog channelsCH1 and CH2 so
that the channels will generate Alter trigger signals through the trigger circuitry.
Trigger Mode
You can select the Auto or Normal mode to define howthe oscilloscope acquiresdata when it does notdetecta
trigger condition. Auto Mode performs the acquisition freely in absence of valid trigger. It allows the generation of
untriggered waveformswith the time base set to 80ms/div or slower. Normal Mode updates the displayed
waveforms only when the oscilloscope detects a valid trigger condition. Before this update, the oscilloscope still
displaysthe old waveforms.This mode shallbe used when you wantto only view the effectivelytriggered
waveforms. In this mode, the oscilloscope displays waveforms only after the first trigger. To perform a single
sequence acquisition, push the SINGLE SEQ button.
Trigger Coupling
Trigger Coupling determines which part of the signal will be delivered to the trigger circuit. This can help to obtain a
stable displayof the waveform. To use trigger coupling, push the TRIG MENU button, select an Edge or Pulse
trigger, and then select a Coupling option.
Trigger Position
The horizontalposition control establishes the time between the trigger position and the screen center.
Slope and Level
The Slope and Level controls helpto define the trigger. The Slope option determines whether the trigger point is on
the rising or falling edge of a signal. To perform the trigger slope control, press the TRIG MENU button, select an
Edge trigger, and use the Slopebuttonto select rising or falling. The TRIGGERLEVEL knob controlsthe trigger point
is on which position of the edge.
4.3 Data Acquisition
When you acquire an analog signal,the oscilloscope will convert it into a digital one. There are two kinds of
acquisition: Real-timeacquisition and Equivalentacquisition. The real-time acquisition has three modes: Normal,
Peak Detect, and Average. The acquisitionrate isaffected bythe setting of time base.

www.salukitec.com
17
Normal: In this acquisitionmode, theoscilloscope samples the signal in evenly spaced intervals to establish the
waveform. This mode accurately represents signals in most time. However, it does not acquire rapid variations
in the analog signal that may occur between two samples, which can result in aliasing and maycause narrow
pulses to be missed.In such cases, you should use the Peak Detectmode to acquire data.
Peak Detect:In this acquisition mode, the oscilloscope gets the maximum and minimum values of the input
signal over each sample interval and uses these valuesto display the waveform. In thisway, the oscilloscope
can acquire and display those narrow pulses that may have otherwise been missed in Normal mode. However,
noise will appear to be higher in this mode.
Average: In this acquisition mode, the oscilloscope acquires several waveforms, averages them, and displays
the resulting waveform. Youcan use this mode to reduce random noise.
Equivalent Acquisition: This kind of acquisition canbe utilizedfor periodic signals. In case theacquisition rate
is too low when using the real-time acquisition, theoscilloscope willuse a fixed rateto acquire datawith a
stationary tiny delayafter each acquisition of a frame of data. After repeating this acquisition for N times, the
oscilloscope will arrange the acquired N framesof databy time to make up a new frame ofdata. Then the
waveform can be recovered. The number of times N is related to the equivalent acquisition rate.
Time Base: The oscilloscope digitizes waveforms byacquiring the value of an input signal at discrete points.
The time base helps to control how often the values are digitized. Use the SEC/DIV knob toadjust the time base
to a horizontal scale that suits your purpose.
4.4 Waveform Scaling and Positioning
The display of waveforms on the screen can be changed by adjusting their scale and position. Once the scale
changes, the waveform display will increase or decrease in size.Once the position changes, the waveform will move
up, down, right, or left.
The channel referenceindicator (locatedon the left of the graticule) identifies each waveform on the screen. It points
to the ground level of the waveform record.
Vertical Scale and Position:
The vertical position of a waveformcan be changed bymoving it up anddown onthe screen. Tocompare data, you
may align a waveform over another. When you push the VOLTS/DIV button to change the vertical scale of a
waveform, the waveform display will contract orexpandvertically to the ground level.
Horizontal Scale and Position:
You can adjustthe HORIZONTAL POSITION control toview waveform data before the trigger, after the trigger, or
some of each. When you change the horizontal position of awaveform, youare actuallychanging the time between
the trigger position and the screen center.
For example, if you want tofind out the cause of a glitch in yourtest circuit, you should trigger on the glitch and make
the pretrigger period long enough to capture data before the glitch. Then you can analyze the pretrigger data and
perhapsfind the cause.Youare allowed to change the horizontal scaleof all the waveforms byturning the SEC/DIV
knob. For example, you may want to see justone cycle of awaveform to measure the overshoot on its risingedge.

www.salukitec.com
18
The oscilloscope shows thehorizontal scale as time perdivision in the scale readout. Since allactive waveforms use
the same time base, the oscilloscope only displays onevalue for all the active channels.
4.5 Waveform Measurement
The oscilloscope displaysgraphs of voltage versus time and can help to measure the displayed waveform. There are
severalways to take measurements,using the graticule, the cursors orperforming an automatic measurement.
Graticule
This method allows you to make a quick, visual estimate and take a simple measurement through the graticule
divisions and the scale factor.
For example, youcan takesimple measurements bycounting the majorand minorgraticule divisions involved and
multiplying bythe scale factor. If you counted 6 major vertical graticule divisions between the minimum and maximum
values of a waveform and knew you had a scale factor of 50mV/division, you could easily calculate your peak-to-
peak voltage as follows:
6 divisions x 50mV/division = 300mV.
Cursor:
This method allowsyou to take measurements bymoving the cursors. Cursors always appear in pairsand the
displayedreadouts are justtheir measured values. There are two kindsof cursors:Amplitude Cursor and Time
Cursor. The amplitude cursor appear as a horizontal broken line, measuring the vertical parameters. The time cursor
appear as a vertical broken line, measuring the horizontal parameters.
When using cursors, please make sure to set the Source to the waveform that you want to measure on the screen.
To use cursors, pushthe CURSOR button.
Automatic Measurement:
The oscilloscope performs all the calculations automatically in this mode. As this measurement uses the waveform
record points, it is more precise than the graticule andcursor measurements. Automatic measurements show the
measurement results by readouts which are periodically updated with the new data acquired by the oscilloscope.

www.salukitec.com
19
5Basic Operation
The front panel of theoscilloscope is divided into several functionalareas.In this chapter, we will give a quick
overview of allcontrolbuttonsand knobson thefrontpanelas well as the displayed information on the screen and
relative testing operations. The figure belowillustrates the front panel of theDSO1000 series digital oscilloscope.
Front Panel of DSO1000
5.1 User Interface
1. Saluki mark
2. Display Format:

www.salukitec.com
20
3. Acquisition Mode: Normal, Peak Detect or Average
4. Trigger Status:
The oscilloscope isacquiring pretriggereddata.
All pre-triggered data have been acquired and the oscilloscope is ready to accept a trigger.
TThe oscilloscope has detected atrigger and is acquiring the posttrigger information.
The oscilloscope works in auto mode and is acquiring waveforms in the absence of triggers.
The oscilloscope is acquiring and displaying waveform data continuously in scan mode.
●The oscilloscope has stopped acquiringwaveform data.
S The oscilloscope has finished a single sequence acquisition.
5. Tool Icon:
: If this icon lights up, it means the keyboard ofthe oscilloscope islocked bythe host computer via USB
control.
: If this icon lights up, it means the USB disk has been connected.
: This icon lights up only when the USB slave interface is connected with the computer.
6. Main Time Base Window
7. Display of window’s position in data memory anddata length.
8. Window Time Base
9. Operating Menu shows different information fordifferent function keys.
10. Readout shows frequency count.
11. Readout points out horizontal waveform position
12. Trigger Type:
:Edge trigger on the risingedge.
: Edge trigger on the falling edge.
: Video triggerwith line synchronization.
: Video triggerwith field synchronization.
: Pulse Width trigger, positive polarity.
:
YT
: Vectors
:
Gray indicatesauto persistence; Green means persistence display is enabled. When the
icon is set to green,
the time forpersistence displaywill be shownbehind it.
:
XY
:
Dots
Table of contents
Other Saluki Test Equipment manuals
Popular Test Equipment manuals by other brands

Pfaff Industrial
Pfaff Industrial Seam instruction manual

Sibata
Sibata FC-M1 Operation manual

Probewell
Probewell MT-1/WT3 user guide

Phenix Technologies
Phenix Technologies PM15-4A Operation and application manual

Meatest
Meatest M631 Operation manual

Cascade Microtech
Cascade Microtech IZI Probe Quick reference guide