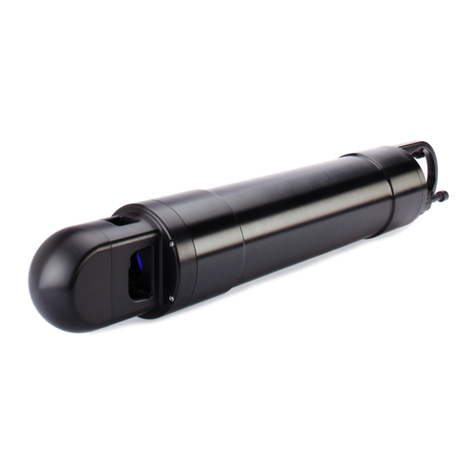
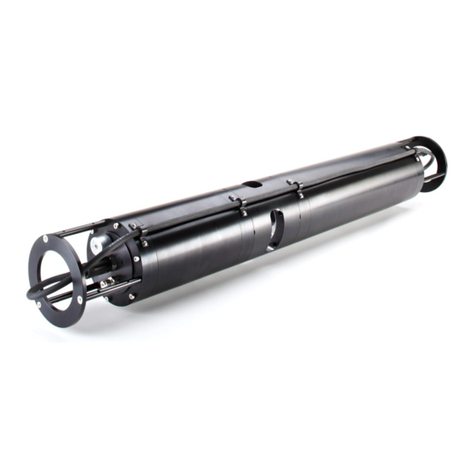
Sequoia LISST-Infinite User manual

LISST-Infinite /
LISST-Hydro
Particle Size Analyzer
User’s Manual
Version 2.0
(December 2011)
Sequoia Scientific, Inc.
2700 Richards Road Suite 107
Bellevue, WA, 98005, USA
Phone: +1 425-641-0944 ; Fax: +1 425-643-0595


Welcome to the User’s Manual for the LISST-Infinite and
LISST-Hydro Particle Size Analyzers!
Using this manual
This manual is divided into three sections.
Section One contains an introduction to the LISST-Infinite instrument and the
principles of its operation.
Section Two provides a detailed set of instructions for using the software.
Section Three provides information about maintenance and troubleshooting.
Technical assistance
For technical assistance please contact your local Distributor or Sequoia if the
instrument was purchased directly from Sequoia. Please be sure to include
the instrument serial number with any correspondence.
A
list of local Sequoia distributors can be found at our www:
http://www.sequoiasci.com/contact/international.aspx?SectionName=contact
Sequoia Scientific, Inc. can be reached at


Contents
SECTION 1: INTRODUCTION..................................................................................................................1
SECTION 2: OPERATION ......................................................................................................................4
2.1: LISST-INFINITE MASTER CONTROLLER SOFTWARE.............................................................................5
2.2. LISST-INFINITE MONITOR SOFTWARE...............................................................................................16
2.2.1. LISST-Infinite Monitor, Master Controller Mode .....................................................................18
2.2.2. LISST-Infinite Monitor , Monitor Mode ....................................................................................20
2.2.3. LISST-Infinite Monitor , Archive Mode.....................................................................................30
STEP BY STEP PROCEDURES...............................................................................................................31
STEP BY STEP:DATA COLLECTION WITH LISST-INFINITE MASTER CONTROLLER SOFTWARE..................32
STEP BY STEP:DATA COLLECTION WITH LISST-INFINITE MONITOR ,MASTER CONTROLLER MODE.......33
STEP BY STEP:VIEW DATA WITH LISST-INFINITE MONITOR ,MONITOR MODE.......................................36
STEP BY STEP:VIEW ARCHIVED DATA......................................................................................................38
SECTION 3: TROUBLESHOOTING AND MAINTENANCE.............................................................39
3.1. WARNING MESSAGES.........................................................................................................................40
3.2. MAINTENANCE ...................................................................................................................................42
APPENDIX A: SIZE RANGES .................................................................................................................46
APPENDIX B: FILE FORMATS..............................................................................................................47
WARRANTY...............................................................................................................................................50


1
Section 1: Introduction
Introduction
The LISST-Infinite is a suspended sediment sensor that uses laser
diffraction to measure the detailed size distribution and concentration of
particles suspended in water. It has an auto-dilution system that allows
a sample of water to be automatically diluted with clean water. This
automatic dilution enables for the accurate measurement of water with
concentration up to approximately 30,000 ppm (by mass).
Instrument
Overview The LISST-Infinite system consists of a main optics and control unit, a
submersible pump (optional), associate power and control hardware, a
source of filtered water, and a Windows based PC running the data
collection software.
LISST-Infinite
Main optics and
control unit
details
The LISST-Infinite main optics and control unit system consists of the
following main components:
1) LISST-Infinite flow through cell and optics
2) Upper and lower 3-way pinch valves
3) Dilution Chamber and mixing pump
4) Valve controller and main electronics board.
Figure 1. LISST-Infinite Main components. Main components include a) LISST-Infinite flow
through cell and optics, b) Upper 3-way pinch valve, c) Set of Lower 3-way pinch valve d)
Dilution Chamber; e) Mixer Pump; f) Valve controller and elctronics boards, g) Clean water
tank level sensor.

2
Data Collection The data collection is controlled by the LISST-Infinite software running
on a PC. The software will communicate with the LISST-Infinite main
optics and controller. River water will flow or be pumped be pumped
through the LISST-Infinite sensor. If needed, the water will be diluted
to obtain accurate results. The raw data is then transferred to the
LISST-Infinite software where it is processed into detailed size
distributions. The software will display a time history of the
concentrations and display warning flags as the concentration
approaches critical levels.
The process of acquiring a measurement of suspended sediment is
divided into five processes:
1) Clean water background measurement
2) Undiluted pumped river water sampling
3) Captured Sample dilution sampling
4) Transmit data to LISST-Infinite software on PC for display
5) System flushing and preparations for next sample
Clean Water
Background The first step in acquiring a measurement of suspended sediment is to
acquire a clean water background measurement. The system is
automatically filled with clean filtered water prior to sampling. This
allows the system to turn on the laser and optics and record the optical
scattering from the clean water only. This background measurement
effectively “zeros” the instrument and compensates for any potential
build-up of particles on the optical windows over time.
Since a background is obtained before each and every sample, drifts in
the measurement due to fouling of the optical windows are eliminated.
The current background scattering is available for viewing in the LISST-
Infinite software.
Comparisons can be made with the original factory background values
to determine if window cleaning is required. Window cleaning should
be part of the scheduled monthly instrument maintenance.
Undiluted River
water sampling After obtaining a clean water background, the valve systems on the
LISST-Infinite opens up to let water flow through the LISST-Infinite
optical cell. If a pump is attached, a command is sent to the pump to
turn on and start pumping.
The pinch valves in the instrument are configured to allow the turbid
water to flow through the optical cell. This is done to make sure that
the water from the previous measurement is completely flushed out of
the system and the optics. After a pre-determined amount of time,
which the user can set, the laser beam is turned on and the light
scattering is measured.

3
If the concentration is within the acceptable level, a measurement of
the detailed size distribution will be made and the data will be
transmitted to the PC for processing and display. If the concentration is
higher than acceptable levels an accurate measurement of
concentration and size distribution cannot be made. In this situation a
dilution of the turbid water will be performed.
Capture sample
and dilute If the concentration of the sediment is determined to be too high a
sample capture and dilution must be performed. To capture a sample
the values above and below the optical cell are closed. This trapped
known volume of water is then recirculated with a known volume of
clean water. This procedure performs a 15 to 1 dilution of the turbid
water.
The diluted turbid water is then recirculated through the optical cell
where a measurement of detailed size distribution if performed. Once a
measurement of detailed size distribution and concentration is obtained
the results are transmitted to the PC for processing and display. The
system then prepares itself for the next sample by flushing out the old
sample and rinsing with clean water.
System
Flushing and
preparation for
next sample
After obtaining a measurement the system must reset itself before the
next sample can be measured. The steps performed will vary
depending on if a sample dilution was performed.
If a dilution was not performed the preparation for the next sample is
simply to check the water level in the external water tank and fill the
dilution chamber as needed.
If a dilution was performed a series of flushing cycles will be performed
to make sure there are no residual particles remaining in the system
that would bias the next diluted measurement.
Upon completing the flushing procedure the system is now ready to
accept commands from LISST-Infinite software.

4
Section 2: Operation
General
Introduction to
LISST-Infinite
software
The software that you must use with your LISST-Infinite or LISST-
HYDRO will vary depending on how many instruments you have
connected to your PC. It is possible to have anywhere from 1 to 5
instruments connected, and displaying data in real-time.
One
instrument? If you have one instrument connected to your instrument, you can
only use the software called LISST-Infinite monitor, which can be
operated in one of three modes:
Master Controller Mode
Monitor Mode
Archive Viewer Mode
Two or more
instruments? If you have two or more instruments connected (for example, 2
LISST-Infinite’s, or a LISST-Infinite and 2 LISST-HYDRO’s), you must
use the software called LISST-Infinite Master Controller. Note that
this is different from the Master Controller Mode in the LISST-Infinite
Monitor Software.
Since most users have two or more LISST-Infinite and/or LISST-
HYDRO instruments connected we will deal first with this situation and
the use of the LISST-Infinite Master Controller software.
Proceed with Section 2.1 LISST-Infinite Master Controller Software
if you have two or more instruments connected.
Proceed with Section 2.2 LISST-Infinite Monitor Software, Master
Controller Mode if you have one instrument connected

5
2.1: LISST-Infinite Master Controller Software
LISST-Infinite
Master
Controller
SOFTWARE
The LISST-Infinite Master Controller Software should only be used
1) if you have two or more LISST-Infinite or LISST-HYDRO’s
connected to your PC OR
2) you have a LISST-Infinite or LISST-HYDRO with the optional 4-
20 mA output.
If you have only have one LISST-Infinite or LISST-HYDRO connected,
and you do not have the optional 4-20 mA output on your instrument,
proceed to section 2.2. LISST-Infinite Monitor Software, Master
Controller Mode.
Installing LISST-
Infinite Master
Controller
Software
A LISST-Infinite software CD is provided with each LISST-Infinite. This
CD contains the software necessary to operate the LISST-Infinite. An
install program is included on the CD that will extract the files into the
proper locations. To start the install process, run the SetupInfinite.EXE
program on the CD. You will be prompted to select a location to install
the program. The default folder is C:\Program
Files\Sequoia\LISSTMstController or C:\Program Files
(x386)\Sequoia\LISSTMstController.
Other folders may also be selected. However, it is recommended that
the default folder be selected. After extracting the files the LISST-
Infinite software can be started from the Start menu.
Step 1: Start
LISST-Infinite
Master
Controller
Start the LISST-Infinite Master Controller Software by selecting Start /
All Programs / Sequoia Scientific / LISSTMstController, then select the
LISST-MstController to start the program:

6
Step 2: View the
Master
Controller Main
Screen
The main screen of the Master Controller shows. It is divided into 2
parts; the Control Panel Display and the Current Values Display
Control Panel
Display To the left is the Control Panel, which shows the current status of the
software (typically, is the software collecting data or not), the date and
time of the last sample, the time remaining (in seconds) until the next
sample, and the sample update rate.
Current Values
Display To the right is the Current Values display. This display shows how
many instruments are connected to the LISST-Infinite Master
Controller. In this example 5 instruments; 1 LISST-Infinite and 4 LISST-
HYDRO’s are connected and sampling. The Instrument serial number
is listed, together with instrument type (LISST-Infinite or LISST-
HYDRO).
For LISST-Infinite instruments, the total concentration in PPM by mass
(mg/l), the mean particle size (in µm), a dilution code (1 if no dilution
took place, 2 if a dilution took place) and the water level in the clean
water tank is displayed.
For LISST-HYDRO instruments, the total concentration in PPM by
mass (mg/l), the mean particle size (in µm), the optical transmission in
%, and the water level in the clean water tank is displayed.
Step 3: Select
Instruments to
Display in
Current Values
Display
Before we start sampling, we must select the instruments to be
displayed in the Current Values Display.
Select the Settings menu, then select the Instruments tab. The Settings
dialog box will show.

7
In the text box that reads ‘Instrument #1 Label’, enter a descriptive label
for Instrument number 1. In this example ‘Infinite206’ has been entered,
but the text could be more descriptive, e.g. ‘Siltation Basin, Entrance’,
or ‘Turbine # 1’. However, it is recommended that you always
include the instrument serial number in the label, as this makes
troubleshooting easier.
Then use the drop down menu to select the instrument type for
Instrument #1. Your choices are LISST-Infinite, LISST-HYDRO, LISST-
100X, or None. Select the appropriate instrument. If you select ‘[None]’,
no instrument will be displayed in the space for that instrument in the
Current Values Display. Continue labeling as necessary for the
remaining instruments.
Step 4: Set Time
Between
Samples
Next, on the Instruments tab you need to select the time between
samples. This cannot be less than 5 minutes. In the example above,
the time between samples has been set to 6 minutes.
The instruments do NOT all sample at the same time. They are
sampled sequentially. When Instrument #1 has completed its sampling,
Instrument #2 will begin and so on. The time between Samples is the
desired time between the start of sampling for instrument #1.
If several instruments are connected, the time to actually obtain a
sample for all instruments may be longer than the Time Between
Samples. In this case Instrument#1 will start sampling as soon as the
last instrument (in this case Instrument #5) has completed its sampling.
Click the OK button when you are satisfied with the Instrument Labels
and the Time Between Samples.

8
Step 5: Select 4-
20 mA output As an optional feature, the LISST-Infinite can output the total
concentration and average particle size as a 4-20 mA signal, for easy
incorporation into an existing SCADA system.
In each of the MIN fields on the 4-20 mA tab, enter the value for
concentration and particle size that you would like to correspond to a 4
mA output. For example, it makes sense to have a concentration of 0
µl/l and a particle size of 0 µm correspond to the minimum output signal
of 4 mA. A loss of signal would then result in negative concentrations
and particle sizes, which is physically impossible.
Likewise, in each of the MAX fields on the 20 mA tab, enter the value
for concentration and particle size that you would like to correspond to
a 20 mA output.
Step 6: Select
File Location Before we start sampling, we need to specify the location where the
data files from the instruments are to be saved. Select Settings, and
then click the File Location tab. The File Location dialog box appears.

9
Use the browse button to select the Directory where you want the data
from the instruments are to be stored, and then click OK.
Note that also the location of the LisstMstController.ini file is displayed
here. The instruments obtain their calibration constants from this file.
The user cannot change this location; it is displayed only for
informational purposes. In order to open and view the content of the
.INI file, click the View button.

10
Step 7: Select
Serial Port As the last setting to be completed before we can start sampling, we
must select the serial port that the instruments are connected to. Select
Settings, then click the Serial Port tab. In the dropdown menu, select
the Serial Port the instruments are connected to. Then click the OK
button.
Step 8: Start
Sampling
If the instruments have both been installed according to the installation
instructions (see separate installation manual), the clean water tank is
filled, the instruments are connected to the turbid source, and all
settings are as desired, it is now time to start sampling.
To start sampling, click the Start Button below the Control Panel display
in the LISST-Infinite Master Controller Software.
The Start button is the only way to start sampling with the LISST-
Infinite Master Controller Software.
Step 9: Stop
Sampling You will notice that the Start button turns into a Stop button after you
start sampling. To stop sampling, click the Stop button. If you start
sampling after having stopped it, the new data will be appended to the
existing data files.
Step 10:
Observe
Collected Data
When the sampling has been started, the Current Values Display will
update with the data from each instrument as they have been received
and processed by the monitoring PC.
The system will display warning symbols and messages as needed
(see warnings and maintenance section).

11
The last sample obtained from each instrument is available for viewing
on the Current Values Display. In the example below, Instrument #1
has completed its data collection, Instrument #2 is currently acquiring
data, and instruments #3-5 are pending.
Step 11: Detailed
Data View It is possible to more detailed view the data from the last sample that
was obtained by the LISST-Infinite Master Controller Software. From
the menu bar, select Display, then select if you want to display the
detailed size distribution, the raw data or system values from an
individual instrument. In this example, we want to view the detailed size
distribution.

12
Next, you have to select the instrument you want to view. In this
example, we want to view data from instrument #3.
Step 12: Display
Particle Size
Distribution of
last sample
The detailed size distribution for the last sample from Instrument 3 then
displays. The numbers on the Y-axis are the sediment concentration in
ppm by mass (equivalent to mg/l), and the numbers on the X-axis are
the 32 size classes for the LISST instruments (1.9-381 µm; 0.0019 –
0.381 mm).

13
If you are interested in knowing the exact concentration in a size class
you can move the mouse to the blue bar on the size class of interest
and hold it there for a second. The other bars will turn light blue and the
actual concentration in the selected size class will display. In the
example below, the concentration in size class 13 is 28.15 ppm.
Step 13: Display
Raw Data of last
Sample
If you click the Raw Data tab (or select Display Raw Data from the
Display Menu), the uncalibrated raw data from the last sample will
show. This can be useful for troubleshooting and to get an idea of the
signal-to-noise ratio in the sample.
In the Raw Data display, the blue bars show the signal level of the last
sample (in units of digital counts). The green line (circles) is the factory
background and the red line (triangles) is the current background. The
background measurements are always obtained before a sample, using
water from the clean water tank.

14
If you are interested in knowing the exact value of the raw data on a
detector you can move the mouse to the blue bar on the detector of
interest and hold it there for a second. The actual value of digital counts
on the selected detector will display, as shown in the example below.
Step 14: Display
System Values
for last Sample
If you click the System Values tab (or select Display System Values
from the Display Menu), the auxiliary data from the last sample will
show. This can be useful for troubleshooting and to get an idea of the
overall health of the instrument.
Step 15: Viewing
Time History
(Strip Charts) of
Concentration
Once the sampling has been started and the LISST-Infinite Master
Controller Software is running, you might be interested in viewing strip
charts from the individual instruments, showing the time history of the
concentration. For this purpose we use the LISST-Infinite Monitor
Software, so proceed now with sections 2.2.2 and 2.2.3 describing the
use of the LISST-Infinite Monitor Software and its use in Monitor Mode
and Archive Mode.
This manual suits for next models
1
Table of contents
Other Sequoia Measuring Instrument manuals

Sequoia
Sequoia LISST-Tau User manual

Sequoia
Sequoia LISST-200X User manual

Sequoia
Sequoia LISST-200X User manual

Sequoia
Sequoia LISST-PORTABLE XR User manual

Sequoia
Sequoia LISST-VSF User manual

Sequoia
Sequoia LISST-VSF User manual

Sequoia
Sequoia LISST-100X User manual

Sequoia
Sequoia LISST-Deep User manual

Sequoia
Sequoia LISST-100X User manual

Sequoia
Sequoia LISST-200X User manual