7
Release 01/2012
Chemical reactions follow an optimal course only within a certain pH
range. The reagents contained in the test kits produce an adequate buf-
fering of the sample solutions and ensure that the pH optimal for the reac-
tion in question is obtained.
Strongly acidic (pH < 2) and strongly alkaline (pH >12) sample solutions
can prevent the pH from being adjusted to an optimal range, since under
certain circumstances the buffering capacity of the test-kit reagents may
not be sufficient. Any necessary correction is made by the dropwise addi-
tion of diluted acid (reduces the pH) or diluted lye (raises the pH), testing
the pH with suitable indicator strips after each drop is added. The addition
of the acid or lye results in a dilution of the test solution. When up to five
drops are added to 10 ml of sample, the change in the volume can be
neglected, since the resultant error is lower than 2 %. The addition of larg-
er quantities should be duly considered by adjusting the sample volume
accordingly.
The specified pH values for the sample solution and, wherever applicable,
for the measurement solution are defined in the respective package
inserts and in the analysis instructions in chapter 3 of the manual.
2 Photometric Test Kits
2.2.2 Influence of pH
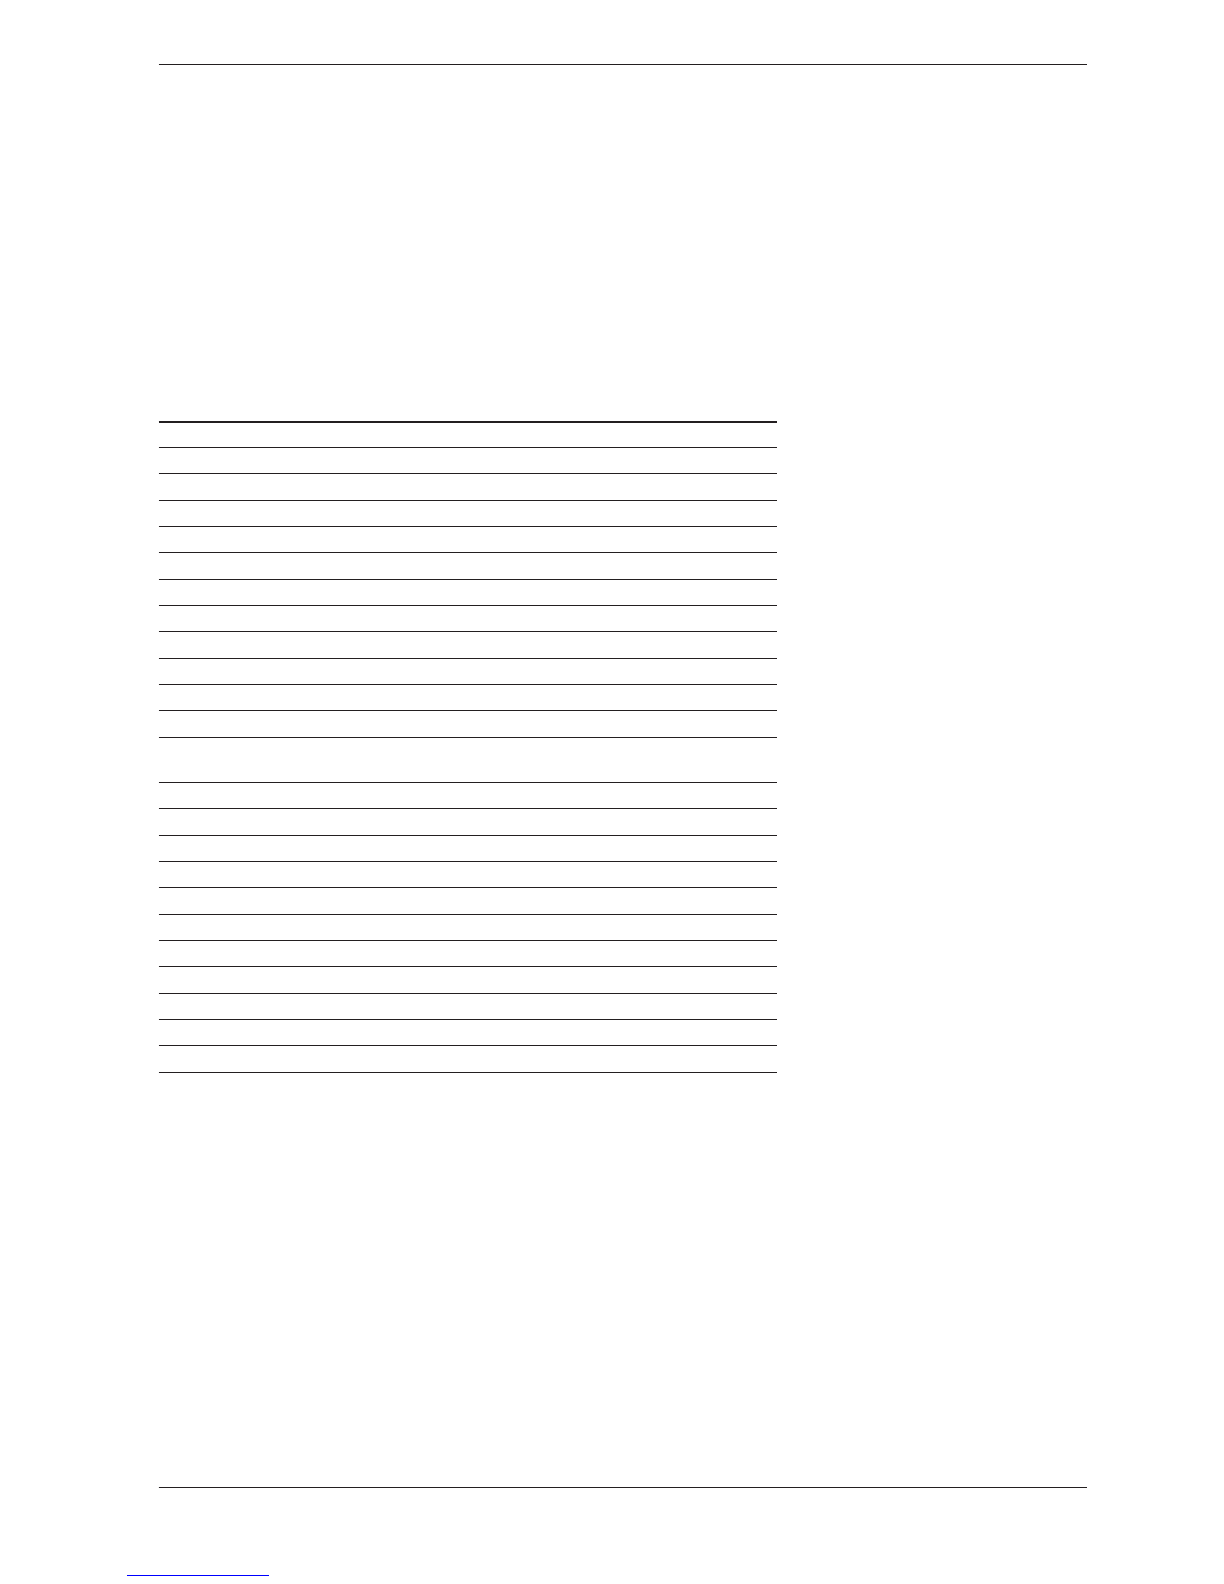
The temperature of the sample solution and the reagents may have an
effect on the color reaction and thus on the measurement result
.
The typi-
cal temperature course is illustrated in the figure.
If the sample temperature is lower than 15 °C, false-low results must be
reckoned with. Temperatures exceeding 30°C generally influence the sta-
bility of the compound that is formed in the reaction. The optimal tem-
perature for the color reaction is stated in the package inserts of the
respective Spectroquant®test kits.
Attention! After thermic decomposition procedures, the determina-
tion of COD or total contents of nitrogen, phosphorus, or metal, a
sufficient waiting time must be allowed for to permit the solution
cool to room temperature.
2.2.3 Influence of Temperature
Temperature (°C)
Absorbance
20 40
10 30
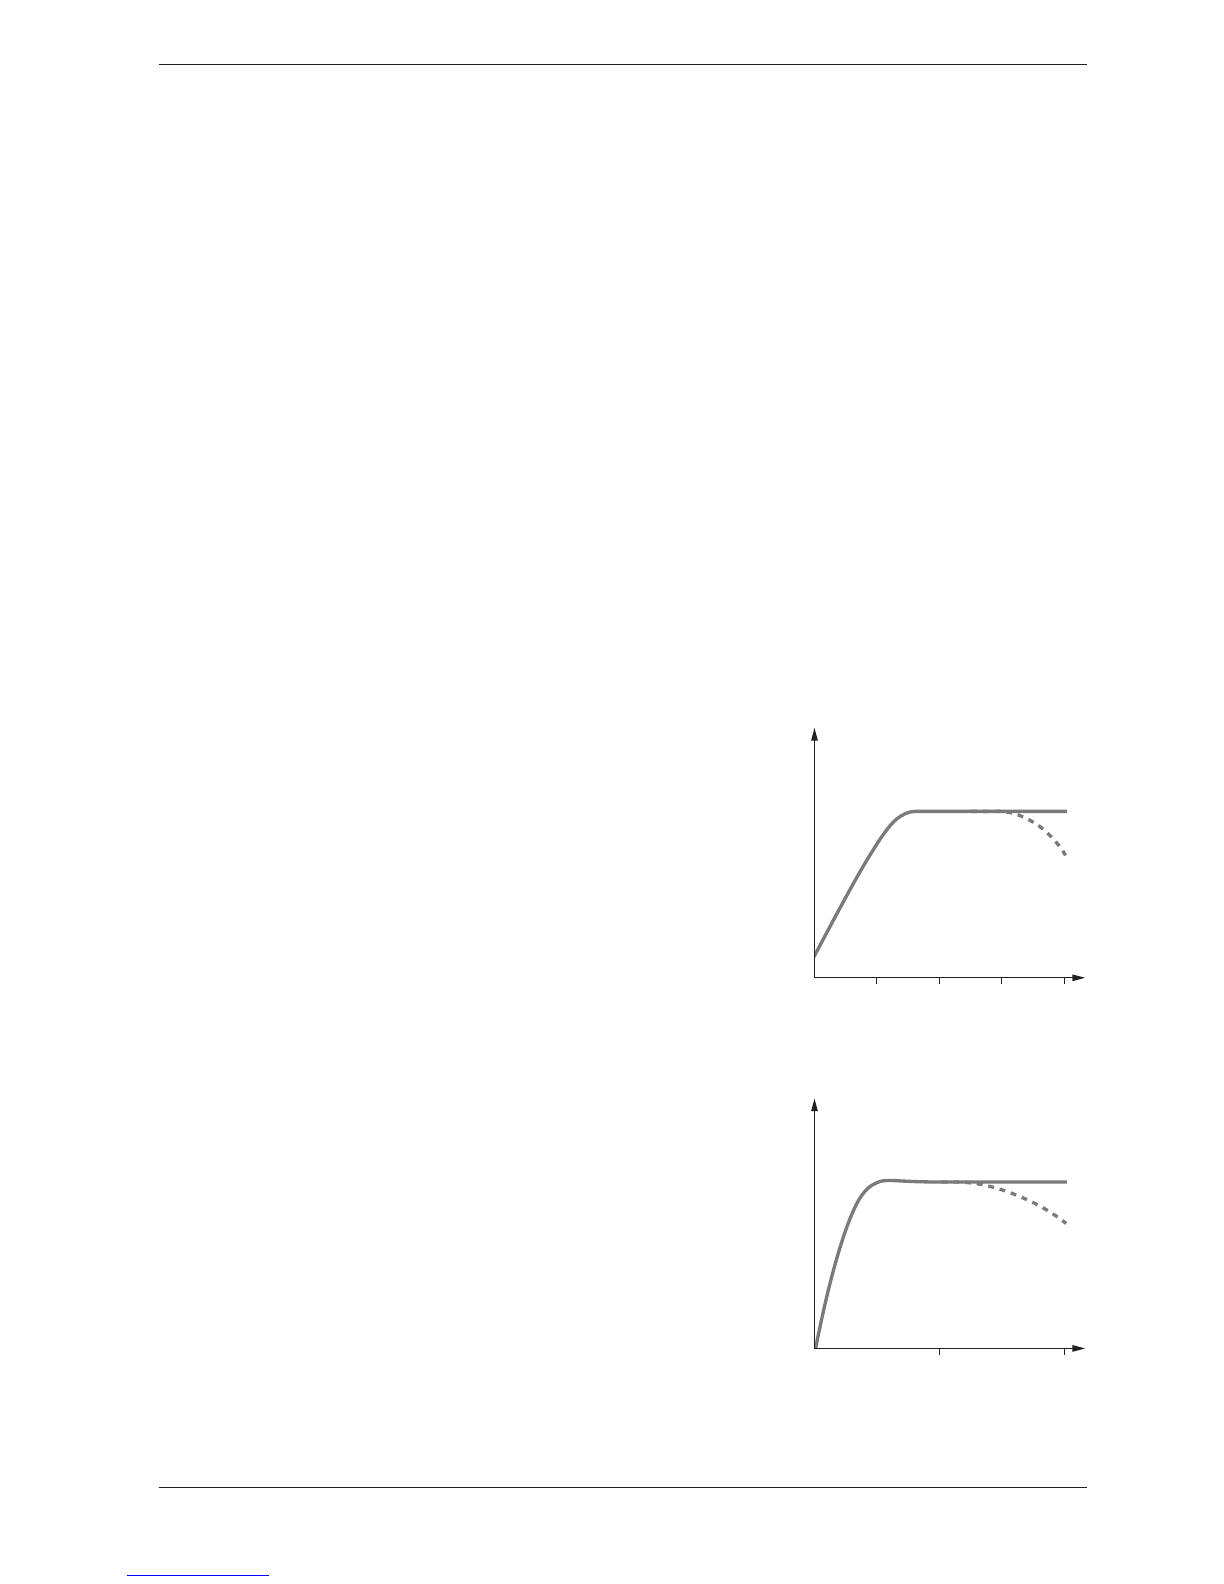
Most of the color reactions require a certain time to reach the maximum
color intensity. The solid curve in the figure at the right gives a schematic
impression of a typical time course. The behavior of relatively instable col-
or reactions with time is shown by the dotted curve.
The reaction time specified in the working instructions refers to the period
of time from the addition of the last reagent until the actual measurement.
In addition, the package inserts for the individual test kits also state the
time interval in which the measurement value does not change. The maxi-
mum time interval is 60 minutes; this time should not be exceeded, even in
the case of stable color reactions.
2.2.4 Time Stability
Reaction time (minutes)
Absorbance
30 60
photoLab®Series