BRUEL & KJAER 4409 User guide

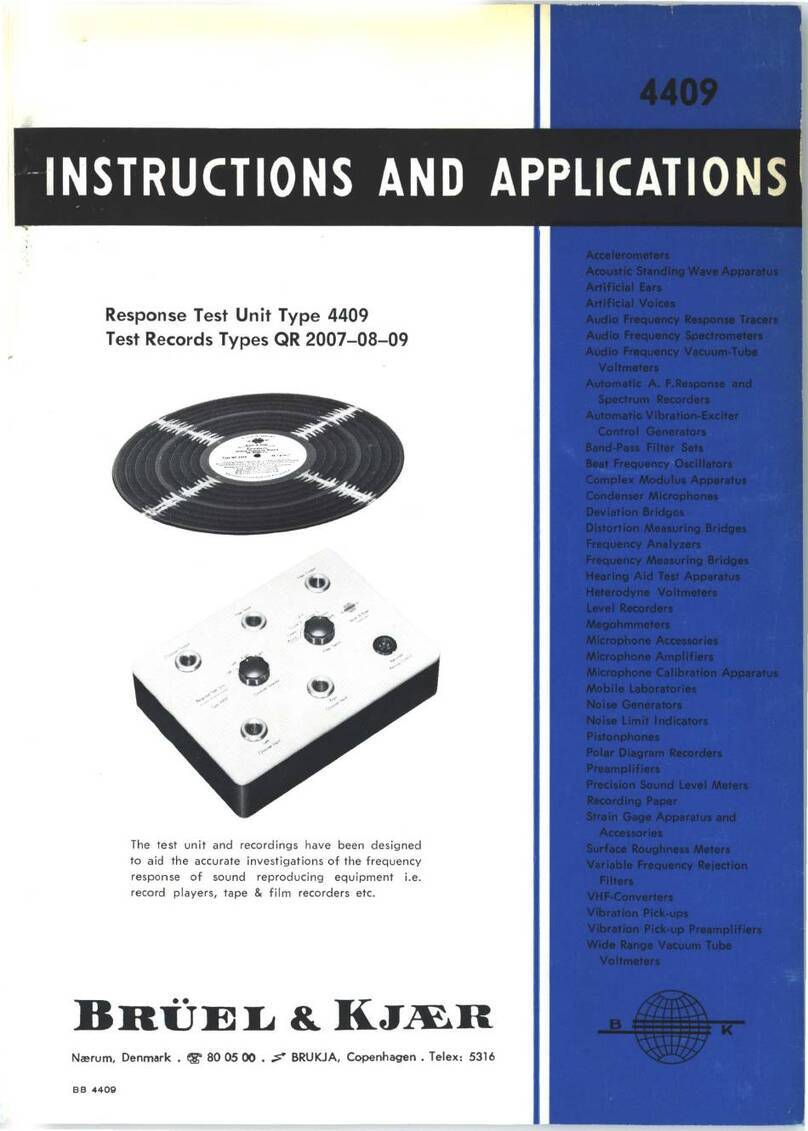
Response Test Unit Type 4409
Test Records Types
QR
2007-08-09
The
test
unit
and
r
ecordings
have
been
designed
to
aid
the
accurate
investigat
i
ons
of
the
frequency
re
sponse
of
sound
reproducing
equipment
i.e.
record
~Iayersl
tape
& film
recorders
etc.
BRUEL
&
KJ.N..H
N",rum,
Denmark.
I!E
800500
.
.;:>"
BRUKJA, Cop
enhagen.
Telex: 5316
Be
440Q

Response
Test
Unit
Type 4409
Test Records
Types
OR
2007
-~09
FEBRUARY
1964

Contents
1. Description . . . . . . . . . . . . . . . . . . . . . . . . . . . . . . . . . . . . . . . . . . . . . . . . . . . . .
..
3
Purpose
of
the
Equ
ipm
ent
. . . . . . . . . . . . . . . . . . . . . . . . . . . . . . . . . . . . . . . .
..
3
Description
of
the
Test
Records
...
.
...
.....
.
.............
.
.........
4
General.
. . . . . . .
..
. . . . . . . . . . . . . . . . . . . . . . . . . . . . . . . . . . . . . . . . . . . . . . .
..
4
Recording Characteristics
...........
...
......
..
.
..
. .
..
.
..
. . .
.....
..
9
Recorded
Level
Tolerances
.............
.
..
.....
.
.....
.
..
.........
.
11
Response
Test
Unit
Type
4409
..
......
....
....
.
......
..
.
......
....
..
13
Channel Selector
.......
...........
....
.......
....
......
..
.......
. . 14
Equalizing Filter
........
....
.
..
....................
.
..
.
...........
14
Synchro
-Starter
...............
..
.........
..
...
.
..
..
..
.
............
14
General Description
......
....
.
..
.
....
..
. .
..................
.
.......
14
Functioning .
......
...
. . .
..
.....
...................................
16
2. Operation
................
......
..
.
................
.
...
..
.........
17
Practical
Hints
for
Use
of
the
Test-Records
.....
. .
..
.
..
...
......
...
..
17
Aut
omatic
Frequency
Response
Plotting
...
.
...
.
.....
..
.
......
. .
....
17
Automatic
Gliding
Frequency
Cross-Ta
lk
Measurements
.
.............
19
General .
..........................................................
19
Operating Procedure
........
.
...
. .
....
..
.
......................
...
20
Synchronous
Filtering
Adjustment
.
...
...
...
..
...
. .
........
.
....
.
..
. 22
Automatic
Distortion
Measurements
.............
..
........
.
........
25
Examples
of
Practical Results
.....
...
....
.
......
.
.. ..
. . .
... ...
.
....
26
Use
of
th
e Te
st
Record
QR 2008 .
.....
..
....
.....
.
....
..
.........
.
..
28
Spot
Frequencies ...
....
.....
..
.
.........
..........
................
28
1 Kc/s Reference
Tones
.
....
..
.
....................................
28
100
C/S
Tracking
Test
................
.
.....
.
.. ..
.....
.
..
......
.
....
28
Tone
Arm
Resonance
.....
.
...
..
..
......
....
.
...
.
... ...
.....
..
.....
29
Test
of
Tape
Recorders
etc.
....
...
.........
.
....
..
.
..
.
........
.
.. ..
30
Synchro-Start
of
a
Continuous
Recording
...
........
..
..
.
............
33
Specifications .
............
....
.
......
.
.....
.
............
...........
..
34

1.
DESCRIPTION
1. Description
Purpose of the Equipment.
Th
e Response Test U
nit
Type 4409 is
int
ended for use
with
the B & K a
ut
o-
ma
ti
c fre
qu
en
cy
res
pon
se plotting e
quipm
e
nt
wh
en investigating
th
e fre
qu
ency
r
espo
nse of so
un
d re
pr
o
du
cing e
quipm
ent.
Fi
g.
1.
1 shows an example in
whi
ch the
44
09 a
nd
a test record are
in
vol
ve
d
in
th
e testing of a stereo
ph
onic
record
player.
Le
vel recor
de
r
Fi
g.
1.1. Meas
uring
se
t-up
for a
ut
om a
ti
c plo
ttin
g
of
th
e frequen
cy
r
espo
nse
of a stereopilOnic reco
rd
play
er.
The 4409 fulfils
thr
ee differe
nt
fun
ct
io
ns:
(a) cha
nn
el sel
ec
ti
on
in
th
e case of stereo
ph
onic equipme
nt
either
man
ually,
wh
en
o
nl
y
one
cha
nn
el is inves
ti
gat
ed
,
or
a
ut
omatically
at
a
recur
ing
fr
e-
quen
cy
of
1.
2 cis for a
ut
omatic cross-ta
lk
or co
mp
arison meas
ur
eme
nt
s.
(b) e
qnali
zation, by differe
nt
RC filters,
of
th
e recording
cha
r
acter
istic of the
test
reco
rd.
(c)
sync
hr
onization
of
th
e pape
r-driv
e of
th
e Level Recorder
Type
23
05 with
th
e reference r
ec
ord
ings (reco
rd
or
tap
e)
und
er re
pr
o
du
ct
ion.
It
is
thu
s possible to a
ut
omatically
pl
ot
th
e frequency response
of
the sound
re
produ
cing
eq
uipm
ent. A typical expe
rim
e
nt
al result is shown in Fi
g.
1.2.

1.
DESCRI
PT
ION
Wh
ere
th
e
recorder
is
int
egrated
with
th
e re
produc
er, as
in
th
e
case
of
tap
e
reco
rd
er
s,
motion
pictur
e
systems
etc., refere
nc
e reco
rdin
gs are taken
from
th
e consta
nt
voltage
output
of
a
generator,
but
in
the
cas
e
of
phonogr
a
ph
testing,
accurate
refere
nc
e
disc
r
ec
ordin
gs
are
ne
eded.
The
Gliding
Frequency
Reco
rdin
gs
Type
QR
2007 a
nd
2009
are
especially
designed
for
th
e
purpo
se
of
fr
e
qu
e
nc
y res
pons
e investiga
tion
.
They
provide
OOODOODaOODDOOOODOOO
OOO
OOODODOO
aOOOQOO
OOOOoooooooo
"':!!'.'
."
~
............
......,.....
.....
.
.....
1(1
:IS
........
-
--
..
StereophoniC
piCk.
up
type
«I
Z
Ortof
on
SPII.G
No 1
Fil
ter
l in"
OR
2007
Mod1
~
----
~~-
--
.,
LUoo.r.,
__
_
,...
lOdS
::..s,.,~
.
~f_s..
...
,-
O
OIO
QP
1123
10
Fi
g.
1.2.
Typical
ex
perimental result obtained
by
means
of
ti
le se
t-up
of
Fig.
1.1.
(Test
of a
high
qllality stereophonic head
pr
esenting a certain unbalance).
The total duration
of
one plot is 35 sec. between
th
e
instant
wh
en
the
pick-up
is put d
ow
n on
th
e record QR 2007
and
th
e ins
tant
wh
en
th
e set-up is r
ea
dy
to start a new plot.
co
ntinuou
s
frequency
sweeps
fr
om
20
cis to
20
kc
l
s,
with
late
ral
mod
ul
a
ti
on
on
the QR 2007
and
left, rig
ht
, late
ral
, ve
rtical
modul
ations on
th
e
QR
2009.
The
Pickup
Test
Reco
rd
Typ
e
QR
2008 i
s,
on
th
e
ot
her ha
nd
, designed
for
meas
ur
eme
nt
s
at
fixed frequencies
and
for
ton
e a
rm
res
on
ance
investigation
s.
It is
int
e
nd
ed
for
pick-Up design
work
,
and
also
for
general
purpo
se chec
ks
in
com
bin
a
ti
on
with
the gliding
fr
e
qu
e
ncy
reco
rds
wh
en c
ur
ve
plotting
e
quipm
e
nt
is
not
ava
ilable.
Description
of
the
Tcst
Records.
General.
The
B & K
referenc
e recordings are delivered
in
box
es
containing
five ide
ntical
vinylite reco
rds
and
one
instruction
manu
al (Fig. 1.3).
Both
sides
of
eac
h
record
being
id
en
tical, a
total
of
ten sides
are
ava
ilabl
e,
a large enough
qu
a
ntit
y to g
uar
a
nt
ee a great
numb
er
of
pl
ay
ings
without
4

1. DESCRIPTION
alteration
of
the
characteristics.
This
number,
however, is
greatly
dependent
on
th
e
care
exercised in
th
e use
of
the
records.
By
conserving
one
side as a
reference, it is possible to
check
on
th
e service
lif
e
of
each
record
in
use.
Fig. 1.3. Gliding
Frequency
Recordings
Type
QR 2007.
The
cutting
process and
th
e
dimensions
are in
accordance
with
the
Recor.:-
me
ndation
of
th
e
Int
erna
tional
Electrotechnical
Commission (
lEC
98/98-1)
recogniz
ed
by
most
countries.
The
detailed
specifications
are
given
at
the
end
of
this
manual.
The
reproduction
of
th
e label
of
the
QR 2007 (Fig. 1.4)
and
the
photograpb
of
a
section
of
th
e
record,
illuminat
ed
by
a grazing
light
beam
(Fig. 1.5),
s
how
th
e
exact
composition
of
the
recordings
.
The
QR
2008 a
nd
QR
2009
are
desc
rib
ed in
the
same
way
by
figures 1.6
through
1.9.
The
original
sinusoidal
signal
used
for
recording
th
e
disc
tracks
was
obtained
from
a B & K B
eat
Frequency
Oscillator
with
especially
low
distortion.
For
the
r
ecor
din
g
of
th
e gliding
frequency
bands
the
frequ
e
ncy
of
the
signal
was
vari
ed
according
to a
fun
ction
of
time
which
was
purely
logarithmic
within±
2.2 %
± 1.3 cis.
This
tolerance
is e
qual
to
th
e
tolerance
on
the
de
termination
of
the
recorded
frequency
when
using
the
Gliding
Frequ
e
ncy
Records
at
th
e exact specified
rot
a
tion
speed
(45
rpm
)
and
assuming
a
logarithmic
sweep.
5

1.
DESCRIPTION
All rights res
erv8a
Briiel & Kjan
Copenhage
n Denmark
Monophonic
Gliding
Frequency
Record
20-20000
cIs
Type
OR
2007
o
45
r.p.m.
6
Frequency Sweeps: logarithmic
20
cIs to
20
kc/s in
15
seco
nds
Start Marking
(20
cIs point): Cease of
the
1 kc/s
si
gnal preceeding each ba
nd
Recording Characteristic:
lE
e Standard
No.3
without treble emphasis
(constant velocity above 1 kcfs) .
Recorded Velocity at 1
kc
/s: 3.16
em!s
r.
m.s.
Bands
1
to
10:
lateral cut
/63695
Fi
g.
1.4.
La
bel of
th
e QR 2007.
10
QR
2007
Bands 1 to
10
: A B
20
cis
20
kc
/s
8/9 octave per
re
v.
Fi
g.
1.
5. Section of tile QR 2
00
7 sh
ow
ing tile succession of
glidin
g fre
qu
ency
ba
nd
s
pr
eceded
by
a 1
kc/s
sta
rt
a
nd
reference signal.

AU
r
igh
ts
reserved
Briiel & Kjmr
Copenhagen
Denmark
Pick-up
Test
Record
Section
1
ve
r~~i~~
1~:
e
,~~~~j~~
~s~Oc
~
.
~~s~
i~2:i5
~ ~~d
k
ul~t
io
n
.
Sand
1:
45
° l
eft
modulation (A). Sand 2:
45
° right modulation (B).
Section
2 0
Section
3
Reference Tones, 1 kcls, 4 x 60
sec
. ' Lateral Tracking Test,
Velocity level : 2.24 cm/
sec.
rm
s
(45
0)
100
cIs
(A+
B), 5 x 15
sec
.
(3
.
16
cmls lateral or vertical)
Sand
1: 0.
00
1
cm
peak
amplitude
::~~
~
~
:~~
~
ff~t
(
~~)
::~~
~~
g
:
~
: "
..
Sand 3:
l
atera~
(A+B)
Sand
4:
0.004
..
Sand
4: vertical
(A-B)
SlInd 5: 0.005
..
Sect
ion 4
Vertical Tracking
Test
,
as
section
3 but
wi
th
vertical
(A-
B) modulation.
Section
5
Logarithmic Frequency
Sweep
s 10 cIs -100 cIs
in
161
/J
sec
.
Start
Marking (10 cIs point):
cessation
of the 1 kcls
sig
nal
R
ecorded
lever~~~~~~~t
~~~
l
i~~d~·0.OO
113
em
peak.
Sand
1: 45° left
(A)
Sand 3: lateral
(A+
B)
Sand
2: 45° right (B)
Sand
4:
vertical
(A
-
B)
Sect
ion 6
as
se
ction
1,
but
wit
h
sma
ll
groove
spe
ed
~.cord
.
",.~\
(63696
tJd on
ORTO
FON
e.o.U
\~
Fig. 1.
6.
Label 0/
th
e QR
20
0
8.
5sot
freguencies
2
-16-12.5-10
kc/s
(0
.6 cm/sec rms)
·1kc/s reference
tone
(3.16
cm/secl
(compliance) A+B
Tracking test 1
100
CIS
bands
of
increasing amp!. A
~
B
0.
001
to
0.005
cm
10-100
cIS
SWl!ePS
} A
constant amplitud B
(0.00113
cm
peak)
A+B
for tone arm
A-8
reSonance
as
first
section
}
~
QR
2008
2
3
4
5
6
(33h
rpm)
+61~2
1.
DESCRIPTION
Fig. 1.7. Section 0/
th
e QR 2008 sh
ow
ing
the
succession 0/ bands.
7

1.
DESCRIPTION
.
~::-
~
/
~
."
I Briiel &
Kjcer
Copenhagen Denmark
Stereophonic
Gliding
Frequency
Record
20-20000
cis
Type
OR
2009
o
45
r.p.m.
,6.
Frequency Sweeps: Logarithmic
20
cIs to
20
k
c/s
in
50
secon
ds
Start Marking
(20
cIs
p
oi
nt
):
Cease
of
the 1 kc/s
signal
preceeding each band
Recording Characteristic:
IEC
Standard N
o.3
without
treble
emphasis
(constant
vel
ocity
above 1 kc/s)
Recorded
Velocily.t
1 kc
/s:
2.24 em!s
r.
rn
.s. in
45
° modulation
(3.16
em
/s in lateral and
vertica
l m
odulat
ions)
Bands 1 and 5:
45
° left m
odulatio
n
(A)
Bands 2 and
6:
45
° right modulation (9 )
Bands 3 and 7: lateral modulation
(A+
B)
Bands 4 and
8:
vertica
l modulation
(A
- B)
Fig.
1.
B.
Label
of
th
e QR 2009.
A
-V-
S
~
AtS
~
A
S
A+S
A-S
Fig. 1.9. Section
of
the
QR 2009
showing
the
succession
of
gliding frequen
cy
bands preceded
by
a 1
kc/s
start and reference signal.
8

1. DESCRIPTION
Recording Characteristics.
Pick-ups
should
be tested
with
reference
to
the
internationally
recognized
characteristics
if
th
ey
are
int
en
ded
to
give co
nstant
output
as
a
function
of
frequ
ency. Gliding
frequency
records
s
hould
in
general
be
cut
according
to
the
recording
character
istics
shown
in
Fig.
1.10-bottom
.
In
the
case
of
the
B & K Gliding
Frequency
Records
, a
charact
e
ristic
as
shown
on
top
of
Fig. 1.10,
which
is
converted
by
an
e
qualizing
filter
in
th
e
measuring
chain
to
th
e
appropriate
characteristics
has
been
adopted.
The
reaso
n
for
the
high
fre-
quency
level
limitation
on
the
record
is
that
if
tru
e
reproduction
is
intended,
th
e
radius
of
curvature
of
the
modulated
groove
wall
must
re
main
apprec
ia
bly
larger
than
th
e
stylus
tip
radius
.
The
wave-length
be
ing
de
termined
by
the
chosen
groove
speed,
and
th
e
stylus
tip
radius
being
norm
alized
to
15-
18
fl
for
stereophonic
pick-ups
,
this
sets a
db
IIII
I I I I II
HttIT
11
11
1
::
0
"g
~
/ Recording Characteristic
0
".....
Gliding Frequency Records
ClR
2007 &
ClR
2009
II
IIII
I I I I II
IIII
I
r
: -20
20
f.- 50
100
200
500
1000
2000
10000 20000
20
r--
Type
1,409
Equilizing Filters Characteristics /
db IN
Filter
Switch pas: I.E
.C.
Curve 2, "
10
..
"
":I.E.C
. Curve 3
II
I I
r>-
Filter StitCh
pas.:
Lin.
.1:-::=':'
-
0 II
III
I I
~
~
_~
50
100
200 500
1000
2000 10000 20000
+:::
::
:1
:1:111
:1
::
=::1
:
:::::=::
:
::=::
TotaL
Characteristics I
-
(TfiS
,
f~12001/19+4t09I
H++t
+-+-f-
H+Ht
w
,,"-llri
+10
f-
H--f-jf++
++-
+
+-
+-+++++++--++-++
w!+.l1If-H
Fi
lter Switch pas. :
lin
.
~
O
f----
H+H+++-++-~
I
~\++~~~~--++~~_+H
~
.
~
_10f----
H +
H+
tl-+9-V
-t-+
-tFilter
.
SwitchP05
.:
I.E.G.
curve~
J
/'
I
..
II "I I " :
1.~
.
Ci
~
u
ll
e
l
~
-20
t==T-+-t-ttttl
I--t--t--++-t-t+lttt-III
I
-++-+-++
I
H+
11
1tt--H
II
III
I I
IIII
I
20
50
100
200 500 1000 2000 10000 20000
{.6
Z32~
Fig. 1.10. Recording characteristics available
when
using
the
Gliding Frequency
Recordings
in
connection
with
the
Response
Test
Unit
Type
4409.
The
curve
no. 3 is specified
by
the
International Electrotechnical
Commission
in its
publication
no.
98-1 for steI'Cophonic recordings.
9

1.
DESCRIPTION
maximum
limit
to
th
e
am
plitud
e
of
modulation
at
high
frequencies.
The
co
ndition
s
obtained
on
th
e B & K Gliding
Frequency
Records,
wher
e
th
e
re
corded
velocity is
limit
ed
at
20 kc/s to 3.5
cm
/s pe
ak
in
eac
h
channel,
are
illustr
at
ed
in
Fig.
1.11.
Bond 1
Bond 8
Pig. 1.11. Views
in
th
e plane 0/
modulation
showing
the
relative
dimensions
0/
th
e
maximum
allowed
tip
radius
and
the
minimum
radius
of
curvature
(! on
the
record QR 2009's
outer
and
inner bands presenting a
diamet
er
of
28.2 and 12.6
cm
respec
tiv
e
ly
at 20 kc/s.
Note
that
e is
proportional
to
the
square 0/
the
diameter
D (or
01
the
groove speed).
The
speed
of
rotation
being
45
r.p.m., i.e. 0.75 r.p.s.,
the
expression
for e is
_
n(0.75
D)2 _ 88
~
e-2 I v -
o.
f v
where
/ is
the
frequency
and
v
the
peak
channel
velocity (3.5
em
Is).
Th
e
advantage
of
th
e
standardized
recording
characteristic
is to give
the
optimum
signal-to-noise
ratio
by
incr
e
asing
the
reco
rd
ed a
mplitude
at
low
fre-
qu
encies,
where
th
e
rumbl
es a
nd
vibrations
of
th
e
turntabl
e
are
important
,
a
nd
th
e reco
rd
ed
velocity
at
hi
gh
fr
e
qu
encies
wh
e
re
th
e
surface
noise
increases
r
api
dly. Using
any
other
charact
e
ristic
will
result
in
a
decr
ease
of
the
overall
sig
nal-to-noi
se
ratio
after
correction
of
the
characteristic
by
an
equalizing
filter.
In
th
e
case
of
th
e B & K Gliding
Frequ
e
ncy
Records
th
e
signal-to-noise
ratio
is d
ec
r
ease
d by
about
6 dB
aft
er e
qualization
,
but
this
does
not
affect
the
measuring
possibilities.
In
addition,
the
correction
of
th
e reco
rding
characteristics
can
eas
ily
be
made
by
m
ea
ns
of
a
simple
RC
filt
er. Using
diff
e
rent
filters
enables
th
e selection
of
different
characteristics.
This
is
of
interest
since
there
are
diff
ere
nc
es
between
the
various
national
standards.
Using
a
suitable
filter, a
constant
recorded
ve
locity
reference
can
also
be
obtained
for
testing
electrodynamic
pick-ups
without
th
e
ir
associate
eq
ualize
rs
.
Thre
e
different
characteristics
are
thus
10

1.
DESCRIPTION
provided
by
the
B & K me
asuring
equipment.
See
Fig
. 1.10.
The
determination
of
the
correcting
filt
ers re
sults
immediat
e
ly
from
the
mathematical
definition
of
the
standard
c
har
ac
te
risti
cs:
1 1
10 log
(1
+w2
t12)
-10
log
(1 +
-
~
-
2
-
)
+
10
log
(1
+- 2- 2- )
w
-t
2 w t3
wh
e
re
w is
th
e
an
g
ular
fr
e
quency
and
t1
= 50 fls (c
urv
e 2)
or
75
fls
(curve
3),
t2
= 318 fls, t3 = 3180 fis.
Th
e reco
rding
characteristics
of
the
B & K tcst r
ec
ords
co
rr
es
ponds
to
t1
= 0,
t2
= 318 fls, t3 = 3180 fis.
As
seen
on
th
e
figur
es,
eac
h glidinG
fr
e
qu
en
cy
ba
nd
is
pr
ece
ded
by
a 1 kc/s
start
and
refer
ence
signal
lasting
a few se
conds.
The
starting
point
of
the
logarithmic
sweep
coincides
with
th
e
en
d
of
th
e 1 kc/s
modulation.
Th
e
purpo
se
of
this
1
kc
/s
signal
is,
in
addition
to
th
e de
termination
of
th
e
fr
e-
qu
encies
in
th
e
results
as
de
scribed
be
low
(sync
hr
oniza
tion
of
te
st
signal
and
reco
rding
paper
) to
allow
a
quick
a
dju
s
tm
e
nt
of
th
e m
eas
uring
chain
sen-
sitivity
to be
mad
e be
for
e
actual
m
eas
ur
eme
nts
are
taken.
On
all reco
rds
the
1
kc
/s
start
signal
is
modul
ated
lat
e
rall
y
(A
+B)
or
ve
rtically
(A
- B)
wh
en
pr
ece
ding
a
vertical
(A-
B)
band
.
Recorded Level Tolerances.
The
ac
curac
y
in
a
mplitude
of
th
e
reference
recordings
is
determin
ed to
within
0.5 dB
in
a
limited
fr
e
qu
e
ncy
ran
ge
by
th
e
optical
me
thod
of
th
e "
Filtered
B-line lig
ht
patt
e
rn
" refe
rr
ed to
in
th
e
American
Standards.
Over
th
e
whol
e
frequ
e
ncy
rang
e,
th
e
accuracy
is
checked
by
m
ea
ns
of
a
professional
ele
ctro-
dynamic
pick
-
up
espec
ially selected
for
this
purpose.
The
check
is
carried
out
at
two
diff
ere
nt
rotation
s
pe
eds
in
ord
er to
distinguish
th
e
non-linearities
of
th
e
pick-up
from
thos
e
of
th
e
record
its
e
lf:
a
change
in
rotation
speed
accompanied
by
a
corresponding
change
of
th
e
tim
e
constant
of
th
e e
qualizing
filter
,
produc
es a
fr
e
qu
e
ncy
tr
a
nslation
of
th
e
record
defects,
while
th
e fre-
qu
e
ncy
res
pons
e
of
th
e
pick-up
is
unchang
ed.
The
inv
estiga
tion
is
ca
rri
ed
out
both
on
th
e
nick
el "m
aste
r"
and
on
th
e vinylite reco
rds.
Th
e
flatn
ess
in
fr
e
qu
e
nc
y char
ac
teris
ti
c
obtained
in
serial
production
is be
tt
er
than
± 0.5 dB
from
100 cis to
10
kc
/s
and
± 1 dB
from
20 cis
to
16
kc
/
s.
Be
tw
een 16
kc
ls
and
20
kc
/s a
dip
in
the
fr
e
quen
cy
res
ponse
which
is
du
e
to
a
s
purious
resonan
ce
in
th
e di
sc
recorder
mi
g
ht
be
pr
ese
nt
and
th
e tole
rances
are
th
ere
for
e e
nlar
ged
as
shown
on
Fig
. 1.12.
Anoth
er
important
characteristic
of
th
e
stereophonic
test
records
is
th
e
upper
limit
of
th
e r
ec
orded
cross-talk
on
th
e
unmodulated
groove
walls
of
bands
A
and
B.
This
co
rresponds
to
th
e
separation
of
th
e
disc
re
cord
er
since
it
is
practically
unaffect
ed
by
disc
copying
op
e
rations
.
Th
e
determination
of
th
e
s
purious
cross-talk
in
th
e
pick-up
employed
for
checking
th
e
record
ed cross-
11

1.
DESCRIPTION
talk
can
also be
mad
e
by
comparison
between
two
tests
of
different
rotation
speeds, giving a
frequency
translation
of
the
characteristic
for
th
e
record
only
.
The
re
cord
ed cross-talk,
express
ed
in
dB
with
refe
rence
to
the
modulation
level, is
th
e se
par
ation between c
hann
el
of
th
e re
cording
.
The
minimum
se
paration
of
th
e QR 2009 is
shown
on
Fig. 1.13.
Th
e
toleranc
es
of
th
e Te
st
Re
cordings
Typ
e QR 2008
ar
e given
on
p. 5.
+4
db
o
-1
-4
UR
2009
·
OR
2007
-Logarithmic sweep
accurac~
:
. .
~
~
~
20
100
OR
200~
~
OR
2007
-=:
-
E
±2
.5%
±1c/s
~
-
-
..
-
1000
- -
10
000
20000
""62332
Fig. 1.12. Curves
showing
tIze
manufacturing
tolerances Wllicil include
both
th
e record itself
and
tlIe equalizing filter characteristics.
Th
e accuracy is best
for lateral
modu
lation
and
tlIe tolerances are
th
ere/ore
narrow
er for
th
e
o
db
-10
-20
-30
-40
EE
» .
20
R
ec
ord QR 2007.
A=
modulated
groove
wall
A=
8 =unmoduloted wall
(upper
limit
of
the:
reco
rds
crosstalk,
measured in 1/3 octave
_
filhrs)
a
~ ~
-
..
1
00
1
000
8
-
-
- -
10
000
20000
~~2333
Fig. 1.13.
Limit
of
cross-talk on tIle stere
ophonic
recordings
of
Type
QR 2009,
bands 1- 2
and
5-
6,
measured in dB witlI respect to 'tlIe recording level
(i.e.:
maximum
mea
surable clIannel separation).
N.B. Valid
only
wIz
en tlIe playing angle does
not
deviate muclI from tlIe
cutting angle (100 ± 5°).
12

1. DESCRIPTION
Response Test Unit Type 4409.
The
Unit
Type
4409
groups,
in
the
same
cabinet,
thr
ee
independent
sections
which
are
connected
as
shown
in
Fig. 1.15.
The
left
hand
knob
(Fig. 1.14)
relates
to
the
channel
selector
and
the
right
hand
one
to
the
filter section.
The
synchro-starter
is fully
automatic
.
The
unit
is
transistorized
and
the
pow
er
supply
is
tak
en
from
the
24 Volt
DC
circuit
of
the Level Re
cord
er
Type
2305 via the
multi-pin
plug.
Fig. 1.14. Response Test Unit
Type
4409.
4409
#62335
Fig. 1.15.
Block
diagram
of
the
4409.
(The
synchro-starter
is
only
connected
to
the
filter-input terminal
when
a DC power
supply
of
24 V is applied between
pins 1 and 4
of
the
multipin
plug).
13

1.
DESCRIPTION
Clwnnel-selector.
The
two-channel-selector
consists
of
a
low
noise
relay
driven
by
the
output
of
a bi-stable
multivibrator.
The
'
multivibrator
may
be
blocked
in
one
of
the
other
positions
by
setting
the
CHANNEL SELECTOR
switch
in
"left"
or
"
right
"
positions.
In
the
"left-right"
position,
an
automatic
switching
is
obtained
at
a
recuring
frequency
of
1.2 ci
s.
In
other
words
,
each
channel
is
connected
during
a pe
riod
of
0.4 seconds.
Transients
and
switching
times
are
shorter
than
0.02 seconds.
Equalizing Filter Section.
Fig. 1.10
shows
th
e
three
different
equalization
characteristics
provided
by
this
section.
They
are
selected
by
mea
ns
of
the
FILTER
SWITCH
which
also
ha
s
a
fourth
position
marked
"D
irect
"
wh
ere
the
filter section is
short-circuited
as
needed
wh
en testing
sound
reproducers
other
than
record
players
(e.g.
tap
e
reco
rd
ers).
The
filters
are
of
the
RC
type a
nd
are
designed
to
be
us
ed
as
external
filters
on
th
e B &
l{
ampl
ifiers
such
as
the
Microphone
Amplifier
Type
2603.
The
standard
characteristics
are
obtained
only
if
th
e test r
ecor
ds
are
rotat
ed
at
th
e
specified speed.
Synchro-startcr Section.
General Description.
The
purpos
e
of
this section is to
command
the
paper
drive st
art
of
the
Level
Recorder
Type
2305
at
th
e e
nd
of
the
1
kc
ls
start
signals reco
rded
on
the
test
records,
thus
automatically
e
nsuring
synchronism
between
the
instantaneous
test
frequ
e
ncy
on
th
e reco
rd
and
the
fr
e
quency
calibration
of
the
recording
paper.
Level Record er
Gear
PoPe!'
drive
r-il~;W~~~r-~g
C)
f---i
~
tLl
Automatic
113
octave
filter
switch
4-623&3
Fig. 1.16.
Block
diagram
of
the
equipment
for automatic frequency re-sponse
I and separation measurements.
14

1. DESCRIPTION
An
important
point
for
th
e
practical
f
eas
ibility
of
this
synchronization
is
that
the time
delay
of
the
pap
er
drive
start
should
be
negligible.
The
clutch
of
the
Level
Recorder
Type
2305,
as
schematically
outlined
in
Fig. 1.16, is engaged
when
no
current
passes
through
it
and
disengaged
wh
en
exc
ited.
It
is a
non-
slip device
and,
since
the
coupling
of
the
paper
driv
e
system
to the
continu-
ously
rotating
synchronous
motor
introduces
a negligible
variation
of
kinetic
ene
rgy
in
the
system,
the
start
of
the
paper
drive
occurs
practically
instantane-
ously
when
the
current
is
cut.
The
command
is
thus
mad
e
from
the
signal
recorded
on
th
e
test
disc
,
by
simply
actuating
a
relay
device
cutting
the
clutch
circuit
at
the
e
nd
of
the
start
signal.
This
is
perform
ed
by
the
synchro-
starter
whose
block
diagram
is
sketched
in
Fig.
1.17.
Type
2305 Type
H09
Filter
input
Fig. 1.17.
Block
diagram
of
the
automatic start/stop arrangement (Synchro-
starter
of
4409 + clutch circuit
of
the 2305).
The
scanning
speeds
of
both
th
e
disc
turn-table
and
the
Level
Recorder
paper
drive
are
tied
by
the
mains
frequency
and
no
mechanical
connection
is
needed.
This
allows
the
turn-tabl
e to
be
installed
freely
on
an
anti
vibration
support
which
is
an
important
point
for
pr
ecise
measurement.
The
starting
signal
is
applied
to
the
"F
ilter
Input"
terminal
of
the 4409,
and
should
have
the
following
characteristics
for
operating
the
starter:
Frequency:
Voltage:
Duration:
1000 cIs ± 100 cIs.
from
0.1 to 32 V r.m.s. (at 1
kc/s).
at
least
0.1 second.
Not
e:
By
means
of
a
relay
connected
in
parallel
with
the
clutch
of
the
Level
Recorder,
the
syncho-starter
is
only
connected
to
"Filter
Input"
when
the
connection
to
the
recorder
is
made
and
when
the
paper
drive
is
stopped.
15

1.
DESCRIPTION
Detailed Functioning
of
the
Relay Arrangement.
The
synchronous
motor
of
the
2305 is
running
continuously
and,
as
can
be
seen
from
Fig. 1.16
the
start
of
the
paper-drive
is
obtained
by
disconnecting
the
24 V
supply
across
the
clutch
coil. Since
the
relay
01
is
connected
in
parallel
with
the
clutch
coil,
the
synchro-starter
is
only
connected
to
"Filter
Input"
when
the
paper
drive
is
stopped.
The
relay
circuits
for
01,
02
and
03
are
all
sketched
in Fig. 1.17.
The
relays
are
shown
in
their
released
position.
Before
connecting
the
4409
the
Level
Recorder
should
be
started
by
setting
the
controls
as
shown
on
Fig. 2'
.1
and
2.2.
When
connecting
the
4409 to
the
2305,
the
relay
03
then
short-circuits
the
single
chart
push
button
which
otherwise
should
have
been
lifted
up
to
obtain
the
automatic
stop.
The
paper-drive
stops
as
soon
as
the
automatic
stop
switch
is closed
by
the
cam
and
the 24 V
supply
is
applied
to
the
crutch.
When
the
1000
cis
start
signal
arrives
through
the
Filter
Input,
the
relay
02
is energized
which
in
turn
causes
03
to
be energized
whilst
"Single
chart"
is stilI
short
circuited,
but
now
by
02.
When
the
1000
cis
start
signal ceases,
02
is released,
but
03
is still energized
since
its
coil
has
a
much
larger
resistance
than
the
clutch
coil
which
is fed
in series
with
it
from
the
24 V
supply.
The
short-circuit
across
"Single
chart"
is
therefore
interupted
and
the
clutch
is released,
starting
the
paper
drive.
03
is finally released
by
the
cam
releasing
the
automatic
stop
switch.
16

Operation
Practical
Hints
for
Usc
of
th
e
Test
Records.
General Instructions.
2.
OPERATION
The
test r
ecords
should
be
handl
ed
with
th
e
same
care
as
commercial
high
fidelity
LP
records
.
The
numb
er
of
playings
which
can
be
mad
e
without
alteration
of
th
e
characteristics
is
greatly
dependent
on
th
e
care
exercis
ed
in
the
use
of
the
records.
By conserving one r
ecord
side as a reference,
it
will
be
possible
to
check
on
the
service life
of
eac
h
record
in
use.
H is
of
course
of
prim
e
importance
to ch
eck
th
e
reproducing
stylus tip
and
th
e
tracking
weight
befor
e
eac
h reco
rd
play
in
g.
The
tip
radius
should
be between
12
and
18
ft
(0.0005
and
0.0007
inch
.)
or
26
It
(0.001
inch
.)
in the case
of
lateral
bands,
with
an
included
angle
of
40° to
50
°.
The
records
are
cut
in
acco
rdance
with
the
Recommendations
of
the
IEC
which
are
recognized
by
mo
st
coun
tries.
All
modulations
are
sinusoidal
with
negligible
distortion.
Finally,
th
e r
ecor
ds
should
be
carefully
protected
from
dust.
Th
e use
of
"antistatic"
cleaners
is reco
mmend
ed.
Turn-table.
When
re
producing
heads
are
to be tested
separately,
a good
professional
turn-
table
should
be
selected, especially
with
r
egar
ds
to
investigations
at
low
frequenci
es,
wher
e
the
influence
of
wow
and
rumble
is
predominant.
The
rotating
speed
must
be
adjusted
with
great
care
by
stroboscopic
comparison
with
the
mains
frequency.
Finally,
it
is
recommend
ed
to isolate
the
turn-table
and
possibly
also
th
e
preamplifier
from
external
vibrations.
This
may
be done
very
efficiently
by
suspending
the
tabl
e
supporting
the
two
devices
from
the
ceiling
by
means
of
four
rubber
tub
es. (Ano
th
er
possibility
is
the
use
of
el
ectrical
high
-
pass
filters).
Use
01
rotating speeds otller tllan nominals.
Since
the
test
frequ
e
ncy
and
velocity levels
are
proportional
to
th
e
rotating
speed,
it
is possible to
extend
the
frequency
range
of
the
tests
by
using
different
rotating
speeds.
How
ever, it is
then
necessary
to
modify
th
e RC equalizing
filters e
mploy
ed
according
ly,
by
mea
ns
of
a
proportional
change
of
the
capacitors.
Automatic
Frequency
Rcsponse
Plotting.
In
the
following,
an
example
of
operating
procedure
for
au
t
omatic
frequency
respons
e
plotting
by
means
of
the
B & K
In
s
trum
en
ts
Type
2603, 4409
and
2305 is given.
17

2.
OPERATION
It
is esse
ntial,
however
,
that
th
e
instruction
manual
of
eac
h
instrument
be
r
ea
d
carefully
before
using
th
e
equipment.
1) Pl
ace
th
e reco
rd
player
on
a
vibration
free
tabl
e.
Connect
and
set
the
apparatus
as
shown
in
Fig.
2.1. Select
th
e des
ired
reco
rding
characteristic*)
Pick-
up
under
t
est
Cont.
Record
.
o 0
100
10
fig. 2.1.
Set-up
for
automatic
frequency
response
plotting
with
a QR 200,
reco
rd.
When
using a QR 2008
or
2009
the
adjustments
are
the
same
witll
aception
of
the
settings
of
th
e
Level
Recorder,
which
then
should
be
a.
mown
on Fig. 2.2. A single lead is reco
mm
e
nded
between
Amplifier
ana
Hecorder since
the
ground
connection is already
made
by
th
e
synchro-starte,
conn
ection.
by
means
of
the
4409's
FILTER
SWITCH.
Th
e
pap
er
drive
controls
of
the
2305
are
set
to
"
on",
"start",
"
forward
".
2)
Pre
liminary
Adjustments.
It
is
convenient,
in
order
to
ensure
that
the
correct
automatic
stop
position
is a
ttain
ed,
to
pl
ay
a
record
band
before
actual
m
eas
ur
e
ments
are
taken.
In
addition
it
wil! be
possible
,
during
this
pr
e
paratory
playing,
to
adjust
the
sensitivity
of
the
measuring
instruments.
Proceed
as
follows:
a)
Place
the
pick
-
up
on
a l
ead-
in
groove
for
playing
th
e
selected
band.
b)
If
the
automatic
synchro-starter
does
not
operate
after
a
few
seconds
playing,
check
that
th
e
speed
of
rotation
is
45
r.p.m.
and
switch
METER
RANGE
on
the
2603
to
10 mY. Also
check
that
the
pick-up
und
er
test
is
in
normal
condition
.
*)
Th
e
recording
c
hara
c
tcristic
should
be selected
in
order
to o
bt
ain a
constant
reference
level..
With
amplitude
sensitive
pick-ups
such
as piezoelectric devices
or
other
types
with
built
in
equalizers,
th
e positions "lEC Curve 2
or
Curve
3"
should
be used.
(The
lEC specifics
Curve
3 for
stereophonic
recordings).
With
velocity sensitive
pick-ups
such
as e
lectr
odynamic devices, the position "Lin."
which
gives
constant
recorded
velocity
conditions should be used.
18

2.
OPERATION
c)
Whil
e playing
the
frequ
e
ncy
sweep,
set
METER
RANGE to
the
position
giving
normal
point
er deflection
on
th
e
meter
throughout
the
frequency
sweep.
Then
give
th
e Level Reco
rd
er
writing
stylus
a
convenient
de-
flection
by
means
of
the
INPUT
ATTENUATOR a
nd
INPUT
POTENTIO-
METER knobs.
d)
Finally,
when
the
paper
driv
e is s
topp
ed,
shift
the
paper
by
means
of
the
Finger
Whe
el Z (see
the
2305 Manual)
until
th
e
writing
stylus
rests
on
the
20
cis line.
Approach
the
re
quired
position
in
the
reverse'
direction.
3)
Before
starting
th
e a
utomatic
fr
eq
u
ency
response
plot,
check
that
the
rotation
speed
of
th
e r
ecord
player
is
exac
tly
45
r.p.m.
when
load
ed
by
th
e
pick-up
to be tested, e.g.
when
tracking
a groove.
4)
Engage
th
e
pick-up
on
the
lead-in
groove
of
th
e
band
which
has
been
selected
for
the test.
During
th
e
first
few
seco
nds
(playing
of
the
start
signal)
it
will
be
possible to fine
adjust
th
e 1 kc/s
deflection
if
necessary.
The
plotting
of
th
e
fr
e
qu
ency
respons
e
tak
es
place
automatically
when
the
1
kc
/s s
tart
signal ceases,
and
wh
en
the
paper
drive
stops
on
th
e 20 c/s line
of
the
next
chart
,
th
e set-up is
ready
for
another
plotting
without
any
further
a
djustment.
Note: Use
of
25
or
10
dB
Potentiometer
for
detail
ed
fr
e
qu
e
ncy
respons
e in-
vestigations.
The
only
modification
to
be
mad
e
in
this
case
is
that
the
POTENTIOMETER RANGE
knob
of
the
Level
Recorder
has
to
be
shifted
from
"50" to "25"
or
"10" respectively.
Play-back
Losses.
At
high
frequencies,
the
accele
ration
which
is
communicated
to
th
e re
producing
stylUS
attains
a few
hundr
ed g (gravity).
Consequently,
even
if
the
stylus
mass
has
been
reduced
to a
minimum,
th
e
reaction
of
the
stylus
on
the
record
may
cause
non-n
egligible elastic
deformations
of
the
groove walls.
This
phenomenon
which,
in
most cases
corresponds
to
a
reduction
of
amplitude
and
velocity
of
the
stylus
movement, is
commonly
called
"Play
back
loss".
The
play
back
losses
are
gre
atly
depe
nd
e
nt
on
the
construction
of
the
re
pro-
ducing pick-up.
They
ma
y be
negativ
e
as
well
as
positive
and
cannot
be
determined
without
accurate
knowledg
e
of
th
e m
ec
hanical
constants
involved.
A
theor
etical investigation
of
th
e
phenomenon*)
shows
that
play
back
losses
(or gains) increase
rapidly
with
fr
eq
u
ency
in
all
cases.
Practically,
play
back
losses
attaining
a few dB
at
20
kc
/s
are
observed
when
tracing
the
inner
bands
of
the
Gliding
Frequency
Records
with
commercial
pick-ups
of
good
quality.
Automatic Selective Cross-talk Measurements.
General.
Gliding
frequency
cross-talk
meas
urem
e
nts
are
carried
out
by
means
of
the
record
QR
2009
and
the
set-up
of
Fig. 2.2.
When
testing good
quality
pick-Ups,
it
will
be
noticed
that
the
inherent
surface
*)
See B &
]{
Technical Review
No
3-
1962
,
Appendix
A.
19
Other manuals for 4409
1
Table of contents
Other BRUEL & KJAER Test Equipment manuals

BRUEL & KJAER
BRUEL & KJAER 1013 User guide

BRUEL & KJAER
BRUEL & KJAER 4128 Operation manual

BRUEL & KJAER
BRUEL & KJAER 4212 User guide

BRUEL & KJAER
BRUEL & KJAER 4292 User guide

BRUEL & KJAER
BRUEL & KJAER 5998 User manual
BRUEL & KJAER
BRUEL & KJAER 4914 User manual

BRUEL & KJAER
BRUEL & KJAER System V User manual

BRUEL & KJAER
BRUEL & KJAER 4226 User manual

BRUEL & KJAER
BRUEL & KJAER 4297 User manual

BRUEL & KJAER
BRUEL & KJAER 4912 User manual