manuals.online logo
Brands
  1. Home
  2. •
  3. Brands
  4. •
  5. Calsense
  6. •
  7. Controllers
  8. •
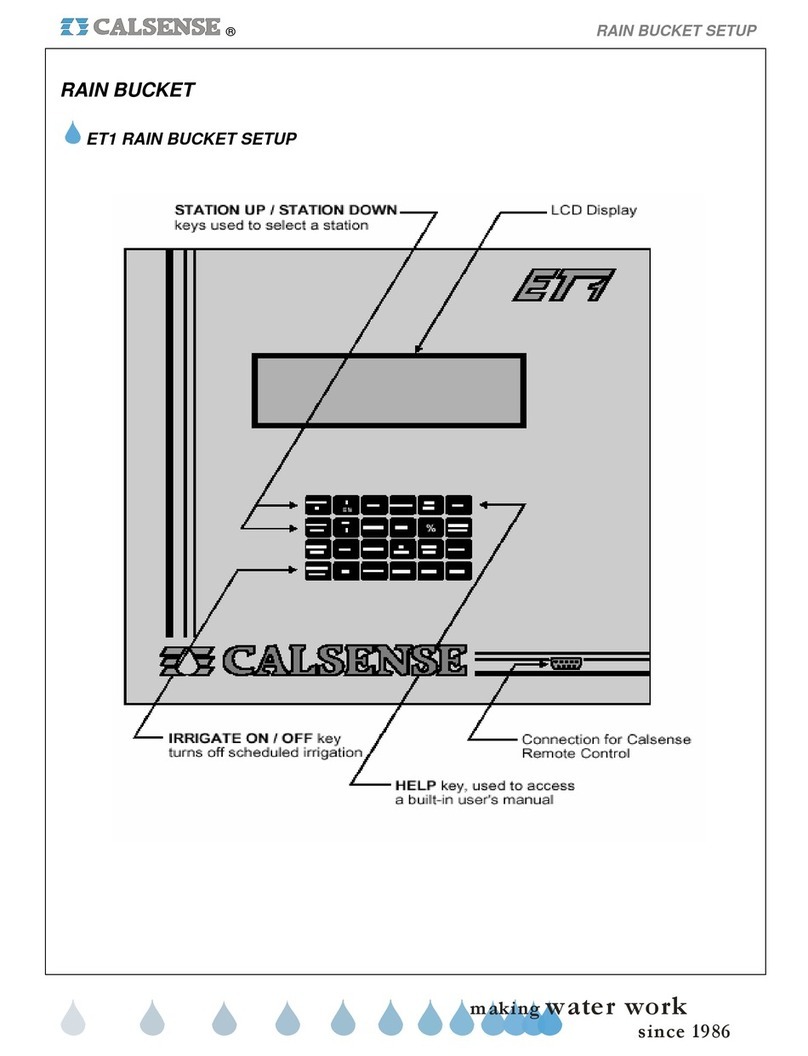
  9. Calsense ET1 User manual

Calsense ET1 User manual

2075 Corte del Nogal, Suite P
Carlsbad, CA 92011
(760) 438-0525, Fax (760) 438-2619
www.calsense.com
Real Time ET Based Water Management
A Guide to Programming the ET1 Irrigation Controller for use in Daily-ET Mode
Stock No. 4012 Rev 09/02
2
1. System Evaluation
One of the most important factors in water conservation is an efficient irrigation system. To maximize water savings, evaluate and
upgrade the irrigation system to increase uniformity. This may be costly, but the payback is relatively short where water costs are
high. If you do not have the expertise to perform a water audit, contact an irrigation consultant. Many irrigation consultants either do
water audits or work closely with a water auditor.
2. Getting Essential Information
When using daily ET, the controller must know the precipitation rate (or application rate) for each station. This is the amount of water
applied during irrigation and is measured in inches per hour. You can get this information in one of the following ways:
1. Perform an irrigation audit to measure the effective precipitation rates for each station. This method will give you the most
accurate information.
2. Measure or calculate the flow rate for each station. Then measure the area covered for each station (in square feet). Enter this
information into the controller and it will automatically calculate a precipitation rate for each station.
3. Use precipitation rates published by the equipment manufacturer for the type of irrigation heads being used.
If you are using the second method of determining precipitation rates, you must measure the area in square feet for each station.
This can be done with a planimeter on an as-built drawing or with a measuring wheel in the field. Then you must determine the flow
rateforeachstation.IfaCalsenseflowmeterisinstalledthisprocessisverysimple,thecontrollerwillmeasureflowratesautomatically
for each station, and keep a record of this information for you to access when setting up daily-ET(See Section 11 for other methods
you can use to calculate flow rates if a Calsense flow meter is not installed).
If you are using the third method you can obtain literature from the equipment manufacturer which contains precipitation rates for
various heads. Most equipment manufacturers list precipitation rates for their irrigation heads in their product catalog. You will also
need to determine the flow rates for each station.
3. Calsense ET-Gage
The Calsense ET Gage is a device which measures real-time Evapotranspiration (ET) in .01 inch increments. When an ET Gage is
connected to a Calsense ET1 Irrigation Controller (or shared using the Calsense Command Center program), the controller(s) will
usethe information toautomatically calculate stationrun-times whenever scheduledirrigation is setto occur. SinceET is determined
by weather conditions, irrigation run-times change daily based on current weather conditions. This helps conserve water and
creates healthier plant material.
Before enabling daily-ET be sure the ET Gage is properly installed and is functioning (for assistance call Calsense at 800-572-
8608). If you do not have an ET Gage installed you can still enable daily-ET in the controller and run the program on historical ET.
Historical ET is the 50 year average of monthly ET for a given area. The Calsense ET1 program stores this information for most
areas throughout California. You also have the ability to create your own ET numbers. Historical ET is also used automatically as a
backup for actual real-time ET in case a problem should ever occur with the ET Gage (See Section 5 for more information about
daily-ET).
4. Calsense Tipping Rain Bucket
The Calsense Tipping Rain Bucket is a device which measures the amount and rate of rainfall in .01 inch increments. When a Rain
BucketisconnectedtoaCalsenseET1IrrigationController(orsharedusingtheCalsenseCommandCenterprogram),thecontroller(s)
will use the information to offset daily-ET. Depending on the amount of rain, and the rate of rainfall, the controller will either have
station run-times reduced or not irrigate at all.
Using rain to offset irrigation is an integral part of daily-ET, it can only be used when a controller is setup in the daily-ET mode. It is
automatically enabled when daily-ET is enabled. If the daily-ET is enabled, and the controller does not have a rain bucket installed,
then rain will have no effect on scheduled irrigation (See Section 6 for more information about how rain effects daily-ET).
5. ET Table
The ET table is where the controller stores daily ET values (measured in inches). The values in this table are what determine the
amount of irrigation to be applied by each station. The values in the ET table can be generated from the following sources:
1. Automatically generated from an ET Gage wired to the controller.
2. AutomaticallysharedfromaanothercontrollerconnectedtoanETGageusingtheCalsenseCommandCenterprogram(controllers
must have communication capabilities to share ET).
3. HistoricalET whichis automaticallyentered intothe ETtable whendaily ETis enabled,and remainsin thetable untilit isreplaced
by real-time ET from an ET Gage or manually edited by the user.
4. Manually edit the ET table.
ET Amounts from 10/29/01 Back
MonSunSatFriThuWedTue
h .16g .18g .20g .19g .19g .18g .17
g .18g .17g .20g .19g .17g .17g .16
g .14g .13g .11g .15g .17e .21e .21
e .23h .16h .16h .16h .16h .16h .16
(push <review> to see RAIN table)
3
The usable rain in the rain table can be thought of as negative ET, (or negative hold-over). When scheduled irrigation is set to occur,
the controller will subtract the negative hold-over in the rain table from the ET in the ET table, and calculate a run-time with the
reduced ET value. If the negative hold-over is greater than ET, no irrigation will occur, this will continue until all of the negative hold-
over is subtracted from ET, then irrigation will begin again. The amount of time that irrigation is reduced or halted is determined by
the rate and amount of rainfall. Usable rain is determined by the settings programmed at the Rain Bucket Setup screen (See
Section 7 for more information about Rain Bucket settings).
To view the ET table and the rain table (this can only be done if the ET1 controller is in daily-ET mode), press the STATUS key, the
ET table will appear. Press the REVIEW key to toggle between each table (See Section 10 for more information about the Status
screen).
7. Setting Up The ET1 Controller For Use In Daily-ET Mode
When programming the ET1 Controller, there are four keys which are used repeatedly, the CHANGE key, UPARROWkey, DOWN
ARROW key and the ENTER key. They are used in the following manner:
Press the CHANGE key to highlight an item to be changed. It is also used to move the highlighted cursor around the display to
other items (if necessary). Press theUPARROWorDOWNARROWKeys to make a change to the highlighted item. PressENTER
after making changes to proceed to the next screen.
Start by accessing the ET1 Set-Up Program. To access Set-Up, a four key code must be entered as follows. Press the IRRIGATE
ON/OFF key (this will not be necessary if the controller is already off). PressSTATION UP, PressSTATION DOWN thenPress the
UP ARROW key. The following pages describe each screen, and the settings necessary to set-up the ET1 controller in daily-ET
mode.
The ET table stores the last 28 days of ET values. In the example shown on the previous page, the ET table has a combination of
historicalET, actual real-time ETand user editedET. The letter next to each value indicateshow it gotinto the ETtable, h=historical,
g=ET Gage and e=edited.
The upper left hand value is today’s ET, it will remain a historical number until 8:00 PM each night, at which time the controller will
place the total real-time ET from the ET Gage into that position (if an ET Gage is not attached and you are not sharing ET, the value
willremainhistorical).Thetotalreal-timeETvalue is the amountof ETthat has occurredsince 8:00 PMthe previousnight. Scheduled
irrigation occurring after 8:00 PM will use that value to calculate station run-times. At midnight all numbers will shift one place to the
right, a historical number will be placed in today’s position (upper left) and the number from 28 days ago (lower right) will be deleted.
If at the time scheduled irrigation is set to occur, there was no scheduled irrigation the previous night, the controller will combine the
ET values for the last 2 days and calculate station run-times using the total of the two values (if it had been 3 days since the last
scheduled irrigation it would combine the last 3 days of ET values and so on, for up to 28 days of total ET).
6. Rain Table
The rain table is where the controller stores rainfall values (measured in inches). The values in this table can only be generated from
a rain bucket wired to the controller, or shared using the Calsense Command Center program from a rain bucket wired to a
controller. In the example below the rain table has a combination of values. The letter next to the value indicates what the value
represents:
o=original, this value is zero which means it has not been altered, it has no effect on daily-ET
m=below minimum, the below minimum value is measured rain but it is not used to offset daily-ET.
r=usable rain, this value is rain that is used to offset daily-ET.
0.00 Rain Amounts From 10/29/2001 Back
MonSunSatFriThuWedTue
o .00o. 00m .06o .00r .23r .18o. 00
o .00o .00o .00o .00o .00o .00o .00
( push <review> to see ET table )
Daily ET Section :
USE DAILY ET TO CALCULATE RUN-TIMES ?
NO
After Entering Set-Up, Press the ENTER key repeatedly to proceed through each screen until the first DAILY ET screen appears
(shown above). To enable daily-ET, Press the UP ARROW key to change the highlighted selection from NO to YES.
4
If the controller has the -G option installed (an ET gage interface), you will be asked if an ET gage is wired to the controller, if this is
the case, Press the CHANGE key to move the highlight, then Press the UP ARROW key to select YES. If you are going to share
daily-ET information through a central computer (you must have the Calsense Command Center program to do this) or use the
Historical ET data built into the controller, leave the selection at NO. If the controller does not have the -G option installed you will not
be asked about the ET gage.
Press ENTER to proceed to the next screen. Press the UPARROWto change the selection. Here you have the option of keeping
a record of each ET gage pulse sent to the controller. This information is located in the diagnostic log. This is helpful when first
setting up the ET gage to make sure it is working properly, but can be set to NO after you are sure the ET gage is working properly.
NOTE : You will only see the screen above if the controller has an ET gage interface installed, which would be designated as a -G
controller, and you selected YES when asked if an ET gage is wired to the controller.
Press ENTER to proceed to the ET AVERAGING screen. Press the UP ARROW to select to use, or not to use, ET averaging on
each program in the controller. With ET averaging ON the controller will not use each individual ET value in the ET table, instead it
will use the average of the last 7 days of ET, in this way it will smooth out the long station run-times caused by turning water days off.
As an example, many sites such as public parks do not irrigate on weekends, so the schedule is set with Saturday and Sunday
water days off. If ET averaging is turned OFF, and scheduled irrigation is set to occur on Monday, the controller would combine the
ET for Saturday, Sunday and Monday, then calculate station run-times using the total of 3 days of ET. In this situation, each Monday
would have station run-times much longer than any other day of the week, which could cause over watering problems. With ET
averaging ON, the extended run-times on Monday would be spread throughout the week, eliminating possilbe problems caused by
over watering.
Press ENTER to proceed to the WATER WINDOW CONTROL screen. Press the UP ARROW to increase or DOWN ARROW to
decrease the setting. This setting controls the maximum allowable amount of ET that can be used to calculate station run-times.
The default value is 150%, which means that if actual real-time ET, measured by the ET gage, exceeds 150% of historical ET, the
controller will place an ET value in the ET table equal to 150% of historical ET instead of the actual real-time ET. This setting allows
the user to control the maximum amount of total irrigation time for sites that have a limited water window. The water window is the
time from when you can start irrigating to when you have to end irrigating.
Daily ET Section :
USE DAILY ET TO CALCULATE RUN-TIMES ? YES
CONTROLLER WIRED TO AN ET-GAGE ? YES
Daily ET cont’d
LOG EACH ET PULSE NO
Daily ET cont’d : ET AVERAGING
PROG A:DRIP 1:ON
PROG B:ONDRIP 2:ON
PROG C:ON
PROG D:ON
PROG E:ON
(to smooth effects of skip days turn ON)
ON
Daily ET cont’d : WATER WINDOW CONTROL
Set a limit on how much daily ET can be
used. This determines the length of
irrigation. The limit is relative to
historical ET.
MAX. ET-GAGE VALUE is % of HISTORICAL150
Press ENTER to proceed to the CROP COEFFICIENTS screen. Press the UPARROWto change the selection. Crop coefficients
are used to adjust ET for a specific type of crop at different periods throughout the year. If you do not want ET to be modified, leave
the selection at NO. If you select YES, you will then be asked to enter crop coefficient values for each month of the year, on each
program in the controller. If you are not familiar with crop coefficients, we suggest you leave the selection at NO.
DAILY ET cont’d : Plant water needs vary
monthly with growth activity.
DO YOU WANT TO USE
MONTHLY CROP COEFFICIENTS ?
NO
5
Press ENTER to proceed to the RAIN BUCKET screen. Press the UP ARROW or DOWN ARROW to increase or decrease the
setting. Press the CHANGE key to move the highlight to another setting. The 4 settings on this screen determine how much actual
rainfall will be placed into the rain table, which is used to offset daily-ET in the ET table. The “Stop Irrigation after” setting determines
how much rain must fall before the controller will start accumulating rainfall values in the rain table, and halt any ongoing irrigation.
The “Maximum Hourly Rain” setting determines the maximum amount of rain that will be put into the rain table in a 1 hour period of
rain. The amount of rain from this setting, that is put into the rain table, will increase only until it reaches the next setting, the
“Maximum 24 Hour Total”. The “Maximum 24 Hour Total” setting determines the maximum amount of rain that will be put into the
rain table in a 24 hour period of rain. The final setting, “Let Rain Only Build Up to” is the total maximum amount of rain that can ever
be stored in the rain table.
Thereason forthese settings are to limit the valuesstored inthe raintable. Iflimits were not put on rainfall, thevalues inthe raintable
could easily increase during an extended period of rain, or a short period of heavy rain, to cause irrigation to possibly be halted for
many weeks. In most situations this would not be desirable. NOTE : The 4 settings on the RAIN BUCKET screen will be available
only if the controller has a rain bucket interface installed, which would be designated as a -RB controller. If there is no rain bucket
installed the only setting will be the “Let Rain Only Build Up to”.
Press ENTER to proceed to the next screen. Press the UP ARROWto change the selection. Press the CHANGE key to move the
highlight to another setting. Here you have the option of enabling or disabling the use of negative hold-over (rain) for each of the
individual programs in the controller. If you select YES, negative hold-over will be used for that program to offset daily-ET, if you
select NO, rain will have no effect on daily-ET for that program. If there is no rain bucket installed and you are not sharing rain data
using the Calsense Command Center program, these settings will have no effect on daily-ET.
Daily ET cont’d : RAIN BUCKET
Stop Irrigation after inches
Maximum Hourly Rain is 0.20 inches
Maximum 24 Hour Total is 0.60 inches
Let Rain Only Build Up to 1.50 inches
0.10
Daily ET cont’d : RAIN CAUSES NEGATIVE
HOLD-OVER which subtracts from upcoming
irrigations. With a ‘YES’ enable this
feature for each program.
ADYESD1YES
BYESEYESD2YES
CYES
YES
Press ENTER to proceed to the 12 MONTH SCHEDULE screen. Press the UP ARROW key to change the selection. Here you
have the option of enabling or disabling the use of a 12-month schedule. If you select YES, it will be necessary to create the 12-
month schedule after leaving the ET1 Set-Up mode. In 12-month schedule mode, program start times and water days, station
minutes per cycle and soak-in times are pre-programmed for each month throughout the year (See Section 9 for instructions to
program the 12-month schedule).
Press ENTER to proceed to the STATION PRECIPITATION RATE screen. Press the UP ARROW or DOWN ARROW to increase
or decrease the setting. Press theCHANGE key to move the highlight to another setting. This is where you enter each station’s flow
rate (gpm) and area covered (square feet). As you enter this information, the precipitation rate for the station will be automatically
calculated (shown at the bottom of the display). Start by entering the flow rate for the station, then enter the area covered. When
entering the area covered, Pressing the UPARROWwill increase the setting in 100 foot increments, Pressing the DOWNARROW
will decrease the setting in 10 foot increments. After completing the setup of the first station, PressENTER to proceed to the next
station. Repeat the process described above until all stations have been set.
NOTE: If a Calsense flow meter is installed, the last measured flow rate for the station will be shown in the upper right corner of the
display. The flow rate shown is for your information only, it is not a setting.
Daily ET cont’d :
ADVANCED PROGRAMMING !
Use the 12-month schedule to change the
water days and start times ?
Only answer YES if fully understood.
NO
STATION 1Last GPM 0.0
Station Flow Rate : GPM
Area Covered :100 square feet
(calculated)
PRECIPITATION RATE : 0.96 inches / hour
1
6
Press ENTER, the screen above will appear. Press the UP ARROW or DOWN ARROW key to select the desired county.
Press ENTER, the screen above will appear. Press the UP ARROW or DOWN ARROW key to select the desired city.
Press ENTER, the screen above will appear. This screen displays the monthly historical ET for the area you chose in the previous
screens. It is only for your information.
Press ENTER repeatedly until the screen above appears. Press the UP ARROW or DOWN ARROW key to set the desired time
(setting a time here is optional).
This setting is the end of the water window (the beginning of the water window is the program’s scheduled start time). Irrigation will
never continue past the time set at this screen. If irrigation is in progress when this time is hit, it will halt, and all unfinished irrigation
will be saved as “hold-over time” and will be used on the next scheduled irrigation cycle. If the setting is OFF, irrigation will continue
until the program is finished. If the controller has hold-over time, you can view it or delete it (See Section 10 for information about
viewing and deleting hold-over time). Press ENTER repeatedly until you exit the Set-Up mode.
8. Main Display in Daily-ET Mode
As explained in the beginning of this guide, historical ET is used as a back-up to daily-ET, or it can be used as the source data to
drive the program. In either case, you would want to use the historical ET for the area you are located in. The ET1 controller stores
historicalETinformationfor21countiesinCalifornia,andnumerouscitieswithineachofthosecounties. After setting theprecipitation
rate for all stations, the following screens will appear. Select the area that you are located in, or the area that most represents your
location. You can also choose to enter your own ET numbers.
CIMIS ETo County Choice
Choose your County :
KERN
CIMIS ETo City Choice
Choose the CITY which BEST REPRESENTS
your area : CHINA LAKE
ETo (inches/month) for your location :
JANFEBMARAPRMAYJUN
2.13.25.37.79.110.0
JLYAUGSEPOCTNOVDEC
11.09.87.34.92.71.7
IRRIGATION NEVER CONTINUES past .
At this time any paused or on-going
irrigation will be terminated and
carried over to the next irrigation.
OFF
STN 01Gage=.00Left= 0%PROG A
Estimated Mins:10.0Last Min:0.0
Mins Per Cycle:4
Soak-in Time:5% of ET:100%
After you exit the Set-Up program the main display will appear has shown above (if you do not have an ET gage attached to the
controller the “Gage=” and “Left=” at the top of the display will not appear). The following describes each part of the main display.
STN : Indicates the current station number. Press the STATION UP or STATION DOWN key to change to another
station.
Gage=.00 : The amount of ET measured by the ET gage since 8:00 PM the previous night. This is for your information only,
it lets the user know that the gage is working properly.
7
Left= 0% : This is the amount of water in the ET gage (measured as a percentage). Whenever the gage is refilled, this
should be reset. Press the %key, then the UP ARROW key to reset the value (the maximum setting is 99%).
Press the ENTER key after the value has been reset.
PROG : Indicates the program that the current station is assigned to. A station can be assigned to only one program.
Press theCHANGE key until the programis highlighted.Press theUPARROWkey toselectthe desiredprogram.
Estimated Mins : The Estimated Minutes is the amount of irrigation time calculated by the controller, it is the maximum amount of
irrigation that will be applied in the current 24 hour period. This setting cannot be changed directly by the user.
The time is calculated by the program based on the precipitation rate for the current station, the amount of ET in
theET table, cropcoefficients (ifused), and the % ofET (described below). If anyof these values are changedthe
Estimated Minutes will change.
Mins Per Cycle : The Minutes Per Cycle is the maximum amount of irrigation time applied in a cycle. This setting should be the
most water you would want the current station to apply at any one time, that is before water starts to “run-off”. If
the setting is less than the Estimated Minutes (described above) there will be multiple cycle starts, until the total
time applied equals the Estimated Minutes. If the setting is more than the Estimated Minutes the run-time will be
equal to the Estimated Minutes (total run-time will never exceed the Estimated Minutes). Press theCHANGE key
until the setting is highlighted, Press the UP ARROW or DOWN ARROW key to adjust the setting.
Soak-in Time : TheSoak-in Time isthe amount oftime between multiplecycle starts (ifthere are multiplecycle starts). Ifthere are
no multiple cycle starts, this setting will be ignored by the program. Press the CHANGE key until the setting is
highlighted, Press the UP ARROW or DOWN ARROW key to adjust the setting.
Last Min : This is the average applied time for the last five irrigation cycles. It is for your information only.
% of ET : This is the individual station adjustment to daily-ET. This adjustment is used to fine-tune each stations run-time. It
is one of the factors used in calculating the Estimated Minutes (described above). Press the CHANGE key to
highlightthe % ofET, PresstheUPARROWorDOWNARROWkeytoadjustthesetting.Asyoumakeadjustments
to this setting, you will see the Estimated Minutes change. Try to make small adjustments, 5% to 10% at a time,
and allow a few days to pass before re-adjusting if necessary. Daily-ET only replaces the moisture that has
evaporated since the last irrigation cycle, if for example you have a problem with a valve, and an area becomes
stressed from lack of water, use the manual water feature to add water until the area is back to normal conditions.
The % of ET setting is used to adjust for factors such as different types of plant material (e.g. turf would generally
have a higher adjustment factor that shrubs), soil conditions (e.g. sandy soils might have a higher adjustment
factor than clay type soils because they don’t hold moisture as long), terrain (e.g. the system at the top of a slope
might have a higher adjustment factor that the system at the toe of a slope). If this adjustment ends up a large
number from 100% (in either direction), you should re-evaluate your precipitation rate numbers for that station,
which were entered in the Set-Up program (described earlier in this guide).
9. 12-Month Schedule
If 12-Month Schedule was enabled (while in the Set-Up program described earlier in this guide), it must be programmed after
leaving set-up. When using the 12-Month Schedule, you will be able to pre-program for each month of the year, every stations
Minutes Per Cycle and Soak-in Time settings, and each programs Start Time and Water Days. To program 12-Month Schedule
starting from the main display, Press the REVIEWkey, the display will appear as shown below.
STN 01(January)PROG A
Mins Per Cycle:4
Soak-in Time:5
The month being programmed is shown at the top of the display. Press the CHANGE key (a message will appear saying you are
about to make changes to the Master Schedule (12-month schedule). Press the CHANGE key once more to highlight the “Mins
Per Cycle”. Press the UP ARROW or DOWN ARROW key to change the setting. Press the CHANGE key to move the highlight to
“Soak-in Time”, Press the UPARROWor DOWN ARROW key to change the setting. Press the STATION UP or STATION DOWN
key to change to another station, make desired changes as described above. After all station settings have been programmed,
Press the ENTER key to save changes. Then press the SCHEDULE key, the Schedule screen will appear as shown below.
PROG ASTART TIME is OFF
week 1SUMOTUWETHFRSA
--------------
The current program will be shown in the upper left corner, the lines beneath each day represent an off water day. Press the
CHANGE key, the current day will be highlighted. Press the UP ARROW key to turn the day on, Press the DOWN ARROW key to
8
turn it off. Press the CHANGE key to move the highlight. After all water days and the start time has been set, Press theENTER key
tosave thechanges. Ifyou havestations assignedother programs, Press theSCHEDULEkeyuntilthedesiredprogramisdisplayed
in the upper left corner of the display, make desired changes as described previously. When all changes have been made and
saved, Press the ENTER key again to return to the main display. Press theREVIEWkey to go to the next month, make all changes
to that month’s program(s) as described previously, continue until each month of the year has been programmed. Press the
REVIEW key to return to the currently running program.
Whenever you need to make changes to your 12-Month Schedule, Press the REVIEW key repeatedly until the desired month
appears, make changes as described previously, then Press the REVIEW key repeatedly until the you return to the currently
running program.
With the 12-Month Schedule running, on the 1st of every month your Minutes Per Cycle, Soak-in Times, Water Days and Start
Times will change based upon the settings you programmed into the 12-Month Schedule. The 12-Month Schedule will continue to
run until it is disabled in the Set-Up program described earlier in this guide.
10. Status Screen
From the Status screen in the ET1 controller you can:
1. View or edit the ET table (See Section 5 for more information).
2. View the rain table (See Section 6 for more information).
3. View the status of each station during an irrigation cycle or stop any station while in an irrigation cycle. The irrigation can be
a normally scheduled cycle, a manual irrigation cycle, or a test cycle.
4. View the amount of each station’s hold-over time, with the option of clearing a station’s hold-over time. Negative hold-over
time (hold-over time generated by a rain bucket) will be shown as a negative number.
Press the STATUS key,if thereis anyhold-over timeor ifan irrigationcycle iscurrently inprogress, thedisplay willappear asshown
below. Select which screen you want to view by Pressing the CHANGE key to move the highlight, then Press the ENTER key (if
there is no hold-over time, and/or no current irrigation is running, you will go directly to the ET/rain tables after Pressing theSTATUS
key).
If you select LOOK AT IRRIGATION/HOLD-OVER STATUS, the Status screen will appear (shown below).
In the example above all the types of information that can be viewed from the Status screen are shown. An explanation of each
follows:
Station 1 has no hold-over time and and is waiting to irrigate, it’s irrigation time will be 10.0 minutes.
Station 2 has no hold-over time and is currently irrigating, it has 3.5 minutes left on it’s irrigation cycle.
Station 3 has 8.2 minutes of hold-over time, which will be added to the next scheduled irrigation cycle.
Station 4 has -15.3 minutes of negative hold-over time, which will be subtracted from the next scheduled irrigation cycle.
Stations 5, 6 and 7 have no hold-over time and are finished irrigating.
To clear a station’s hold-over time or to stop a station’s irrigation cycle, Press the UP ARROW or DOWN ARROW key repeatedly
until the station is highlighted, then Press the CLEAR key. When you are finished viewing and/or clearing hold-over time and
irrigation time Press the ENTER key to return to the main display.
LOOK AT IRRIGATION/HOLD-OVER STATUS
LOOK AT ET AND RAIN TABLES
STNHOLD-OVERIRRIG LEFTSTATUS
20.03.5Irrigating
38.20.0
4-15.30.0
50.00.0
60.00.0
70.00.0
10.010.0Waiting
9
11. How to Calculate Station Flow Rates
There are two methods to determine station flow rates if a Calsense flow meter is not installed on the system. The following
describes each method.
Using Manufacturers Published Data:
Withthis method youuse a manufacturerscatalog which hasthe flow rateslisted for thetype heads, andnozzle sizes onthe system
you are calculating. Simply total the flow rates for all the nozzles on the station.
Example:
A station has 8 half-circle pop-ups with a flow rate of 2 gpm each, 3 full-circle pop-ups at 4 gpm each and 4 quarter-circle pop-ups
at 1 gpm each. The station’s flow rate would be calculated as follows.
8 heads x 2 gpm = 16 gpm
3 heads x 4 gpm = 12 gpm
2 heads x 1 gpm = 2 gpm
Total flow = 30 gpm
Measuring Station Flow Rates:
The second method is a little more complicated, but the results are more accurate. You will use the irrigation system’s water meter
to calculate flow rates. Use the following procedure :
1. Determine the units used by the water meter (gallons, cubic feet, etc.). Make sure no other water will be flowing while you are
measuringflow rates. Also, if thereis more that one watermeter connectedto the mainline, all ofthem must be turned-off except
the one you are using to measure flow with.
2. Before beginning, turn on each station to make sure there are no broken heads or pipe and no plugged heads. Breaks or
plugged heads will cause incorrect flow readings.
3. Begin by turning on a station, let it run long enough to purge all the air out of the system. Then simultaneously, make note of the
meter reading and start timing using a stopwatch. After 3 minutes has elapsed make note of the meter reading again. Subtract
the starting meter reading from the ending meter reading, this will give you the amount of water used by the station in 3 minutes.
Continue this procedure until all stations have been measured.
4. To calculate the flow rate, divide the amount of water the station used (measured in gallons) by 3 minutes, this will give you the
station’s flow rate measured in GPM’s (gallons per minute).
Example #1 (if water meter units are in gallons):
Thestarting meterreading is312,121. After3 minutesthe endingmeter readingis 312,378gallons, theflow ratewould be calculated
asfollows: 312,378 gallons - 312,121 gallons = 257 gallons
257 gallons ÷ 3 minutes = 85.6 gpm
station flow rate = 85.6 gpm
Example #2 (if water meter units are in cubic feet or CF):
The starting meter reading is 9,975 CF After 3 minutes the ending meter reading is 10,003 CF, the flow rate would be calculated as
follows: 10,003 CF - 9,975 CF = 28 CF
28 CF x 7.48 gallons = 209.4 gallons (1 CF = 7.48 gallons)
209.4 gallons ÷ 3 minutes = 69.8 gpm
station flow rate = 69.8 gpm
Example #3 (if water meter units are in hundreds of cubic feet or CCF) :
The starting meter reading is 12,321 CCF After 3 minutes the ending meter reading is 12,321.25 CCF, the flow rate would be
calculatedas follows: 12,321.25 CCF - 12,321 CCF = .25 CCF
.25 CCF x 748 gallons = 187 gallons (1 CCF = 748 gallons)
187 gallons ÷ 3 minutes = 62.3 gpm
station flow rate = 62.3 gpm
NOTE : In examples #2 and #3 above, there is one extra step in the calculation, this is to convert the cubic feet into gallons before
dividing by 3 minutes.

Other manuals for ET1

1

Other Calsense Controllers manuals

Calsense 500 Series User manual

Calsense

Calsense 500 Series User manual

Calsense ET2000e User manual

Calsense

Calsense ET2000e User manual

Calsense ET2000e Operating instructions

Calsense

Calsense ET2000e Operating instructions

Calsense ET1 User manual

Calsense

Calsense ET1 User manual

Calsense CS3000 User manual

Calsense

Calsense CS3000 User manual

Calsense CS3000 User manual

Calsense

Calsense CS3000 User manual

Calsense 500 Series Operating instructions

Calsense

Calsense 500 Series Operating instructions

Calsense ET2000e User manual

Calsense

Calsense ET2000e User manual

Calsense ET2000 500 Series User manual

Calsense

Calsense ET2000 500 Series User manual

Calsense ET2000 Operating instructions

Calsense

Calsense ET2000 Operating instructions

Calsense ET2000 400 Series User manual

Calsense

Calsense ET2000 400 Series User manual

Popular Controllers manuals by other brands

Nordson Encore Customer product manual

Nordson

Nordson Encore Customer product manual

Beta Three XC2.6 user manual

Beta Three

Beta Three XC2.6 user manual

Robitronic Speedstar2 operating instructions

Robitronic

Robitronic Speedstar2 operating instructions

Viessmann 5268 Servocontrol manual

Viessmann

Viessmann 5268 Servocontrol manual

Endress+Hauser Liquiline CM442 operating instructions

Endress+Hauser

Endress+Hauser Liquiline CM442 operating instructions

Johnson Controls JCRL120PW instruction manual

Johnson Controls

Johnson Controls JCRL120PW instruction manual

Eurotherm 2604 Installation and operation handbook

Eurotherm

Eurotherm 2604 Installation and operation handbook

Dynamic RHINO2 DS90 installation manual

Dynamic

Dynamic RHINO2 DS90 installation manual

HEAVTH HP103 Operation manual

HEAVTH

HEAVTH HP103 Operation manual

Barco EC-210 Quick Start Guide-Setup

Barco

Barco EC-210 Quick Start Guide-Setup

ontrac Easytrac operation instruction

ontrac

ontrac Easytrac operation instruction

Advantech ADAM-4500 user manual

Advantech

Advantech ADAM-4500 user manual

HYDACELECTRONIC HPG 3000-000 operating instructions

HYDACELECTRONIC

HYDACELECTRONIC HPG 3000-000 operating instructions

SmartWireless SL9600TW quick start

SmartWireless

SmartWireless SL9600TW quick start

Unitech UNI-335 installation manual

Unitech

Unitech UNI-335 installation manual

Eaton FP-25-LV-VSR Instruction book

Eaton

Eaton FP-25-LV-VSR Instruction book

Titanium TT-RC4 instruction manual

Titanium

Titanium TT-RC4 instruction manual

Norden NVS-AC10002PC user manual

Norden

Norden NVS-AC10002PC user manual

manuals.online logo
manuals.online logoBrands
  • About & Mission
  • Contact us
  • Privacy Policy
  • Terms and Conditions

Copyright 2025 Manuals.Online. All Rights Reserved.