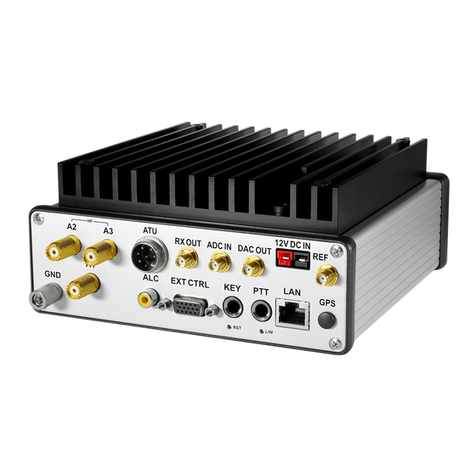
Expert Electronics SunSDR2 DX User manual

Werner Schnorrenberg - DC4KU www.dc4ku.darc.de 06.11.2021
1
SunSDR2 DX - Test Report
Based on the popular SDR transceiver SunSDR2 Pro, the manufacturer Expert Electronics offers the
"SunSDR2 DX". This transceiver operates as a direct-sampling Software Defined Radio (SDR) with a
high-resolution 16Bit A/D converter (LTC 2209), at a sampling rate of 160 MS/s. All amateur radio
bands from 160 to 6m (0.09...65MHz) as well as the 2m VHF band (95...148MHz) are supported. The
transmit power is 100W on shortwave, 50W on 6m and 7W on 2m. Changes compared to the
SunSDR-Pro concern the filters. A new high-pass filter from 100 MHz is built in, which leads to a
better sensitivity on VHF. For HF, 9 individual, optimized band-pass filters or a single low-pass filter
from 65 MHz are available. This combination is complemented by an additional low-pass filter from
70 MHz, which improves the dynamic range on shortwave (HF) and 6m.
The transmitter is designed to be completely independent of the receiver with its own quadrature
oscillator, allowing flexible half or full duplex operation. Together with the ExpertSDR2/3 software,
two independent main receivers and two independent sub-receivers in the same band range are
possible. Furthermore, the display of a wide spectrum of up to 80 MHz is possible.
The SunSDR2 DX is controlled via an Ethernet cable, which is connected either directly to a PC or to
the DSL router in the home network. With the help of the new ExpertSDR3 software and a "cloud"
provided free of charge by EE, the SunSDR2 DX can be easily operated worldwide from the Internet.
Complicated port forwarding and DynDNS are now a matter of the past.
Block diagram SunSDR2 DX

Werner Schnorrenberg - DC4KU www.dc4ku.darc.de 06.11.2021
2
Installation
At first, download the software "ExpertSDR2_SunSDR2DX" from https://eesdr.com/en/software-
en/expertsdr3-en and install it on a PC (Windows 10 32/64bit, Linux und macOS) and then connect
the SunSDR2 DX to the PC via an Ethernet cable (Fig. 1). For the PC to recognize the transceiver its IP
address must be changed.
USB
Audio E-Coder
Ethernet
Cable
LAN
DC4KU
Figure 1: SunSDR-DX in direct connection with a PC
To do this, go to Network and Sharing Centre -> Change Adapter Settings -> Ethernet -> Internet
Protocol, Version 4 (TCP/IPv4) and set the IPv4 address of the PC from "Obtain IP address
automatically" to e.g. 192.168.16.50 (1...199) and save it (Fig. 2). After changing the address, the
SunSDR2 DX is recognized by the PC and the software can be started. The connection to a single PC is
now complete (Fig. 3).
Figure 2: Setting the IP-Address in the PC
Figure 3: Display of the SunSDR2 DX under ExpertSDR2_SunSDR2DX
To enable remote control of the SunSDR2 DX from other PCs in the home network, it must be
connected to the home DSL router (Fig. 4). To do this, enter a free IP address of the router in the

Werner Schnorrenberg - DC4KU www.dc4ku.darc.de 06.11.2021
3
menu under Options -> Expert -> "Set IP Address", e.g. 192.168.178.120 and save this with Write ->
OK. If the preset "Port 50001" is already being used by the router for another application, enter a
free port here, e.g. Port 50071. Then switch off the SunSDR2 DX, disconnect it from the power supply
and connect the Ethernet cable to the router as shown in Fig. 4.
E-Coder
LAN oder WLAN
Audio USB
Router
Ethernet
Mouse
Internet
LAN
DC4KU
Figure 4: SunSDR2 DX connected to the home network
After switching on the transceiver again, it automatically connects to the router within a few seconds
(Fig. 5). After restarting the software, the new SDR address and the new SDR port of the SunSDR2 DX
can be seen under Options: 192.168.178.120:50071. The SunSDR2 DX is now connected to the home
network and can be reached from all PCs on which the ExpertSDR2_SunSDR2DX software has been
installed.
Figure 5: SunSDR2 DX started with its correct IP- and port-settings
Remote control via internet
For remote control via the Internet, a server/client connection is required (Fig. 6). Any PC in the
home network can act as a server PC. Download the software ExpertRS (Remote Server) and
ExpertRC (Remote Client) from https://eesdr.com/en/software-en/expertremote-en and install them
on the Server- and Client-PC (Fig. 6). Open "ExpertRS" on the Server-PC (Fig. 7) and enter 50071
under SDR Port and click on Search. The server of the SunSDR2 DX is now activated and on stand-by
for a connection. The program can then be closed again, but the server remains open in the
SDR Address and Port
192.168.178.120:50071

Werner Schnorrenberg - DC4KU www.dc4ku.darc.de 06.11.2021
4
background.
In order for the transmission to the Internet to work, the Server-PC needs a "Port Forwarding". To-do
this, open the router, go to Internet -> Release and release ports 50071 to 50073 (data and audio) on
the Server-PC via TCP and UDP. Then open "ExpertRC" on the Client-PC, select Options -> Device and
enter the public IPv4 address of the router and the port of the SunSDR2 DX, in the example:
92.36.144.213:50071 (Fig. 8).
E-Coder
Audio USB
Internet
Router
LAN
LAN/WLAN
Server-PC
ExpertRS
Client-PC
ExpertRC
DSL
Internet
DC4KU
Figure 6: SunSDR2 DX on the internet
Figure 7: ExpertRS started (left) and server marked at the bottom of the PC screen (right)
Finally, the SunSDR2 DX can be remotely controlled from anywhere in the world via the Internet (Fig.
8). The access works under LAN, WLAN and LTE (3G, 5G) with a selectable traffic from 70kbit/s to
over 1MBit/s and a sample rate from 39062 to 312500Hz.
Figure 8: After entering the URL, the SunSDR2 DX can be reached worldwide via the Internet.
fill in Port 50071
activated Server
address

Werner Schnorrenberg - DC4KU www.dc4ku.darc.de 06.11.2021
5
ExpertSDR3
Shortly ago, Expert Electronics introduced a new software under the name ExpertSDR3, which works
according to a completely new concept (https://eesdr.com/en/software-en/expertsdr3-en). After
installing and starting the software, a menu opens in which all radios within the home network are
listed, in the example a SunSDR2 Pro and SunSDR2DX (Fig. 9, left). After selecting one of the radios
via "Start", it opens and can be operated (Fig. 9, right). If necessary, all radios can be opened and
remote-controlled on different frequencies at the same time.
Figure 9: List of available radios (left) and Start of the SunSDR2 DX (right).
A special feature - which is not offered by any other manufacturer - is the remote control of the
radios via a "cloud", which Expert Electronics provides free of charge. Here, server and client PCs are
connected via a cloud-server (Fig. 10). Port-Forwarding and DynDNS are no longer necessary!
E-Coder
Audio USB
Cloud
server
Router
LAN
LAN
WLAN
Server-PC
Client-PC
DSL
Home
PC
ExpertSDR3 x64
ExpertSDR3 x64
Starter.exe
Heimnetz Internet
Radios
DC4KU
Figure 10: Remote control of all radios and via a cloud
First, register with the EE Cloud (Fig. 11). To do this, open the URL https://cloud.eesdr.com:5450/
reg.html and enter an email address and password in the Cloud menu. The successful registration is
then confirmed by Expert Electronics by email, which must be reconfirmed for security reasons.
Then download the file "Starter_Win64" from https://eesdr.com/en/software-en/expertsdr3-en on
to the Server-PC and open it. Under Starter_Win64 -> 20210702 you will find the file config.json.
Open it with a text editor and enter the email address and the password of your cloud under "email"
and "Secret" and save it. After double-clicking on "starter.exe", the message "Connect Successful"
appears on the screen (Fig. 12), which means that all radios in the home network are connected to
the Cloud. That's all!

Werner Schnorrenberg - DC4KU www.dc4ku.darc.de 06.11.2021
6
Figure 11: Registering at the EE-Cloud by email and password (left) and Log In (right).
Figure 12: Successful connection
Now there are two ways to connect server with client: Either via Web-Browser or via ExpertSDR3.
a) After entering the URL https://cloud.eesdr.com:5450.auth.html in a browser (Opera), all radios
connected to the cloud are displayed in a menu and can be started via "Connect" (Fig. 13, left). Since
the connection works via the WEB, Smartphones or Tablets can also be used as clients.
Figure 13: Radio opened via a Web-Browser on PC or Smartphone/Tablet
b) After starting the software ExpertSDR3 on the client PC, a menu also opens in which the URL, e-
mail address and password of the cloud are entered (Fig. 14, left). After clicking on "Login", all
available radios appear again, which can be started after clicking on "Start".
Figure 14: Radio opened via the Software ExperSDR3_x64

Werner Schnorrenberg - DC4KU www.dc4ku.darc.de 06.11.2021
7
The ExpertSDR3 software opens up so many new possibilities that a detailed description of its
features would go beyond the scope of this article. I will reserve that for a later report.
RF measurements at the receiver
Sensitivity (MDS) and Noise Figure (NF)
To measure the sensitivity of the receiver, an RF-Generator is tuned to the frequency of the receiver
(CW) and its level is reduced until the demodulated AF signal at the loudspeaker output (800Hz) is
only 3dB higher than the basic noise level of the receiver. I use a broadband AC voltmeter with dB
scaling as a measuring device for the noise increase at the AF output. Table 1 shows the determined
sensitivity (dBm) on the individual bands, with and without +10dB preamplifier, and Table 2 the noise
figure (dB).
Settings: CW 500Hz, AGC off, Dith/Rand off, use wide filter on, 145MHz with VHF LNA
MDS 3,6MHz 14,1MHz 28,1MHz 50,1MHz 145MHz
Gain +10dB -133dBm -133dBm -133dBm -128dBm -144dBm
Gain 0dB -121dBm -121dBm -121dBm -119dBm -
Table 1: Sensitivity (MDS) in dBm
With the noise limit of -174dBm/Hz, the noise figure (NF) is calculated as follows
Noise Figure = MDS - Noise Limit - 10logB = MDS + 147dB, with B=500Hz
Noise Figure 3,6MHz 14,1MHz 28,1MHz 50,1MHz 145MHz
Gain +10dB 14dB 14dB 14dB 19dB 3dB
Gain 0dB 26dB 26dB 26dB 28dB -
Table 2: Noise Figure in dB
S-Meter and dBm Display
The SunSDR2 DX displays the signal level on a scale from S1 to S9 +80dB, as well as in "dBm". To
check the dBm-accuracy, the RF signal of a calibrated signal generator is fed in at 14.2 MHz from S1
to S9+60dB (from -122dBm to -13dBm) and compared with the displayed value of the SunSDR2 DX.
Figure 15: S-Meter and dBm display
Settings: Frequency 14.2MHz, SSB, B=2.7 kHz, Preamp On
Input Level
dBm -121 -115 -109 -103 -97 -91 -85 -79 -73 -63 -53 -43 -33 -23 -13
S-Meter
Level S1 S2 S3 S4 S5 S6 S7 S8 S9 S9+10 S9+20 S9+30 S9+40 S9+50 S9+60
Displayed
Level dBm -120.9 -115.3 -109.4 -102.8 -96.9 -91.0 -85.1 -80.6 -72.9 -62.8 -53.1 -42.8 -32.7 -2.8 -12.8
Table 3: Accuracy of S-Meter and dBm indication over a dynamic range of 108dB, from S1 to S9 +60
Level in dBm

Werner Schnorrenberg - DC4KU www.dc4ku.darc.de 06.11.2021
8
The level measurement accuracy in "dBm" of the 16-bit SunSDR2 DX is exceptionally good and is not
comparable with any other receiver I know. The maximum error is +/- 0.5 dB over a range of 110 dB.
With this extremely high accuracy, the SunSDR2 DX can also be used as a spectrum analyzer or as a
measuring receiver.
Sideband Noise and Reciprocal Mixing Dynamic Range
Sideband noise (SBN) and Reciprocal Mixing Dynamic Range (RMDR) are among the most important
characteristics of a receiver (Fig. 16, 17). In direct sampling SDRs, SBN is mainly caused by time
jittering of the ADC clock and in analogue receivers by frequency jittering of the heterodyne
oscillator. Small signals near larger signals can be masked by sideband noise, causing the receiver to
lose sensitivity and dynamic range. The loss of dynamic range is called "Reciprocal Mixing Dynamic
Range (RMDR)". Therefore: The higher the RMDR and the smaller the SBN, the better the receiver.
The SBN measurement is made with a low-noise OCXO at 14.2454MHz. The level of the OCXO is
increased at a distance of 1 to 10 kHz from the receiving frequency until the background noise (SBN)
increases by 3dB. From this, SBN and RMDR are calculated as follows
SBN = Pi - MDS + 10logB
with Pi= input level, B=500Hz and MDS = -133dBm/500Hz
and
RMDR = Pi -MDS
Delta f kHz Pi dBm SBN dBc/Hz RMDR dB
1 -38 -120 95
2 -16 -138 111
3 -15 -141 114
4 -14 -144 117
5 -13 -146 119
Table 4: SBN and RMDR at carrier spacing from of up to 5 kHz
Figure 16: Visible receiver sideband noise at Pi = -10dBm (S9 +63dBm)
SBN

Werner Schnorrenberg - DC4KU www.dc4ku.darc.de 06.11.2021
9
120
130
140
150
12345
Frequenz-Offset (kHz)
Phase Noise (dBc/Hz)
SBN
120
110
100
90
12345
Frequenz-Offset (kHz)
RMDR (dB)
RMDR
Figure 17: Phase noise and RMDR curves
Intermodulation 3rd order, DR3
To test DR3 (Dynamic Range 3rd order), the receiver is driven with two RF signals of equal magnitude
and the 3rd order intermodulation products at 2xf1-f2 and 2xf2-f1 are measured simultaneously.
Therefore the level (Pi) of the 2-tone signal is gradually increased and the resulting 3rd order
intermodulation is noted, up to the limitation of the receiver (Fig. 19). The DR3 is calculated to
DR3 = Pi - MDS.
In difference to analog receivers, the IMD3 interference products of direct sampling SDRs do not
increase with signal magnification at triple speed, but remain near the noise floor and only increase
massively shortly before limiting the ADC. The highest distortion-free dynamic range therefore occurs
at maximum gain of the ADC, in the so-called sweet spot. With +10dB pre-amplification and switched
on BP-Filters the SunSDR2 DX develops its best dynamics. At a level of Pi=2x-25dBm (2xS9+48dB) the
largest DR3 of -25dBm - (- 131dBm) = 106dB (sweet spot) is produced (Fig. 18). With further signal
enlargement the ADC then comes into its limitation (clipping).
Settings: f1=14.100MHz, f2=14.102MHz, CW, B=500Hz, Preamp on, Dither/Random on
Bild 18: Maximaler IMD3-Abstand, kurz vor Clipping: 106dB
IMD3 = 106dB
-Pi= 2 x -25dBm
-131dBm

Werner Schnorrenberg - DC4KU www.dc4ku.darc.de 06.11.2021
10
-40-50 -45
-110
-120
-125
-135
-70 -60-65 -55 -35 -30 -25 -20 -15-75
-95
-130
-115
-105
-100
IFSS, IMD3 (dBm)
Pi, 2-tone Level, (dBm/tone)
-10
-90
residential noise at 14.1MHz
rural noise at 14.1MHz
DC4KU
Sweet Spot
S9+48dB
Clipping
Figure 19: IMD3 curve as a function of a 2-tone signal, with BP-Filter (standard) and HF LP-Filter (0-65MHz)
With a DR3 of 106dB the SunSDR2 DX reaches a very good dynamic range (Fig. 19). Better results are
only achieved by analogue receivers with an extremely powerful mixer in the front end. In course of
intermodulation it is only important that the produced intermodulation of the receiver does not
exceed the size of the residential- or rural-noise, which indicate the noise floor of the receiver with
the antenna connected.
Intermodulation 2nd order, DR2
The IM 2nd order is also measured with two CW signals, which are in a larger frequency distance to
each other, at f1 = 6.1MHz and f2 = 8.1MHz. The IMD2 product falls exactly in the 20m band, at f1 +
f2 = 14.2MHz. The levels (Pi) of f1 and f1 are increased until the unwanted IMD2 product appears at
14.2 MHz with +3dB above the noise. For the SunSDR2 DX, this occurred at Pi = -25dBm (S9 +48dB)
(Figure 20). The maximum dynamic range 2nd order (DR2) then corresponds to the difference of the
injected signal level (Pi) to the noise level (MDS) of the receiver.
DR2 = Pi - MDS = -25dBm - (-130dBm) = 105dB
Settings: f1=6,1MHz, f2=8,1MHz, fDR2=14,2MHz, CW, B=500Hz, Gain=+10dB/0dB, Dith/Rand on
Figure 20: DR2 measurement via "Bandscope" (spectrum analyzer) display
Pi = 2x-25dBm
IMD2= -130dBm
DR2=
105dB
Noise

Werner Schnorrenberg - DC4KU www.dc4ku.darc.de 06.11.2021
11
Gain MDS Pi DR2
0dB -123 dBm -15 dBm 108 dB
+10dB -130 dBm -25 dBm 105 dB
Table 5: Dynamic range 2nd order (DR2), f1=6.1MHz, f2=8.1MHz
The +10dB preamplifier of the SunSDR2DX offers a strong signal immunity and produces nearly no
detectable intermodulation, as shown in Table 5. With +10dB pre-amplification the DR2 decreases
only by 3dB, from 108dB to 105dB.
Note on intermodulation
The RF input of the SunSDR2 DX is protected by a series of BP filters (9 in total) by default. If
required, only a 65MHz low-pass filter can be connected via the "use wide RX Filter: on" setting. But
then it should be noted that the receiver is no longer protected against large signals. Fig. 21 shows
the IMD2 measurement via the 65 MHz LP filter. In addition to the two input signals f1 = 6.1MHz and
f2 = 8.1MHz the IM interference products at 2 x f1 = 12.2MHz and f1 + f2 = 14.2MHz are clearly
visible. If the BP filter is switched on in the 20m band (as it should be), the selection of the filter
causes a strong attenuation of f1 and f2, so that the two IM products disappear in the noise (Fig. 22).
Figure 21: Intermodulation caused by broadband input
Figure 22: No intermodulation due to bandpass filter in 20m band
f1+f
2xf1
f1 f2
f2
f1
20m-Band BP-Filter

Werner Schnorrenberg - DC4KU www.dc4ku.darc.de 06.11.2021
12
Noise Power Ratio (NPR)
An NPR measurement can be used to determine the strong signal immunity of a receiver. The input
of the receiver is no longer driven with individual CW signals, but with white noise of constant power.
Fig. 23 shows the test setup consisting of a noise generator (0-100 MHz), bandpass filter, notch filter
and attenuator and Fig. 24 the resulting noise spectrum on the screen of a spectrum analyzer.
Notchfilter Noise Level
adjust
White Noise
Generator
0...30dB
DC4KU
P
Noise
P
TOT
B
RF
= 0...5MHz f=2,4MHz
B=10kHz
Display/PC
B
IF
= 500Hz
SunSDR2
DX
Bandfilter
NoiseNoise
Noise
Arbitrary Waveform
Generator
Figure 23: NPR measuring station
Figure 24: Noise spectrum with notch filter at the input of the receiver
The notch filter has the task of eliminating the noise at one point, in the example at f=2.4MHz. The
receiver is adjusted to the centre of the notch filter (2.4MHz) and receives only its basic noise of
-121dBm/500Hz at this point. Then the applied noise is increased until the ADC is close to its limit.
This can be seen by a 3dB noise rise in the base of the notch filter. At this point, the resulting
intermodulation reaches the receiver's limit sensitivity and the difference of applied noise power
(PTOT) to the background noise level (MDS) corresponds to the NPR.
For the SunSDR2 DX, this occurs at a PTOT noise level of -5dBm/5MHz noise bandwidth.
From this, its NPR is calculated as
NPR = PTOT - BWR - MDS = -5dBm - 10log5000kHz/500Hz - (-121dBm) = 76dB
with:
PTOT = Noise power (in the example related to a bandwidth BRF of 5MHz).
BWR (Bandwidth Ratio) = 10log BRF/BIF = 10Log 5000kHz/500Hz = 40dB
BRF = noise bandwidth of the generator (in the example 5MHz)
BIF = Noise bandwidth of the receiver (in the example 500Hz)
MDS = -121dBm, noise floor of the receiver with Wide RX filter On
Ground Noise
Noise Signal, P
TOT
Notch
Filter

Werner Schnorrenberg - DC4KU www.dc4ku.darc.de 06.11.2021
13
The NPR can be read directly from the spectrum display of the SunSDR2 DX, it is 76dB with a noise
power of PTOT = -5dBm/5MHz (Fig. 25). For NPR measurements, no limiting bandpass filters should be
connected in front of the receiver, because otherwise there is a risk that not the entire noise
spectrum reaches the input of the ADC. Therefore, I activate Wide RX-Filter On under Options ->
Device, which means that only a 65MHz LP filter is connected in front of the receiver.
Settings: B=500Hz, Preamp off, Dither & Random off, Wide RX-Filter on
Figure 25: Noise Power Ratio
An NPR of 76dB proves the large signal strength of the SunSDR2 DX; simple SDR's usually only
achieve an NPR of 40 to 50dB.
Wide Band Scope
In the operating mode "BS" (Wide Band Scope), the SunSDR2 DX opens an additional screen in which
the entire spectrum from 0 to 80MHz is displayed. If you now switch off the bandpass filters of the
receiver via the setting "Use Wide RX Filter: on", you will see the entire, unfiltered spectrum from 0
to 80MHz (Fig. 26). In this way it can be estimated well, which signals in which size the connected
antenna delivers from 0 to 80 MHz at all. In the example, the strongest signals appear at about 7MHz
with about -45dBm (S9 +30dB) and some interfering signals at 40, 50, 60 and 70MHz.
Figure 26: Display of the spectrum from 0-80MHz via "Wide Band Scope".
NPR=76dB

Werner Schnorrenberg - DC4KU www.dc4ku.darc.de 06.11.2021
14
If you reduce the span to e.g. 2-13MHz (Fig. 27, left) and switch the BP filters on again (use Wide RX
filter: off), you can see the selective effect of the now reconnected BP filter in the 40m band (Fig. 27,
riht). In this way, the effect of all BP filters in the frequency range can be checked. Frequency,
deviation and level can be freely selected, similar to a spectrum analyzer.
Figure 27: Spectrum in the 40m band without BP filter (left) and with BP filter (right)
Noise Filter
Another very useful function is the noise filters that can be activated. These are notch filters that can
be placed anywhere in the spectrum to suppress interfering frequencies. If, for example, I have
arranged a QSO on 3793 kHz (Fig. 28) and a small, whistling signal in the background disturbs me
exactly there, I can suppress it completely and easily with a notch filter. The filters can be set so
narrow that they do not interfere with the modulation signal. A total of up to 8 notch filters can be
selected, each with a selectable notch bandwidth of 50Hz to 5kHz, which can be placed anywhere in
the spectrum.
Figure 28: Suppression of unwanted signals in the spectrum by noise filters (notch filters)
RF measurements at the transmitter
RF output power
In this measurement, the RF output of the transceiver is connected to a calibrated spectrum analyzer
via a 50dB attenuator and the maximum RF output power (Watt) is determined in CW mode (RTTY)
on the frequencies 3.6, 14.1, 28.3, 50 and 145MHz.
Settings: RTTY, power supply +13.8VDC
Frequenz 3,6 MHz 7,1 MHz 14,1 MHz 28,3 MHz 50 MHz 145 MHz
POUT 107 Watt 107 Watt 110 Watt 119 Watt 75 Watt 8 Watt
Table 6: Max. RF output power
Noise
Filter
Spurious
Si
g
nal

Werner Schnorrenberg - DC4KU www.dc4ku.darc.de 06.11.2021
15
Intermodulation of the transmitter
In this test, a 2-tone signal (f1=700Hz, f2=1500Hz) is fed into the microphone input of the SunSDR2
DX and the transmitter is adjusted to maximum output power. The total power P0UT of e.g. 100W is
now distributed with 50W each (-3dB) to both signals and reaches a peak power of 100Watt PEP. The
resulting spectrum shows not only the two user signals (f1, f2) but also the unwanted
intermodulation products of the transmitter, whereby the IMD3 products usually have the highest
amplitude.
At maximum output power the distance between the IMD3 products and the user signals should not
be less than 25dBc (according to ITU-R Rec. SM.326-7 standard -25 dBc worst-case) and the higher
order products should drop in level relatively quickly. Figure 29 shows the intermodulation of the
transmitter in the 20m band and Table 7 shows the IMD3 results at 3.6, 14.1, 28.3, 52 and 145MHz.
Settings: 20m band, 2-tone signal 700/1500 Hz with equal amplitudes, PEP = 100W
Figure 29: Transmitter intermodulation in the 20m band, 100Watt PEP, IMD3=33dBc
Frequenz 3,6 MHz 14,1 MHz 28,3 MHz 52 MHz 145 MHz
IMD3 31 dBc 33 dBc 30 dBc 30 dBc 30 dBc
Table 7: IMD3 distances at max. power on the individual bands
Even more realistically, the intermodulation can be determined with white noise. Instead of the 2-
tone signal, white noise is fed into the microphone input (Fig. 30). The result is an almost rectangular
noise envelope that corresponds to the bandwidth of the selected resolution filter, in the example
B=2.7 kHz (SSB).
Figure 30: IMD determination with white noise, B=2.7 kHz
Theoretically, the two edges should slope steeply downwards to the noise floor, but in practice, of
course they do not. From about -30dBc the first IMD products appear, but their levels decrease

Werner Schnorrenberg - DC4KU www.dc4ku.darc.de 06.11.2021
16
relatively quickly as the frequency increases and decreases. In the noise spectrum, no individual
spectral lines are now visible, but only a cumulative spectrum consisting of a virtually endless
number of IMD products. For this reason, an IMD measurement with noise is in principle more true
to reality than with only 2 signals. However, the procedure is also hard and strict, similar to an NPR
measurement, and this is probably why most manufacturers do not publish it in their data sheets.
The course of the noise spectrum also gives a good indication of the distance at which another
station could be placed without being disturbed.
Transmitter Sideband Noise (TX-SBN)
Transmitters also generate sideband noise, but this is hardly detected in "normal" operation if the
stations are far away from each other. However, if the radios are close together, such as during a
field day, a transmitter with strong sideband noise may "noise out" (desensitize) nearby receivers
(Fig. 31). This has nothing to do with "blocking" and additional filters at the receiver's input do not
improve the situation (5).
Phase Nnoise
Amplitude Noise
A
A
t
t
Amplitude
Frequency
Amplitude Noise
Phase Noise
Cumulativ Noise
a) b)
DC4KU
Figure 31: Phase- and amplitude noise in the a) frequency domain and b) time Domain
Although receiver and transmitter are controlled by the same oscillator, transmitters often produce
an unacceptably high sideband noise. The reason is usually an (unwanted) AM modulation of the
transmitted signal, which is superimposed on the phase noise. The resulting cumulative noise
(AM+FM) is often higher and more broadband than just the phase noise.
SunSDR2
DX
100 Watt
Spectrum Analyzer
Preamplifier: ON
P
f
Limit
-160dBm/Hz
0dBm
Crystal Filter Carrier 0dBm
surpressed by
130dB
SBN
45...50dB
fs=7.075MHz
7.080MHz
7.090MHz
7.012MHz
7.170MHz
DC4KU
Crystal Filter
f0=7.07MHz
BW=2kHz
f
0
Figure 32: Measurement setup for SBN measurements on transmitters

Werner Schnorrenberg - DC4KU www.dc4ku.darc.de 06.11.2021
17
Measuring the sideband noise of a transmitter is basically done in exactly the same way as the SBN
measurement on an oscillator. The transmitter is set at frequency intervals of +5 to +100 kHz to the
centre frequency of a narrowband and steep-edged crystal filter (7.070MHz, +/-1kHz) and the
resulting sideband noise in the pass band of the filter is measured with a spectrum analyzer (Fig. 32).
First, the 100Watt transmit signal (CW) must be attenuated to 1mW (0dBm) with an attenuator so
that the connected spectrum analyzer is not overdriven. In addition, the 7.07MHz crystal filter blocks
the transmit signal from an offset of 5 kHz by approx. 80dB, so that the transmit signal is attenuated
by a total of 130dB. Only in the pass band of the crystal filter the noise is transmitted without
attenuation. Now the analyzer can be set to its highest sensitivity of -160dBm/Hz, with 0dB RF
attenuation and +20dB RF preamplifier switched on. Then the SBN of the transmitter can be
determined at intervals of 5 to 100 kHz (1MHz) from the transmit frequency. As an example, Fig. 33
shows the SBN result at a distance of 10 kHz from the carrier and Table 8 shows the measurement
results at distances up to 100 kHz.
Figure 33: TX-SBN in 10 kHz offset to carrier, SBN = -140dBm/Hz
Offset (kHz) 5 10 20 50 100
SBN (dBm/Hz) -136 -140 -142 -142 -143
Table 8: Cumulative SBN (AM + FM) of the transmitter at a distance of 5...100k Hz from the carrier
-110
-120
-130
-140
-150
-160
10 200 30405060708090100
Offset (kHz)
SBN (dBm/Hz)
Transmitter Sideband Noise
SunSDR2 DX (100W)
IC-7300 (100W)
IC-705 (10W)
FT-DX10 (100W)
DC4KU
Figure 34: Transmitter composite noise at 7.1 MHz of the IC-705, IC-7300, FT-DX10 and SunSDR2 DX
SBN=
-140dBm/Hz
Chrystal
Filter
10kHz
suppressed
carrier si
g
nal

Werner Schnorrenberg - DC4KU www.dc4ku.darc.de 06.11.2021
18
With an SBN of only -140dBm/Hz at a distance of 10 kHz from the carrier, the noise of the transmitter
is so small that the SunSDR2 DX can easily be used at Field Days without disturbing other stations by
its sideband noise. Fig. 34 shows the cumulative TX-SBN of some modern transceivers.
Transceiver data
The characteristic values of some modern transceivers are shown in Table 9. It should be noted that
the FT-DX10 is a hybrid transceiver (analogue mixer and digital IF), but the SunSDR2 DX (16bit), IC-
705 (14bit) and IC 7300 (14bit) are direct sampling SDRs.
Receiver, 14.1MHz Transmitter, 14.1MHz
MDS
Preamp on
RMDR
Offset 2kHz
IMD3
Delta f = 2kHz NPR IMD3
700/1500Hz
TX-SBN
Delta f = 20kHz
FTDX-10 -134 dBm 116 dB 110 dBc 78 dB 27 dBc -132 dBm/Hz
SunSDR2 DX -133 dBm 111 dB 106 dBc 76 dB 33 dBc -142 dBm/Hz
IC-7300 -133 dBm 106 dB 99 dBc 76 dB 36 dBc -127 dBm/Hz
IC-705 -134 dBm 109 dB 98 dBc 76 dB 36 dBc -122 dBm/Hz
Table 9: Characteristic values of different transceivers
Figure 35: SunSDR2 on 80m during a contest
Werner Schnorrenberg
DC4KU
November 06, 2021
Literature
(1) Expert Remote System, User Manual
https://eesdr.com/images/Document/Expert%20Remote%20system_ENG.pdf

Werner Schnorrenberg - DC4KU www.dc4ku.darc.de 06.11.2021
19
(2) SunSDR2DX, HF/50MHz/VHF-Transceiver, User Manual
https://eesdr.com/images/Document/SunSDR2_DX/SunSDR2_DX_User_Manual_ENG.pdf
(3) Expert SDR3 Software
https://eesdr.com/en/software-en/expertsdr3-en
(4) Noise Power Ratio (NPR) Testing of HF Receivers
https://www.ab4oj.com/test/docs/npr_test.pdf
(5) Seitenbandrauschen von Sendern
FUNKAMATEUR 09-2021
Other manuals for SunSDR2 DX
2
Table of contents
Other Expert Electronics Transceiver manuals

Expert Electronics
Expert Electronics SunSDR2 Pro User manual

Expert Electronics
Expert Electronics MB1 User manual

Expert Electronics
Expert Electronics SunSDR2 DX User manual

Expert Electronics
Expert Electronics DUC/DDC SDR Series User manual

Expert Electronics
Expert Electronics MB1 User manual

Expert Electronics
Expert Electronics SunSDR2 Pro User manual

Expert Electronics
Expert Electronics SunSDR2 QRP User manual

Expert Electronics
Expert Electronics SunSDR2 DX User manual

Expert Electronics
Expert Electronics SunSDR2 Pro User manual