Infratek 108B User manual
USERS MANUAL 108B
SINGLE- TO FOUR PHASE
INFRATEK POWER ANALYZER

page 2
TABLE OF CONTENTS
1. Power Analyzer Features, Quick Overview, Safety 5
1.1 Standard Measure Mode ................................................................................................... 6
1.2 Logging Measure Mode ..................................................................................................... 7
1.3 Transient Measure Mode ................................................................................................... 7
1.4 Power-Speed Measure Mode (Option) ............................................................................... 8
1.5 Power Analyzer Rear Panel ............................................................................................... 9
1.6 Summary of 108B Power Analyzer Features ................................................................... 10
1.7 Safety Instructions ........................................................................................................... 11
2. Connection to Circuits 12
2.1 Measurement in 3-Phase mains Circuit ........................................................................... 12
2.1.1 Three Wattmeter Connection ............................................................................. 12
2.1.2 Aron Connection ................................................................................................. 13
3. 108B Mathematical Definitions and Specifications 14
3.1 Mathematical Definitions .................................................................................................. 14
3.2 Specifications .................................................................................................................. 18
4. Operating The Power Analyzer from the Front Panel 22
4.1 Operations in Standard Measure Mode ........................................................................... 23
4.1.1 Selecting Measure Mode .................................................................................... 23
4.1.2 Selecting Current Inputs using same Inputs for all Phases ................................ 24
4.1.3 Selecting individual current inputs per phase ..................................................... 24
4.1.4 Selecting Current Range using same range for all phases ................................. 25
4.1.5 Selecting Voltage Range using same range for all phases ................................ 25
4.1.6 Selecting Measurement Synchronization (Synchronization for all phases) ........ 26
4.1.7 Selecting Averaging Time ................................................................................... 26
4.1.8 Selecting Display Pages ..................................................................................... 26
4.1.9 Selecting Wave Forms (Graph) .......................................................................... 27
4.1.11 Selecting FFT Table and FFT Bar Graph ........................................................... 27
4.1.12 Selecting AC or DC+AC-Coupling ...................................................................... 27
4.1.13 Selecting Display RUN and Display HOLD ......................................................... 28
4.1.14 Resetting Energy ................................................................................................ 28
4.1.15 Selecting Display Quantities ............................................................................... 28
4.1.17 Selecting SETUP ................................................................................................ 31
4.2 Operations in Logging Measure Mode ............................................................................. 34
4.2.1 Valid Synchronization ......................................................................................... 34
4.2.2 Selecting CYCLES ............................................................................................. 34
4.2.3 What has to be observed when using Logging? ................................................. 35

page 3
4.3 Operations in Transient Measure Mode ........................................................................... 36
4.3.1 What is measured in Transient Measure Mode? ................................................ 36
4.3.2 Two Ways To Use Transient Measure Mode ..................................................... 36
4.4 Basics Of Power-Speed Measure Mode (Option) ............................................................ 38
4.4.1 What Is Measured In Power-Speed Measure Mode ........................................... 38
4.4.2 Operations in Power-Speed Measure Mode ....................................................... 38
5. Operating The Power Analyzer Using A Computer Interface 41
5.1 What Has To Be Observed When Using An Interface ...................................................... 41
5.2 What Has To Be Observed When Using The Interface Command Set ............................. 41
5.3 Computer Interface Command Set .................................................................................. 44
5.4 Composite Commands .................................................................................................... 44
5.5 Reading voltages, reading and writing voltage scale factors ............................................ 45
5.6 Reading currents, reading and writing current scale factor ............................................... 46
5.7 Reading power, apparent power, and reactive power ...................................................... 47
5.8 Reading energy, charge, and time ................................................................................... 47
5.9 Reading frequency, impedance, and phase angle. .......................................................... 48
5.10 Reading/writing range of harmonics, number phases for output, and cycle for Logging ... 48
5.11 Read and write display, RS232 Baud Rate, IEEE-488 address........................................ 49
5.12 Read and write common control commands. ................................................................... 49
6. Computer Operating Software 51
6.1 Installing Computer Operating Software .......................................................................... 51
6.2 108A Data Window (Computer Software) ........................................................................ 52
6.2.1 Select Interface .................................................................................................. 52
6.2.2 Select instrument mode ...................................................................................... 53
6.2.3 Select software mode ......................................................................................... 54
6.2.4 Operate the computer software .......................................................................... 54
6.2.5 Input, Ranges, Synchronization, Aperture selection ........................................... 55
6.2.6 Phase Slider for selecting individual settings per phase ..................................... 55
6.2.7 Curve .................................................................................................................. 55
6.2.8 FFT Numerics (Harmonics) ................................................................................ 56
6.2.9 FFT Bar Graph (Harmonics) ............................................................................... 56
6.2.10 Vector Graph (Phase Angle) .............................................................................. 56
6.2.11 IEC Data Window ............................................................................................... 57
6.2.12 Control / Setting Window .................................................................................... 59
6.2.13 Logging-, Transient-, Power Speed Measure Mode ........................................... 61
7. Analog Input and -Output 62
7.1 Analog Input And Output Specification ............................................................................. 63

page 4
7.2 Programming The Analog Outputs ................................................................................... 63
7.3 Using Inputs for Motor Testing (See also 4.1 Motor Testing) ........................................... 64
7.4 Using Low Current Shunt for Standby Power Measurement ............................................ 65
8. Data Management 66
8.1 Operating the Power Analyzer using the USB Interface ................................................... 66
8.2 Operating the Power Analyzer using the Ethernet Interface ............................................. 66
8.3 Measurement Data from the Power Analyzer (USB) to Computer .................................... 67
9. Calibration via 108B Front Panel 68
9.1 Equipment Needed .......................................................................................................... 68
9.2. Calibration Procedure ...................................................................................................... 68
9.2.1 Voltage Calibration At 60Hz ............................................................................... 68
9.2.2 Current Calibration At 60Hz, Shunt Input Calibration ......................................... 69
9.2.3 Storing The Calibration Constants ...................................................................... 70
9.3. A Few Practical Hints ....................................................................................................... 70
9.4. 108B Calibration using Windows Operating Software (LabView) ..................................... 71
9.4.1 Equipment Needed ............................................................................................. 71
9.4.2 Calibration Procedure ......................................................................................... 71
9.4.3 Voltage Calibration At 60Hz ............................................................................... 71
9.4.4 Current Calibration At 60Hz (IN 5A) ................................................................... 72
9.4.5 Current Calibration At 60Hz (IN 1A) ................................................................... 73
9.4.6 Current Calibration At 60Hz (IN 30A) ................................................................. 74
9.4.7 Current Calibration At 60Hz (SHUNT) ................................................................ 74
9.4.8 Storing The Calibration Constants ...................................................................... 75
9.4.9 A Few Practical Hints ......................................................................................... 75
page 5
1. POWER ANALYZER FEATURES, QUICK OVERVIEW, SAFETY
The Infratek 108B High Precision Power Analyzer is available in 1-, 3- and 4- phase versions.
All voltage inputs (ranges 0.3V up to 1500Vpeak) and all current inputs (1.5mA up to 1A;
15mA up to 5A; 1A up to 40A; and current shunt inputs 60mV up to 6V) are potential free and
exhibit
Excellent low noise
Common mode suppression
DC-stability
Wide frequency range (2MHz)
Very low self-heating on current inputs.
There is no need to fiddle with dc-compensation, or changing current plug-ins. All is built into
the input sections of the Power Analyzer, ready to be used.
Your intuition will guide you to operate the Power Analyzer touch screen correctly. With basic
knowledge of power measurement, you will be able to change the settings to your needs. Al-
most all setting changes are accomplished with two touches on the display screen or two
clicks with the mouse.
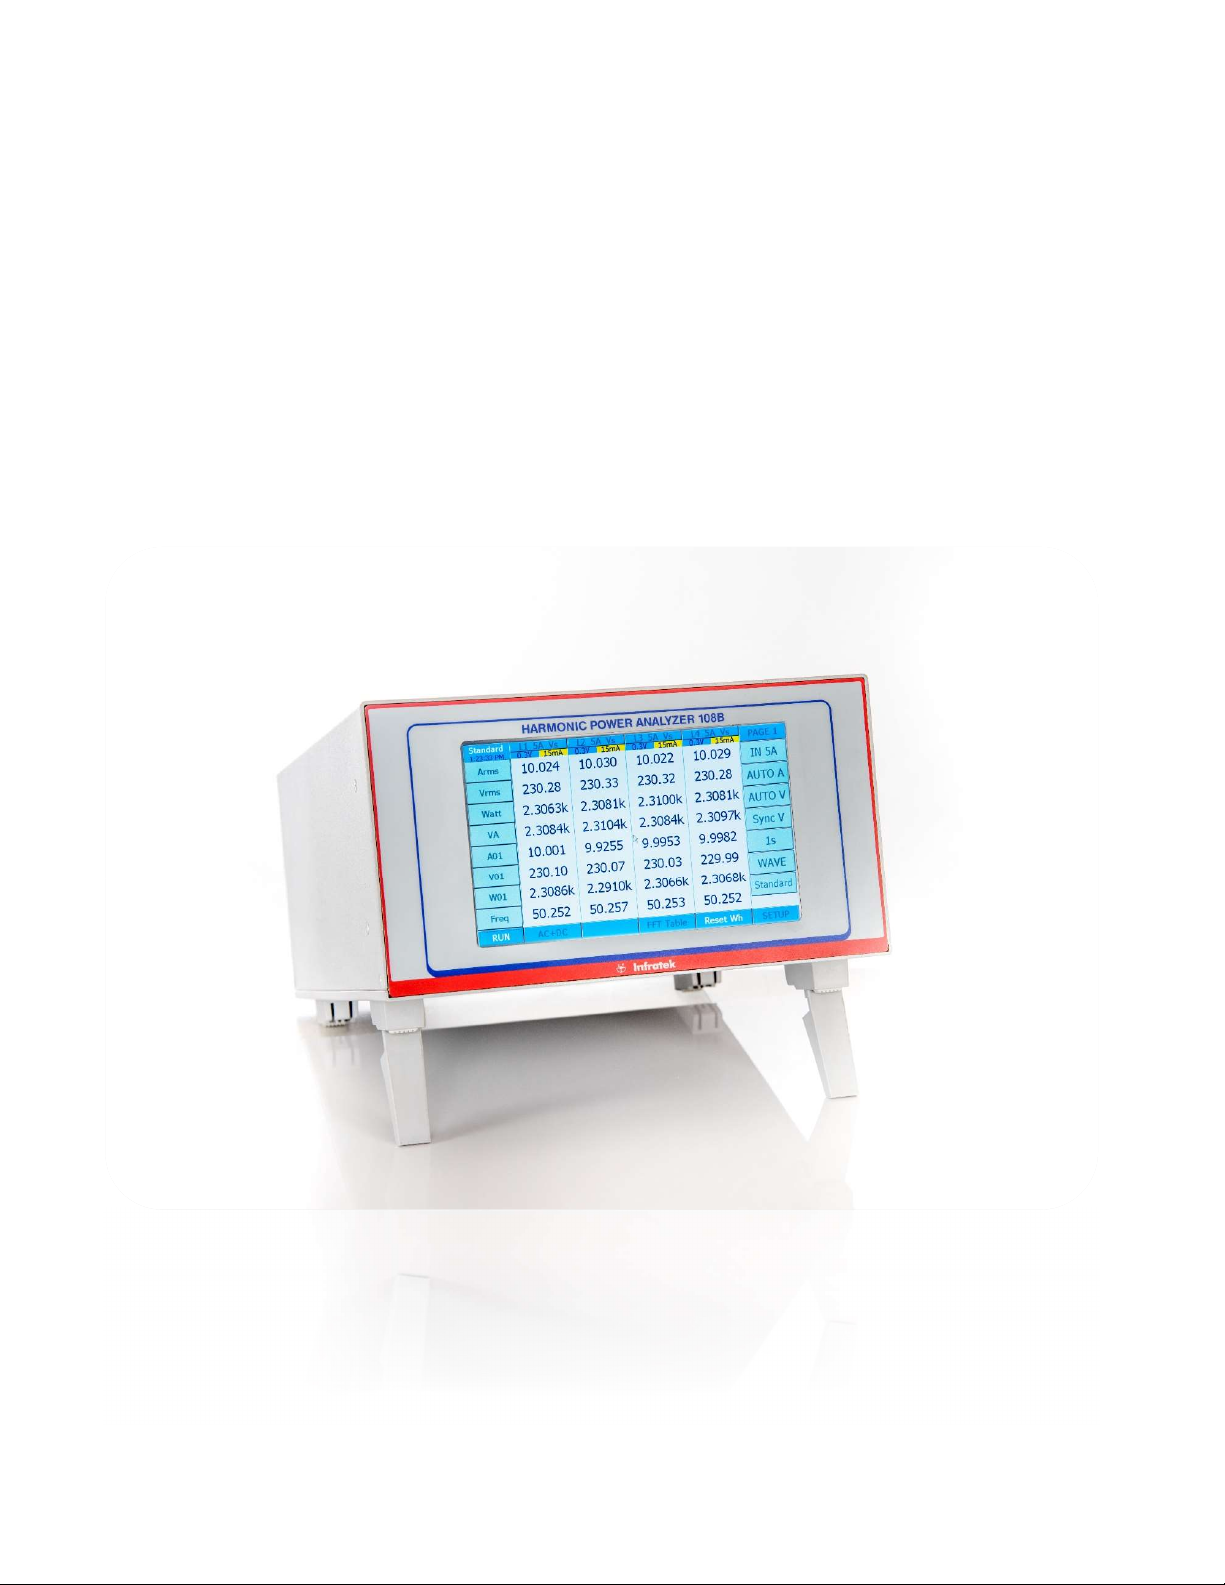
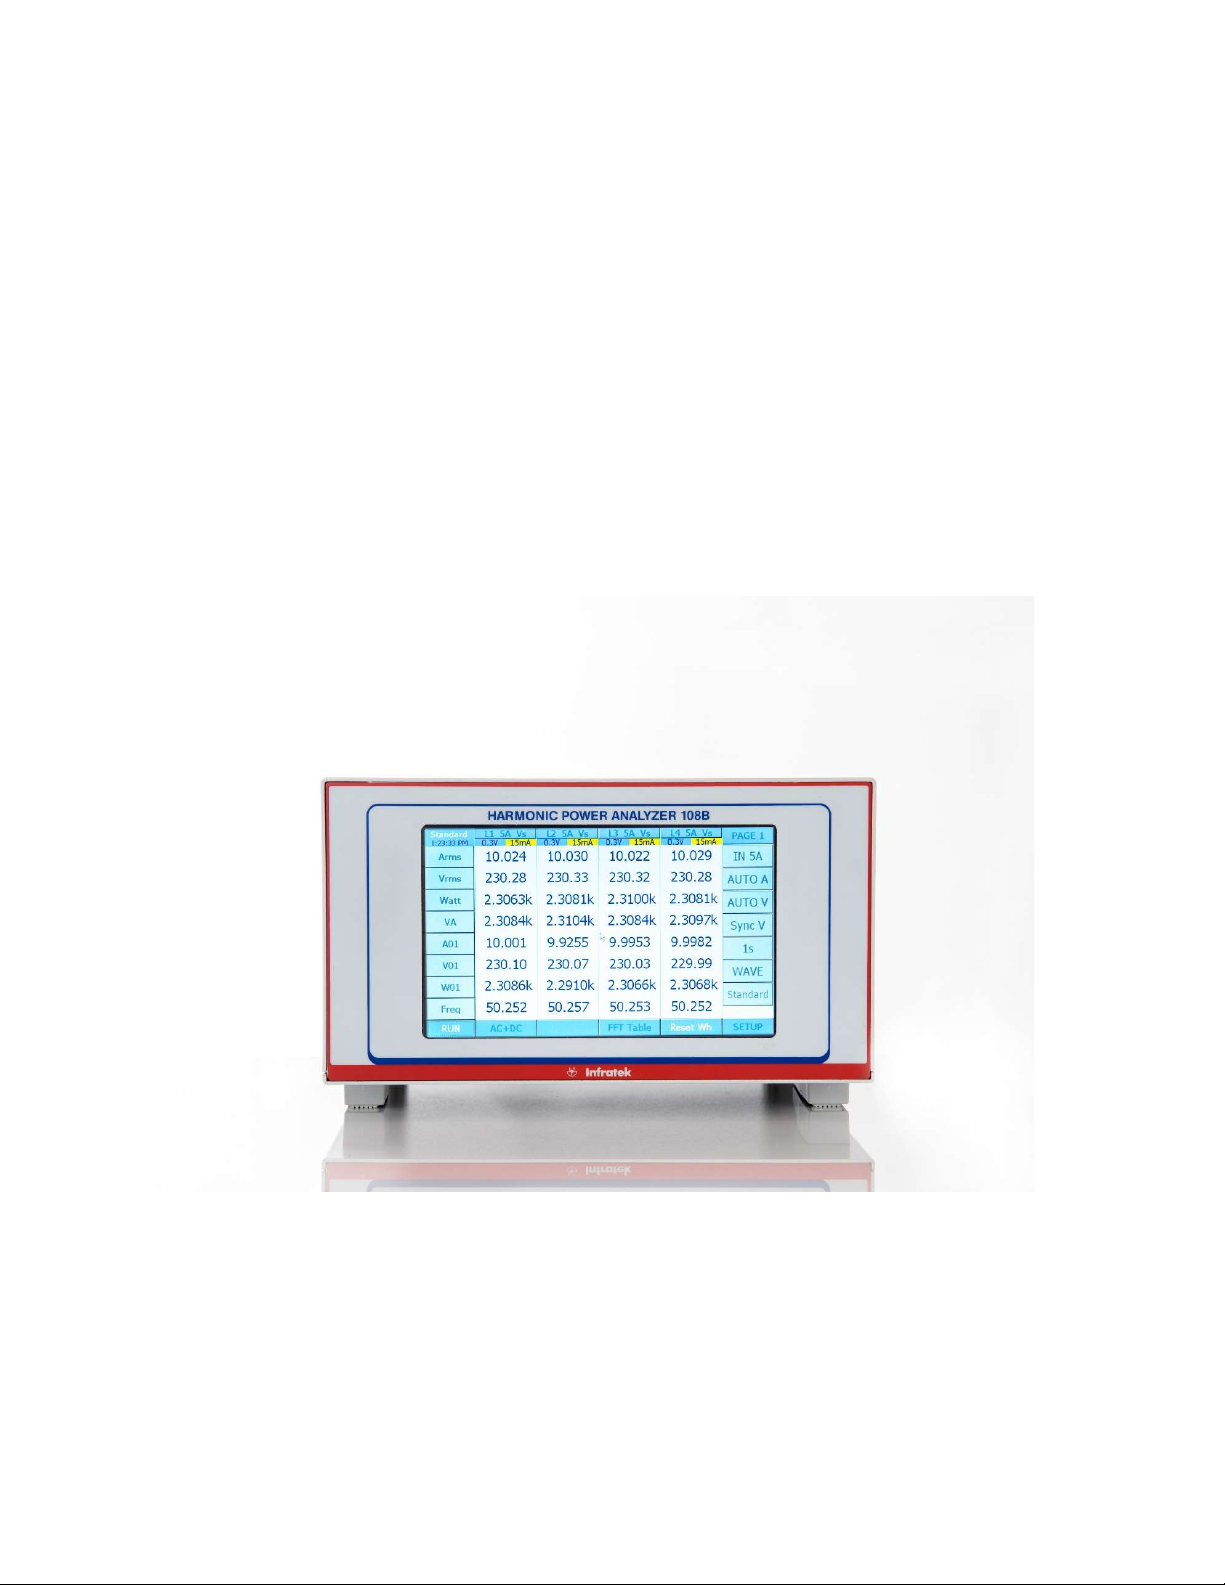
Figure 1.1 Shows the display of a 4-phase instrument in “Standard Mode”.
Figure 1.1 shows the display of a 4-phase instrument in “Standard Mode”. To change the cur-
rent range from 15mA to 500mA touch the button “AUTO A”. A pop-up window is presented
from which you select “500mA”. Now the Power Analyzer is in 500mA current range (manual
ranging).
page 6
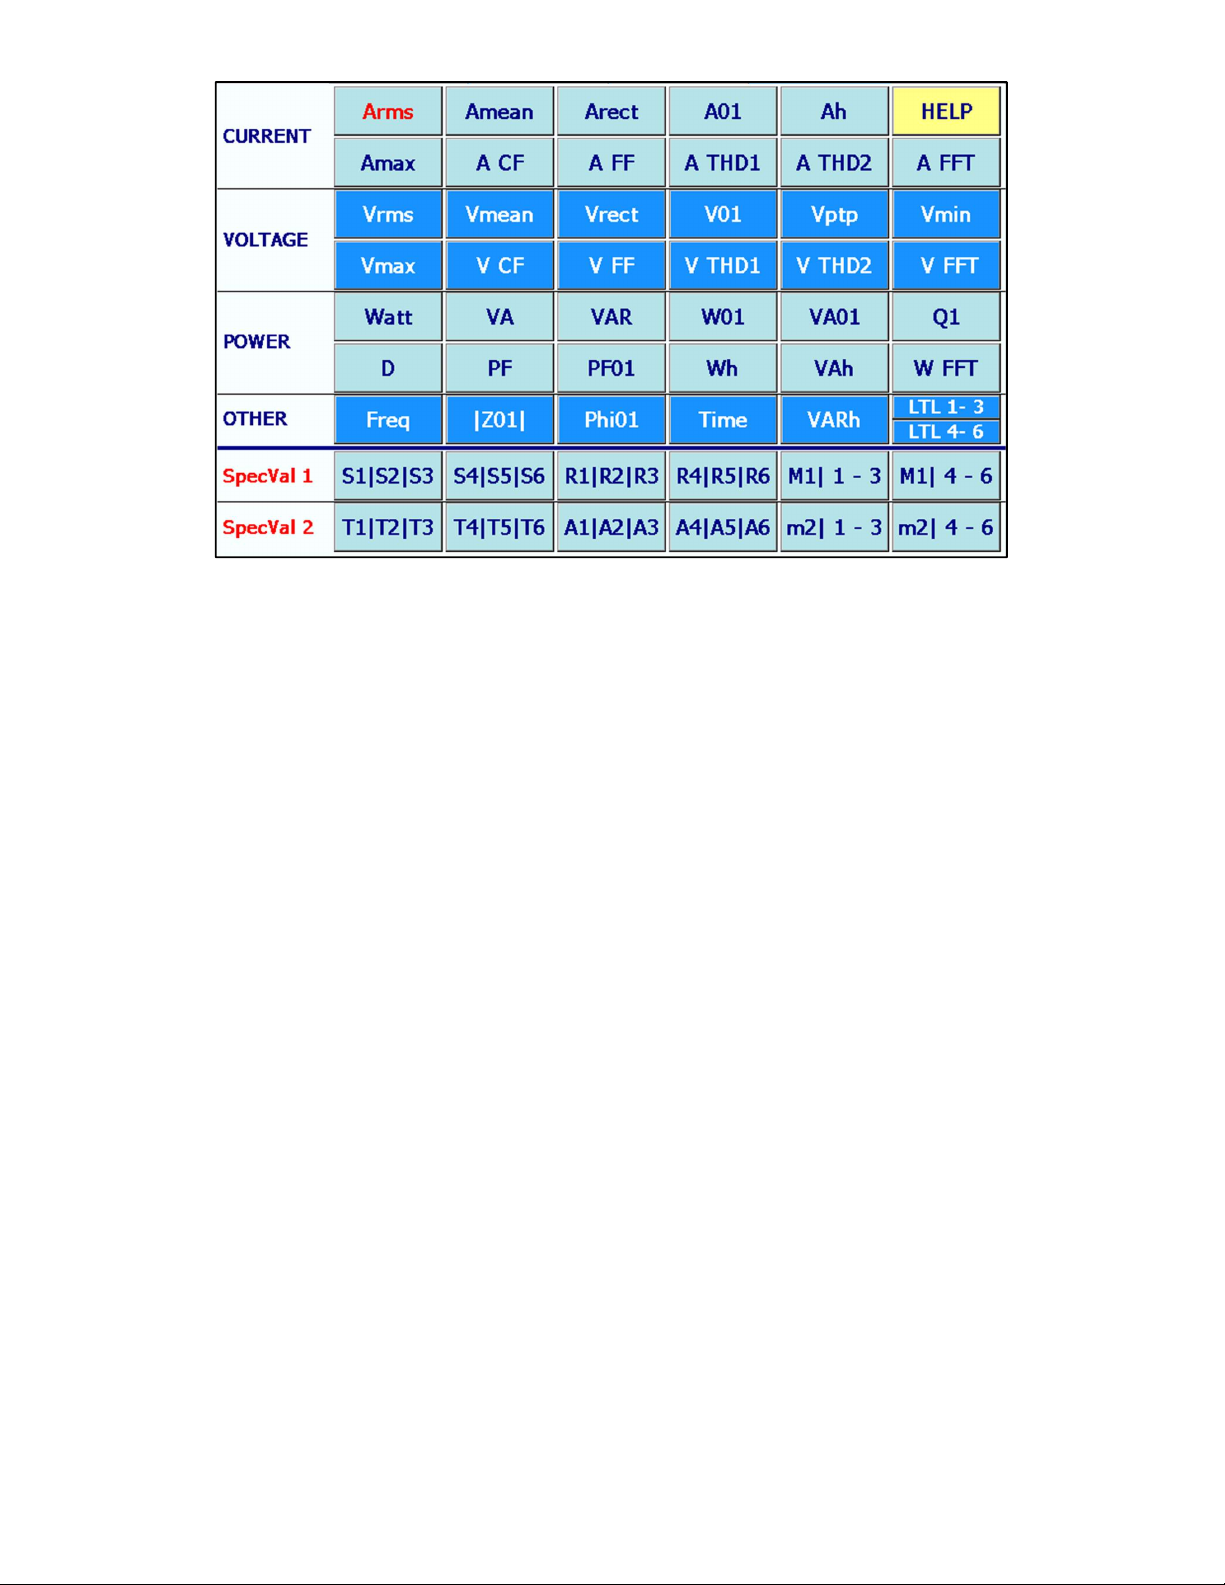
Figure 1.2 108B Value Selection Table
Just as simple is to change the quantity at the bottom line “Freq” to Arectified mean (Arect).
Touch “Freq” at the left side of the display. This will present you a value selection table as
shown in Figure 1.2. Now touch “Arect” which brings you back to Figure 1.1 with the bottom
line quantity changed to “Arect”.
Four different measure modes enhance the 108B Power Analyzer capabilities. These are:
standard measure mode, logging measure mode, transient measure mode, and power-speed
measure mode.
1.1 S
TANDARD
M
EASURE
M
ODE
In the Standard Measure Mode 280 quantities per phase are continuously measured
(no gaps) and are updated. Values can be displayed on four display pages, can be saved in
internal memory, or on a memory stick, or can be transferred via Interface to a computer.
Touching “WAVE” will display a sub-menu which lets you select the current-, voltage-, and
power wave forms of any phase.
Select “OFF” (Wave OFF). Now you have access to the buttons “FFT Table”. Touching
“FFT Table” selects “FFT L1”. On five pages you can now view the harmonics of current, volt-
age, power, and phase angle (harmonics 1 to 40 for current and voltage, harmonic 1-21 for
power and phase angle).
Similarly, selecting “FFT Bar” the bar graph of the harmonics will be displayed in percent of
the fundamental (1. harmonic).
Touching “FFT L1” will toggle to “FFT L2”, “FFT L3”, and so on.

page 7
1.2 L
OGGING
M
EASURE
M
ODE
The basic operation is as follows: Select the number of cycles for which you desire a periodic
data output to the RS232- / USB-interface. If you perform measurements on the 50Hz power
line and you select cycles = 1 you obtain new data every 20ms; if you select cycles = 30000
you obtain new data every 10 minutes.
Before starting the measurement, a valid synchronization signal 5Hz to 2kHz must be applied
to all installed phases of your Power Analyzer. Select Sync A, Sync V, or S_Ext V. Touch the
START-button to start the measurement, touch the STOP-button to stop it. DC signals can
also be measured (e.g. DC-motors). For DC you must apply an external synchronization sig-
nal in the frequency range 5Hz – 2kHz (select EXT synchronization).
Furthermore, the frequency of the synchronization can be varied up and down as much as
10% per second.
From every phase you obtain 8 values: frequency, RMS current, RMS voltage, power, power
factor, apparent power, energy Wh, and apparent energy VAh.
If you select the baud rate of 463.2 kBaud (in SETUP) a 4-phase Power Analyzer transmits
8 x 4 = 32 values in less than 20ms. This can be used to analyze the start-up behaviour of
power systems.
1.3 T
RANSIENT
M
EASURE
M
ODE
The transient measure mode can be used in two ways: You can catch current-, voltage-, and
power wave forms in a start-up on all phases simultaneously or you can view all wave forms
at a critical operating point in Standard Measure Mode (up to maximum 4 phases).
The duration of the measurement is set by changing in the SETUP menu the Transient-id
from 0 to 7. Sections of the wave forms can be expanded by simply touching one of the 4
“Zoom Sectors” (maximum zoom factor is 256).
For proper operation you must apply signal synchronization to all installed phases of your
Power Analyzer.
Figure 1.3 108B 3-Phase Power Analyzer Display in Logging Measure Mode
page 8
1.4 P
OWER
-S
PEED
M
EASURE
M
ODE
(O
PTION
)
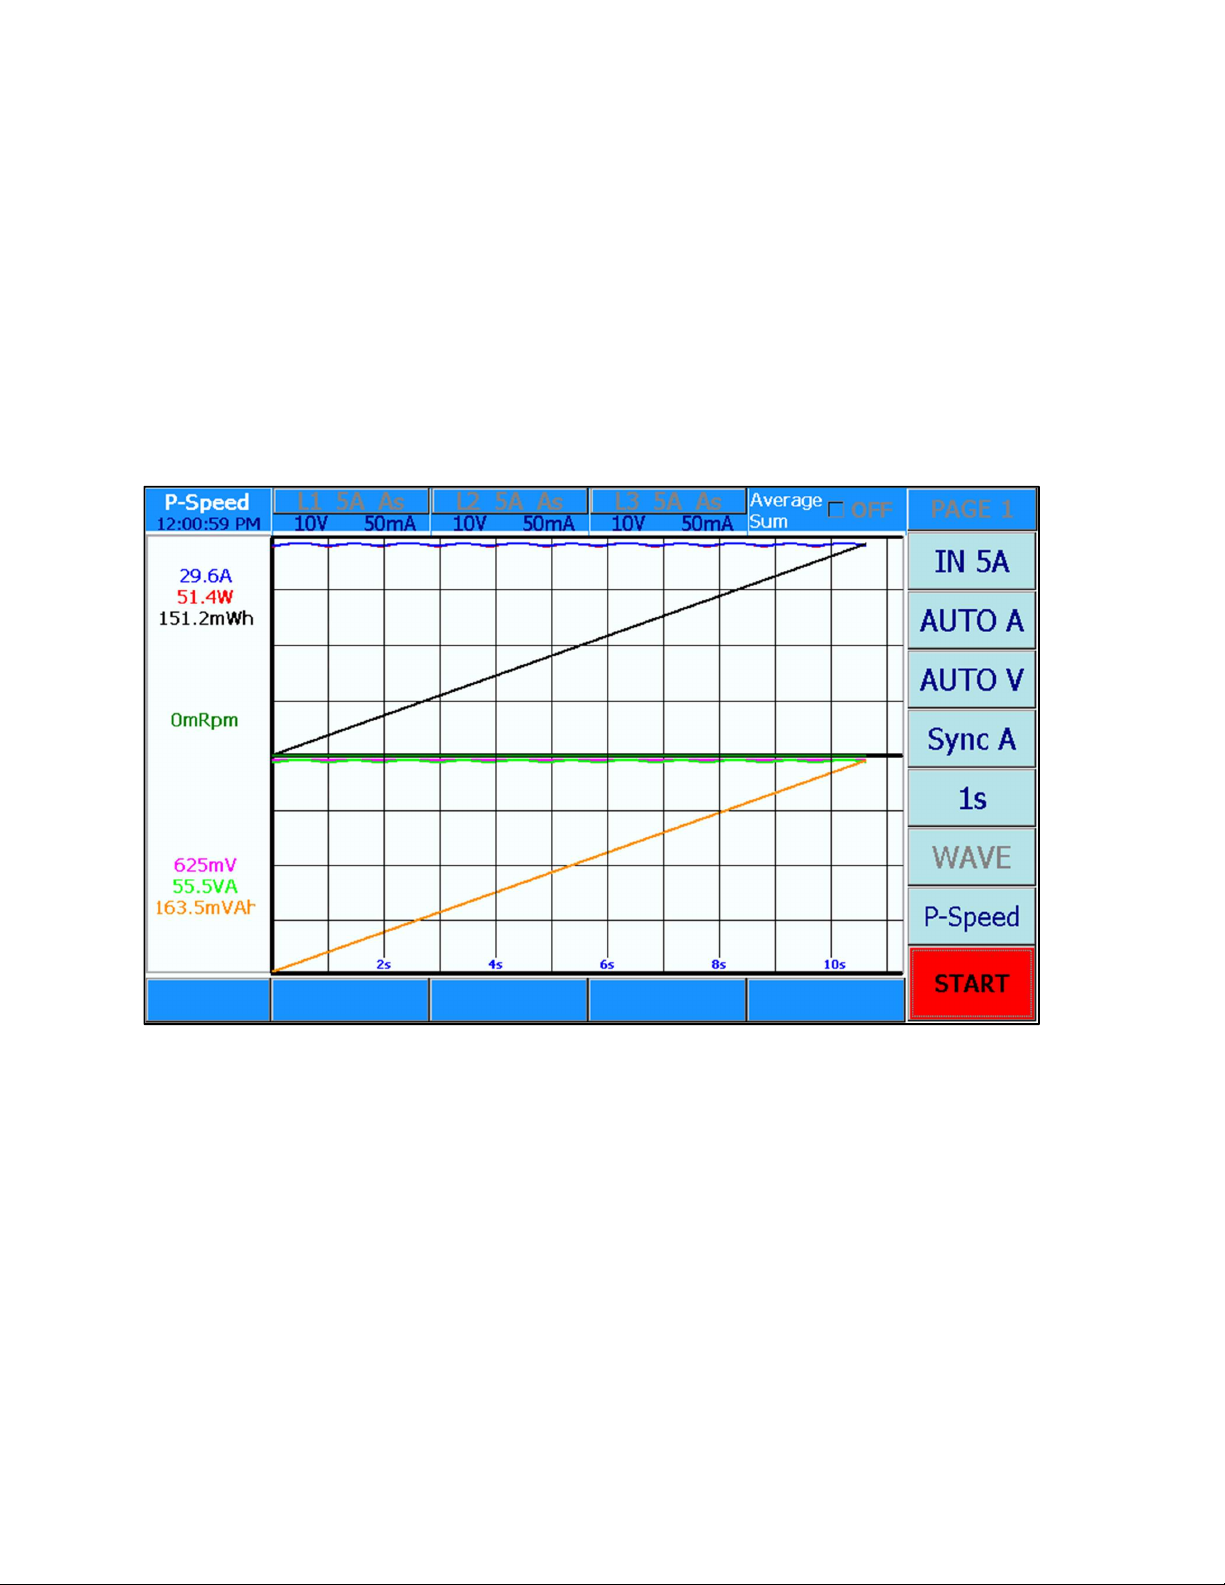
This measure mode analyzes the performance of electric devices such as electric cars.
In 20ms intervals the following data are stored in internal memory: RMS current, RMS volt-
age, power, apparent power, energy, apparent energy, and speed of an axis or a wheel. Rms
current and –voltage are average values of the number of phases used, power and energy
are the sums of phases used.
Power speed measurements can be performed on DC- as well as AC-drives using either
phase 1, or phase 1 and phase 2, or using phase 1, 2, and phase 3 of the Power Analyzer.
At the end of a measurement cycle (maximum 11 seconds) data versus time are plotted, can
be expanded to view details, or can be stored.
Figure 1.4 108B 3-Phase Power Analyzer in Power-Speed Measure Mode
page 9
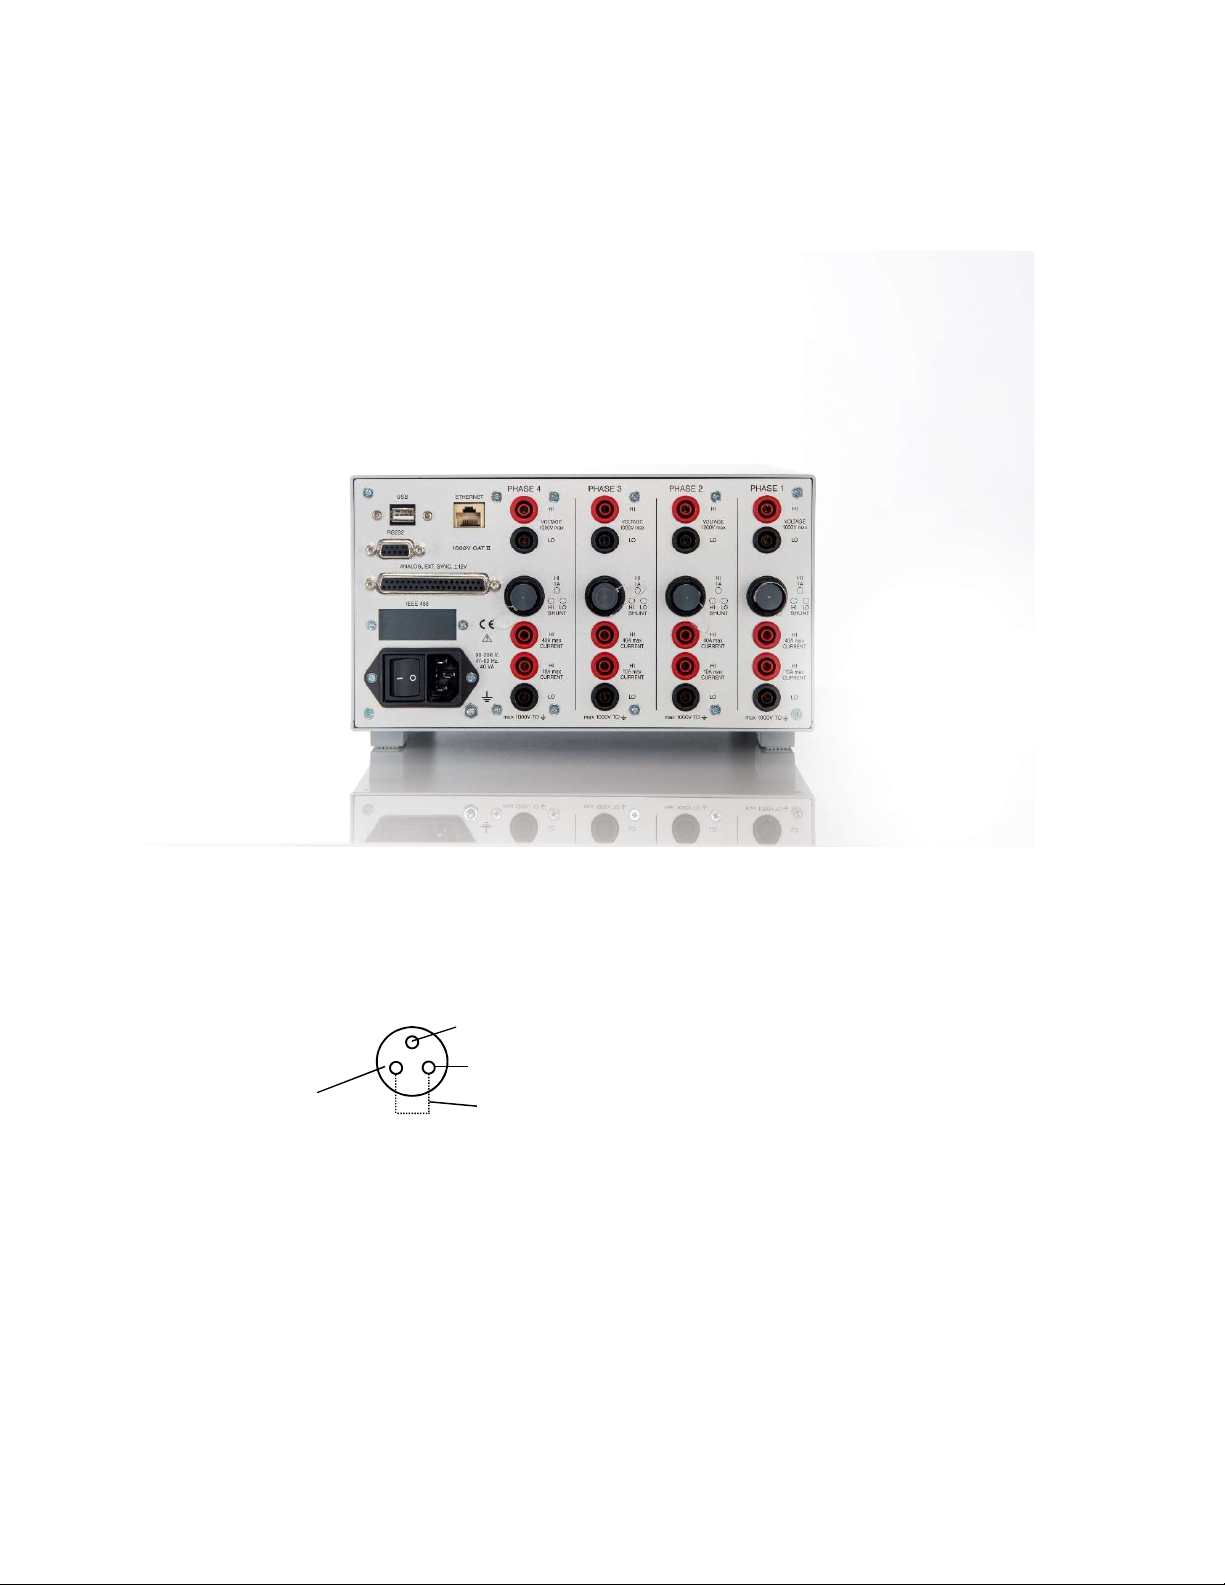
1.5 POWER ANALYZER REAR PANEL
Figure 1.5 shows the 108B rear panel with four phases installed. Every phase consists of a
potential free voltage input along the top side.
Below the voltage inputs are the 40A input, and the 5A input (7A max.) with common Lo
socket. Above the 40A socket is the 3 pole Amphenol socket for the 1A input and shunt input.
It is normally covered with the shunt short circuit cap.
Figure 1.5 Rear panel of a 4 Phase 108B Power Analyzer
All four current inputs are referenced to the black Lo socket and are potential free.
Figure 1.6 3 pole Amphenol Socket for 1A current input and shunt input
For use of 1A input remove the shunt short circuit cap and insert the 1A adapter. The 1A
adapter is the Hi input, and the black current socket is the 1A Lo.
Caution: When 1A adapter is removed the shunt short circuit cap must be inserted.
1A Input Hi, Lo at black 4mm
socket
Short circuit when clamp not used.
Shunt Hi
Shunt
Lo

page 10
1.6 SUMMARY OF 108B POWER ANALYZER FEATURES
Available as 1-, 3- and 4-phase instrument.
Highest precision available: 0.02 % reading + 0.02 % range.
18bit measurement resolution. High accuracy at 10 % full scale.
Wide angle, touchscreen TFT color display (800 x 480 pixels).
Simple to operate, most settings in 2 steps (2 touches).
Settings per phase for V- A-ranges, current inputs, and synchronization.
Standard-, Logging-, Transient-, Power-Speed measurement functions.
Standard: calculates all quantities of power electronics, including motor- and
transformer values, harmonics, energies, analog inputs, and speed.
Fast data transfer; up to 3400 values per second.
High DC precision for solar applications.
Includes 4 current inputs: 1mA - 1A, 15mA - 5A, 1A - 40A, shunt.
Voltage Ranges: 0.3V to 1000V.
USB memory stick >4GByte
USB interface for downloading measurement data
Optional interfaces: RS232, USB, Ethernet, IEEE-488
Optional: 2 frequency inputs max 150kHz, 6 analog inputs, and 12 analog outputs.
Interface commands for fast data transmission.
Operating software under Windows, LabView Driver
Reasonably priced by virtue of smart design.
Simple servicing, modular concept, pre-calibrated input amplifiers.
Optional high precision, broadband, current sensors.
Upgrading the number of installed phases is possible at any time

page 11
1.7 SAFETY INSTRUCTIONS
The manufacture of this equipment conforms to the safety standards defined in IEC 61010-1.
Protection: The device assigns to protection class and is equipped with a protective
earth stud.
This equipment may be operated only by qualified personnel. A qualified person has complet-
ed training to operate a Power Analyzer.
PROPER USE
Do not exceed maximum currents of the 1A-input, 5A-input, 30A-input, and the shunt input.
Do not exceed maximum voltages on voltage inputs. Do not exceed 1000V on any input ter-
minal with respect to case.
Improper use or modifying any part of the equipment shall void all warranty.
Warranty
The warranty period is 2 years from the date of purchase.
CONNECTING A POWER ANALYZER
Use a power line cable with earth connection
Inspect the connecting cable for faulty connection
Connect the rear panel earth stud to power ground
Make cable connections with the help of a second qualified person
Ensure that connected devices work properly
In case of direct connection to current circuits we recommend to use an external
protection circuit to not exceed the maximum current input in use (1A, 5A, 30A)
Refer Power Analyzer servicing and repair to authorized organizations
Use of this instrument in life support systems and in systems for people transportation
must be expressly authorized by the manufacturer
Use shielded cables for interface connections and keep interface cables away from
parts which can carry large currents and transients.

page 12
2. CONNECTION TO CIRCUITS
Please read section “Safety” of this manual before performing the measurements described
below.
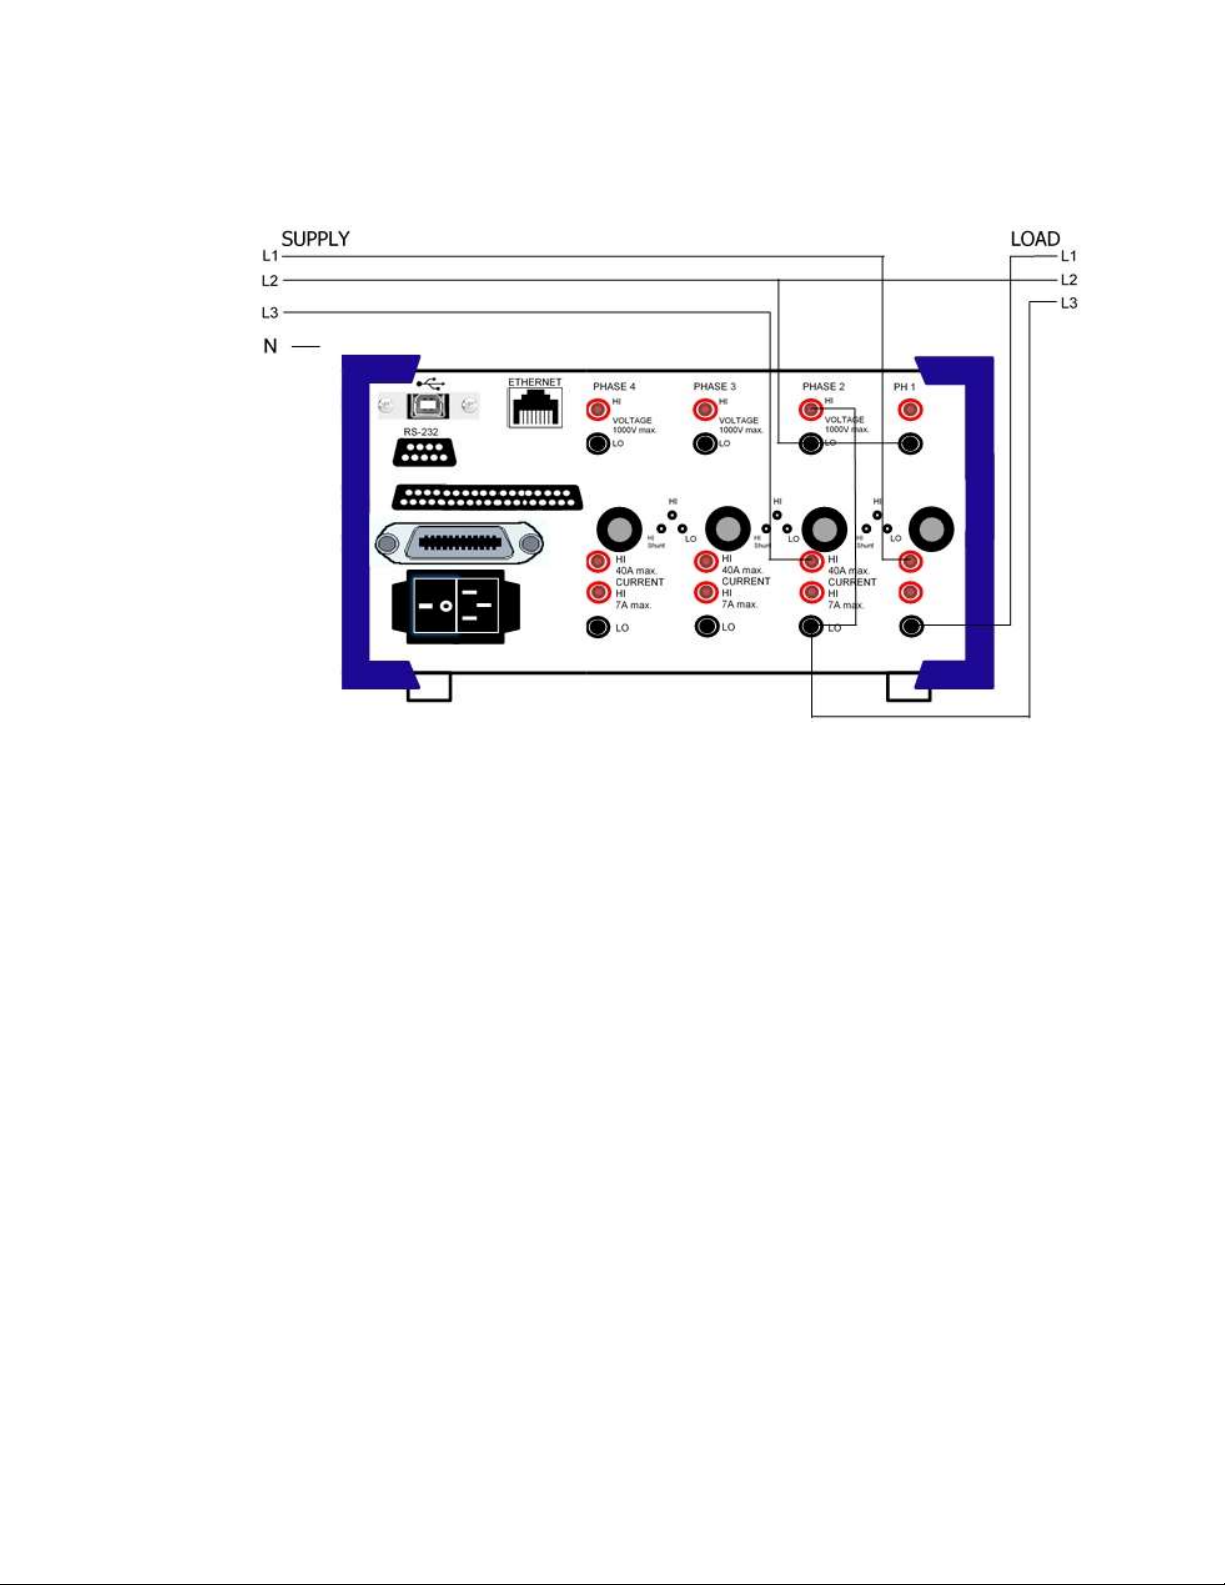
2.1 MEASUREMENT IN 3-PHASE MAINS CIRCUIT
2.1.1 THREE WATTMETER CONNECTION
Power and energy consumed by a load are positive values. This means that current Hi and
Lo, and voltage Hi and Lo must be connected in correct directions (polarity).
Rule 1: All currents flow from supply to load that is into the red current socket and from
current Lo (black socket) to input of load.
Rule 2: Connect current Lo to voltage Hi.
Connect all voltage Lo to power line neutral (3 wattmeter circuit)
Figure 2.1 Power Measurement in 3-phase mains circuit with neutral line using three
Wattmeter configuration. Rule 1 and Rule 2 apply.
Power values of the 3 phases are all positive. You can verify that power of phase 1 becomes
negative by reversing current phase 1.
page 13
2.1.2 ARON CONNECTION
Important! Do not use Aron Connection for unsymmetrical loads.
Figure 2.2 Measurement in 3-phase mains circuit using 2 Wattmeter configuration.
Rule 1 and Rule 3 apply.
Rule 3: Voltage Lo connects to third wire not used for current measurement
(Figure 2.2). Phase to phase voltages are measured.
The 2 Wattmeter circuit measures 2 currents, and 2 line-to-line voltages and determines total
power of the 3 phase load. One of the displayed power values can become negative due to
phase shifts of inductive loads. This may lead to confusion. Therefore, strictly follow rule 1
and rule 3.

page 14
3. 108B MATHEMATICAL DEFINITIONS AND SPECIFICATIONS
3.1 MATHEMATICAL DEFINITIONS
Tables 3.1 and 3.2 define all quantities measured and computed. The “batch” column shows
the symbol that must be used in the interface batch command of section 6 (setting the quanti-
ties viewed on the display).
Table 3.1. List of standard values that can be displayed
Description Symbol = Formula, Description Batch
rms current Arms = (1/T T
0 A2 dt)1/2, includes all harmonics A00
mean current Amean = 1/T T
0 Adt, dc-component of current A01
rectified mean current Arect = 1/T T0 lAl dt, rectified mean current A02
peak current Amax = maximum current in time interval A10
current distortion Athd1 = (Arms2 – A012)1/2 / Arms, use for fre-
quency inverter
A23
harmonic current distor-
tion
Athd2 = (
An2)1/2 / Arms, n = 2,3, … 40 A25
current crest factor Acf = Amax / Arms A20
current form factor Aff = Arms / Arect, is 1.1107 for sine wave A22
current fundamental A01 = fundamental current of FFT A35
current 2. to 7. harm A02,A03,A04,A05,A06,A07 A3,A39,A41,A43,A45,A47
current 8. to 13. harm A08,A09,A10,A11,A12,A13 A49,A51,A53,A55,A57,A59
rms voltage Vrms = (1/T T
0 V2 dt)1/2, includes all harmonics A03
mean voltage Vmean = 1/T T
0 Vdt, dc component of voltage A04
rectified mean voltage Vrect = 1/T T
0 IVI dt, rectified mean voltage A05
peak voltage Vmax = maximum voltage in time interval A13
lowest voltage Vmin = lowest voltage in time interval A12
peak to peak voltage Vptp = Vmax – Vmin A11
voltage distortion Vthd1 = (Vrms2 – V012)1/2 / Vrms, use for fre-
quency inverter
A24
harmonic voltage distor-
tion
Vthd2 = (
Vn2)1/2 / Vrms, n = 2,3, …, 40 A26

page 15
Table 3.1: continued. List of standard value that can be displayed
Description Symbol = Formula, Description Batch
voltage crest factor Vcf = Vmax / Vrms A19
voltage form factor Vff = Vrms / Vrect, is 1.1107 for sine wave A21
voltage fundamental V01 = fundamental voltage of FFT A36
voltage 2. to 7. harm V02,V03,V04,V05,V06,V07
A38, A40, A42, A44, A46, A48
voltage 8. to 13. harm V08,V09,V10,V11,V12,V13
A50, A52, A54, A56, A58, A60
active power W = 1/T T0 ui dt, total power in W A06
apparent power VA = Arms Vrms, total apparent power VA A17
reactive power Var = (Papp2 – Pact2)1/2, reactive power Var A18
power factor PF = Pact / Papp, includes all harmonics A27
fundamental power W01 = A01
V01
cos
01,
01 = phase A61
fund apparent power VA01 = A01
V01 A29
fund reactive power Var01 = (VA012 – W012)1/2, magnitude only A30
fund power factor PF01 = W01 / VA01 A28
power 2. to 6. harm W02, W03, W04, W05, W06 A63, A65, A67, A69, A71
power 7. to 10. harm W07, W08, W09, W10 A73, A75, A77, A79
power of distortion D = V01(An2)1/2, n = 2,3, …, 40; D in Watt A31
energy Wh = t
0 Pact
dt, active energy in Wh A14
apparent energy VAh = t0 Papp dt, use it for long term PF A15
reactive energy VAR = t0 Prea dt, can be positive / negative A16
battery charge Ah = t0 Arect dt, is positive only A09
elapsed time time = t0 dt, time in hours since RESET A32
magnitude impedance Mag Z = V01 / A01 fundamental A33
phase of fundamental Phi01 = phase V01, A01 A34
phase 2. to 6. harm phase 2., 3., 4., 5., 6. harmonic A64, A66, A68, A70, A72
phase 7. to 10. harm phase 7., 8., 9., 10. harmonic A74, A76, A78, A80,
frequency Freq = zero crossing of A, V, Ext; SYNCI, U, Ext A07
Note: Harmonic values not contained in table 3.1 can be read via interface:
These are: current A14 to A88 and voltage V14 to V88.

page 16
Table 3.2: List of special values that can be displayed
Description Symbol = Formula, Description batch
sum1 of power sum1 = Pact1 + Pact2 + Pact3; Power phase 1+2+3
A81
sum2 of power sum2 = Pact1 + Pact2
sum3 of power sum3 = not used
sum4 of power sum4 = not used
A82
sum5 of power sum5 = not used
sum6 of power sum6 = not used
ratio1 of power ratio1 = Pact4 / Pact1 + Pact2 + Pact3
A83
ratio2 of power ratio2 = Pact3 / Pact1 + Pact2
ratio3 of power ratio3 = Pact2 / Pact1
ratio4 of power ratio4 = not used
A84
ratio5 of power ratio5 = not used
ratio6 of power ratio6 = not used
Motor1 Values from phase 1, phase 2, and phase 3
Mec input power Pin = electric power applied to motor
A85
Mec output power Pout = Pin – Pin at no load in Watt (Loss)
Torque Torque = Pout
poles1 / 4
3.1416
frequency1
Slip Slip = 1 – fout / fin
A86
rotation per minute rpm = 120
frequency1 / poles1
efficiency efficiency = 1 – Pin at no load / Pin
Transformer values from phase 1 and phase 2
Vrect, rms corrected Vcorrected = 1.1107
Vrect
A87
correted power Corr power = Pact 1 / (0.5 + 0.5 Vrms / Vcorrected)
Loss factor Q Q = tan X/R, where Z=R + jX

page 17
Table 3.2: List of special values that can be displayed
Description Symbol = Formula, Description batch
Loss resistance Equivalent loss resistance = Pact1 / Arms2
A88
Loss inductance Equivalent loss reactance = Prea 1 / Arms2
turn ratio turn ratio = N2 / N1 = Vrms2 / Vrms1, no load
analog input1
5V analog input1
A89
analog input2
5V analog input2
analog input3
5V analog input3
analog input4
5V analog input4
A90
analog input5 10V analog input5
analog input6 10V analog input6
V1 line to line V1 ltl = (V1rms + V2rms) 0.86603
A93
V2 line to line V2 ltl = (V2rms + V3rms)
0.86603
V3 line to line V3 ltl = (V3rms + V1rms)
0.86603
V4 line to line not used
A94 V5 line to line not used
V6 line to line not used
Motor2 Values from phase 4, phase 5, phase 6
Mec input power not used
A95
Mec output power not used
Torque not used
Slip not used
A96
rotation per minute not used
efficiency not used
Example:
Assuming you are using a 2-phase Power Analyzer and want to display ratio 3 = Pact2 /
Pact1 at the bottom of the display (Figure 1.1). Touch icon, “Ah” (Fig. 1.1). In the value selec-
tion table touch “R1|R2|R3” (Fig. 1.2).
In Figure 1.1 at the bottom line you have now 3 quantities displayed: ratio1, ratio2, ratio3,
where ratio1 = 0, ratio2 = 0, and ratio3 = Pact2 / Pact1.

page 18
3.2 SPECIFICATIONS
Voltage Measurement
% reading
+ % range
8 me
asuring ranges: 0.3V
1)
–
1V
–
3V
–
10V
–
30V
–
100V
–
300V
–
1000V
Bandwidth DC
-
2MHz
Coupling: AC or AC + DC
Common mode rejection:
100dB at 100kHz
Input impedance: 1M
/ 15pF. Floating input
max. 1000Vrms
Crest Factor 15:1 at 10% fs. Typical accurac
y at 10% is 0.1%
fs = full scale
Temperature coefficient: 0.004% /
C
Standard accuracy 23
C ±1
C. 3V to 600V
45 to 65Hz 0.08 + 0.08
3 to 1000Hz 0.1 + 0.1
1 to 10kHz 0.2 + 0.2
10 to 100kHz (0.2 + 0.2) + (0.2 + 0.2)*log(f/10kHz)
DC1)//100-500kHz1) 0.1 + 0.1// 0.012*f(kHz)
High precision
10V to 600V
0.02 + 0.02
0.03 + 0.03
0.1 + 0.1
(0.2 + 0.2) + (0.2 + 0.2)*log(f/10kHz)
Linearity 100V range:
130 %
100 %
50 %
10 %
5 %
130.01V 100.00V 49.988V 10.000V 5.0014V
Typical linearity at 50/60Hz
Voltage Scalin
g U1
-
U
4
Individual voltage scaling factors of every phase. Use pop
-
up number pad.
Format 2000.8.
Measured & Computed Voltage Values
RMS voltage
Vrms = (1/T T
0 V2 dt)1/2, includes all harmonics
Voltage crest factor
Vcf = Vmax / Vrms
Mean voltage
Vmean
= 1/T
T
0
Vdt, dc component of voltage
Voltage form factor
Vff = Vrms / Vrect, is 1.1107 for sine wave
Rectified mean voltage
Vrect = 1/T
T
0
IVI dt, rectified mean voltage
Voltage fundamental
V01 = fundamental voltage of FFT
Peak voltage
Vmax = maximum
voltage in time interval
V1 line to line
V1 ltl = (V1rms + V2rms)
0.86603
Lowest voltage
Vmin = lowest voltage in time
interval
V2 line to line
V2 ltl = (V2rms + V3rms)
0.86603
Peak to peak voltage
Vptp = V
max
–
V
min
V3 line to line
V3 ltl = (V3rms + V1rms)
0.86603
Voltage distortion
Vthd1 = (Vrms
2
–
V01
2
)
1/2
/ Vrms,
2)
Harmonic voltage distortion
Vthd2 = (
Vn
2
)
1/2
/ Vrms, n = 2,3, …, 40
Current Measurement
% reading
+ % range
4 inputs: In30A, In5A, In1A, shunt.
Floating inputs. 1 se
c averaging.
max. 1000Vrms to earth
In1A: 6 ranges 1.5mA
1)
-
5mA
-
15mA
-
50mA
-
150mA
-
500mA
-
1500mA. DC
-
100kHz
max. 2A continuous
In5A: 6 ranges: 15mA
1)
-
50mA
-
150mA
-
500mA
-
1.5A
-
5A
-
15A. DC
-
100kHz
max. 7A continuous
In30A: 4 ranges
: 1A
1)
-
3A
-
10A
-
30A
-
100A.
DC
-
100kHz
max. 40A/30A
cont., 1
-
4phase
Shunt: 60mV - 200mV - 600mV - 2V - 6V. DC-100kHz max. 30V continuous
Coupling: AC or AC + DC
Common mode rejection:
115dB at 100kHz
Crest factor 15:1 at 10% fs. T
ypical accuracy at 10% fs is 0.1%
fs = full scale
Temperature coefficient: 0.004% /
o
C
Standard accuracy 23
o
C ± 1
o
C
Input In1A, In5A, Shunt In30A
45 to 65Hz 0.08 + 0.08 0.08 + 0.08
3 to 1000Hz 0.1 + 0.1 0.2 + 0.2
High precision In1A/In5A
15,50,150,500mA,1A/150,500mA,1.5,5A
0.02 + 0.02
0.03 + 0.03
1 to 10kHz
0.15 + 0.15
0.15 + 0.15
10 to 100kHz
(0.15+0.15)
+
(0.5+0.5)*log(f/10kHz)
(0.15+0.15)
+ (0.5+0.5)*log(f/10kHz)
DC
1)
//100
-
500kHz
1)
0.1 + 0.1// 0.023*f(kHz)
Current
Sensors
0
-
150Ap
eak 0
-
400Apeak 0
-
600Apeak 0
-
700Apeak
45 to 65Hz 0.004 + 0.004 0.004 + 0.004 0.002 + 0.002 0.01 + 0.01
3 to 1000Hz 0.01 + 0.01 0.01 + 0.01 0.01 + 0.01 0.02 + 0.02
Ex
posure of current inputs to
their max. value
will result in additional errors1)
In1A: 0.03% * I2
In5A: 0.003% * I2
In30A: 0.0001% * I2
Input
0
-
100A
precision current sensor
(Option 04) connected to In1A input
3 to 100Hz 0.05 + 0.05
100 to 1000Hz 0.1 + 0.1
Linearity 500mA
range:
130 %
100 %
50 %
10 %
5 %
650.02mA 500.02mA 250.02mA 49.979mA 24.997mA
Typical linearity at 50/60Hz
Shunt Sensitivity:
60mV/A. For an external shunt with 1mV/A scale by 60.0
Current Scaling I1
-
I
4
Individual current scaling factors of every phase. Use pop
-
up number pad.
For
mat 2000.8.
Measured & Computed Current Values
RMS current
Arms = (1/T T
0 A2 dt)1/2, includes all harmonics
Current distortion
Athd1 = (Arms
2
–
A01
2
)
1/2
/ Arms,
2)
Mean
current
Amean = 1/T T
0 Adt, dc-component of current
Harmonic current distortion
Athd2 = (
An2)1/2 / Arms, n = 2,3, … 40
Rectified mean current
Arect = 1/T T
0 lAl dt, rectified mean current
Current crest factor
Acf = Amax / Arms
Peak current
Amax = maxi
mum current in time interval
Current form factor
Aff = Arms / Arect, is 1.1107 fo
r sine wave
Current fundamental
A01 = fundamental current of FFT
1) Typical max. Error2) Used for frequency inverter

page 19
Power Measurement
% reading
+% range
W range =
voltage range times current range
112 power ranges
Standard accuracy 23
o
C ± 1
o
C
Input PF In1A, In5A, Shunt
45 to 65Hz 0-1 0.16 + 0.16
45 to 65Hz 0-0.05
3 to 1000Hz 0-1 0.2 + 0.2
High precision
In1A, In5A, Shunt
0.04 + 0.04
0.01 + 0.01
0.1 + 0.1
1
to 20kHz
0
-
1
0.2
+
(0.2 + 0.2*log (f/100Hz) + 0.08*k1*log (f/100Hz))
20 to 100kHz 1 %error (A+V) %error (A+V)
DC
1)
//100
-
500kHz
1)
1
0.2 + 0.2// add %error (V+A)
Input
PF
In30A
Current Sensor 0
-
100A
45 to 65Hz 0-1 0.16 + 0.16 0.1 + 0.1
3 to 1000Hz
0
-
1
0.2
+
(0.2+0.2 * log(f/3Hz) + 0.1 *k1 * log(
f/3Hz)
DC1) 0.2 + 0.2 0.1 + 0.1
PF 1
0.9
0.8
0.7
0.6
0.5
0.4
0.3
0.2
0.1
0
k1 0.5 0.74 0.97 1.18 1.38 1.55 1.70 1.83 1.92 1.98 2.00
k1 = (2
–
PF
4
)
/ (1+PF
2
)
1) Typical max. error
W Linearity
130%
100%
50%
10%
5%
Volt 130.00 100.00 49.985 9.9992 4.9990
Ampere 6.5004 5.0014 2.5020 500.82m 250.40m
Watt PF=1 844.74 500.07 125.05 5.0056 1.2522
Typical linearity of voltage, current
and power
Measured & Computed Power Values
Active power
W = 1/T
T
0
u
i dt, total power in W
Fundamental p
ower
W01 = A01
V01
cos
01,
01 = phase
Apparent power
VA = Arms
Vrms, total apparent power VA
Fundamental apparent power
VA01 = A01
V01
Reactive power
Var =
(Papp2 – Pact2)1/2, reactive power Var
Fundamental reactive power
Var01 = (VA01
2
–
W01
2
)
1/2
, magnitude only
Power Factor
PF = Pact / Papp, includes all harmonics
Power of distortion
D = V01(
An2)1/2, n = 2,3, …, 40; D in Watt
Power Factor of Fundamental
PF01 = W01 / VA01
Frequency Measurement
SyncA:
2Hz
-
5kHz
SyncV: 2Hz-150kHz
S_ExtV: 2Hz-150kHz
S_ExtV is a TTL output for SyncA/V or a TTL input for S_ExtV
Accuracy: 0.05 %
Accuracy: 0.05 %
Accuracy: 0.05 %
Sync for each phase
Measured & Computed Values
Frequency
Freq =
zero crossing of A, V, Ext; SYNC I, SYNC U, Ext; Accuracy 0.05%
Energy Measurement
Wh, VAh, Varh, Ah, integration time. Add accuracy % of values involved.
Reset sets all values to zero. Integration runs uninterrupted, also in the background.
Measured & Computed Values
Energy
Wh =
t
0
Pact
dt, active energy in
Wh
Battery charge
Ah =
t
0
Arect
dt, is positive only
Apparent energy
VAh =
t
0
Papp
dt, use it for long term PF
Elapsed time
time =
t
0
dt, time in hours since RESET
Reactive energy
VAR = t
0 Prea
dt, can be positive / negative
Time
Accuracy: 0.0
5 %
Harmonic Measurement
Frequency range of fundamental 3Hz
–
15kHz
Harmonics: V and A: 1-88; W and phase angle 1-21
Accuracy: Fundamental1), use % figures of V, A, W
FFT averaging:
Set FFT ID = 0, 1, 2, 3, 4 which corresponds to averaging over 4, 16, 64, 256,
or 1024 periods.
H
armonic Display: Select button ‘
FFT Table
’ to view current
-
, voltage
-
, power
-
, impedance
-
, and phase harmonics 1
-
40. A single harmonic can be dis-
played by selecting A FFT, V FFT or W FFT. The whole range of harmonics can be read via interface.
Measured & Computed Values
Magnitude impedance
Mag Z = V01 / A01 fundamental
Phase of fundamental
Phi01 = phase V01, A01
page 20
Additional Computed Values
Accuracy: Add % figures of values involved
65 values per phase
Rectified mean
, VA, Var,
impedance, distortion factor, power factors, motor
-
and transformer values, sums, ratios, analog inputs and
-
outputs, speed
inputs, and more are continuously updated and ready for display or interface output.
1) Typical max. Error
Measured & Computed Values
Sum1 of power
Sum1 = Pact1 + Pact2 + Pact3; Power phase 1+2+3
Ratio1 of power
Ratio1 = Pact4 / Pact1 + Pact2 + Pact3
Sum2 of power
Sum2 = Pact1 + Pact2
Ratio2 of power
Ratio2 = Pact3 / Pact1 + Pact2
Ratio3 of power
Ratio3 = Pact2 /
Pact1
Motor Measurement
Measured & Computed Values from phase
1, phase 2, phase 3
Measured & Computed Values from phase 4,
phase 5, phase 6
Mechanical input power
Pin = electric power applied to motor
Mechanical input power
Not used
Mechani
cal output power
Pout = Pin
–
Pin at no load in Watt (Loss)
Mechanical output power
Not used
Torque
Torque = Pout
poles1 / 4
frequency1
Torque
Not used
Slip
Slip = 1
–
fout / fin
Slip
Not used
Rotation per minute
rpm = 120
frequency1 / poles1
R
otation per minute
Not used
Efficiency
efficiency = 1
–
Pin at no load / Pin
Efficiency
Not used
Transformer Measurement
Measured & Computed Values from phase 1 and phase 2
Vrect, rms corrected
Vcorrected = 1.1107
Vrect
Loss resistance
Equivalent l
oss resistance = Pact1 / Arms
2
Corrected power
Corr power = Pact 1 / (0.5 + 0.5
Vrms / Vcorrected)
Loss inductance
Equivalent loss reactance = Prea 1 / Arms
2
Loss factor Q
Q = tan X/R, where
Z=R + jX
Turn ratio
Turn ratio = N2 / N1 = Vrms2 / Vrms1, no
load
Analog Input / Output
Analog Input
Analog Output
4 Analog inputs (I1
-
I4)
2 analog inputs (I5-I6)
2 TTL auto ranging speed
inputs 20Hz-150kHz
5V, 100k
input impedance, accuracy 0.2%1)
10V, 100k input impedance, accuracy 0.2%1)
Accuracy 0.1%1). Reading rate in Standard-Mode
0.5sec, reading rate in Power Speed-Mode 20ms
Each input can be scaled 0.0001 up to 99999
12 analog outputs
(O1-O12)
5V, 1k
output impedance, accuracy 0.2%1)
Update rate 0.5sec. Arms, Vrms, W, VA, Var, PF,
Frequency, and Wh can be sent to the analog
outputs. In Logging- and Power Speed-Mode
output1 is an actuator to Start/Stop ext. devices.
Scaling An1
-
An6
Individual analog scalin
g. Use pop
-
up number pad.
Format 10.0.
Scaling rpm1
-
rpm2
TTL freq1/rpm1 and freq2/rpm2 scali
ng. Use pop
-
up number pad. Format 2.0. For 180 pulses per turn, scaling = 1.0000
Four Measuring Functions
Standard
1
, 3 and 4
phase, measures all
electrical values at 0.8s updates or 100ms updates.
Logging
Up to
32
values in 20ms, or long time averagi
ng up to 10 minutes.
Transient
Simultaneous V
-
, A
-
, W
-
waves on
4
phases, time 0.25 to 16 seconds.
Power
-
Speed
Measures in 20ms intervals V, A, W, VA
, Wh, VAh, speed of rotating devices.
1) Typical max. Error
Table of contents
Other Infratek Measuring Instrument manuals


