7
KEY OTDR TRACE PARAMETERS
SECTION 2: OTDR TESTING
POWER ON/OFF
POWER ON
Press to power on the OTDR.
When the OTDR has completed startup, the trace area will either be blank, as shown at right,
or will show the previously viewed trace.
Continue below for more information about running a new OTDR trace.
POWER OFF
The OTDR may be powered off from any screen by holding .
Below is a descriptive list of key OTDR trace parameters.
WAVELENGTH – range of values: Multimode: 850, 1300, BOTH; Singlemode: 1310nm, 1550nm, BOTH. Allows the user to
select one or two wavelength(s) used for testing. Wavelength selection only applies to dual-wavelength OTDR.
INDEX OF REFRACTION – range of values: 1.4000 to 1.6000. To ensure the most accurate distance to events, Index of Refraction
(IoR) should be set to the fiber manufacturer’s refractive index specification for the fiber under test. If unknown, set IoR to 1.4681 as
this value falls within 99% of the IoR values for most optical fibers.
CAPTURE MODE – range of values: AUTO, SEMI, USER, FILT, LIVE.
AUTO all trace options are determined automatically, except dead zone length.
SEMI same asAUTO except the pulse width is not automatically determined.
USER all user configured options are used when capturing the trace.
FILT same as USER plus the software will filter (smooth) the trace to remove noise. This will help produce a cleaner
trace with less averaging required.
LIVE uses the user-defined trace settings to continuously update the trace on the screen. The trace will be updated
after the user-defined number of averages is completed. The cursors and zoom functions work in LIVE mode. To
start and exit LIVE mode, press the TEST function button.
NOTE: if connected to a PC running OWLView software, LIVE mode also updates the software trace area
PULSE WIDTH – range of values: Multimode: 1, 2, 5, 10, 20, 50, 100 m; Singlemode: 1, 2, 5, 10, 20, 50, 100, 200, 500, 1000 m.
Pulse width offers a trade-off between the ability to measure longer cable distances (longer pulse width) versus the ability to see two
events that are closely spaced (shorter pulse width). This is otherwise known as an OTDR’s event dead zone (i.e. the minimum
distance between two events where they both can be measured).
NUMBER OF SAMPLES – range of values: 256, 512, 1024, 2048, 4096. Increasing the number of samples allows the OTDR to
have better display resolution (events are easier to see, especially near the noise level), but also increase the trace acquisition time.
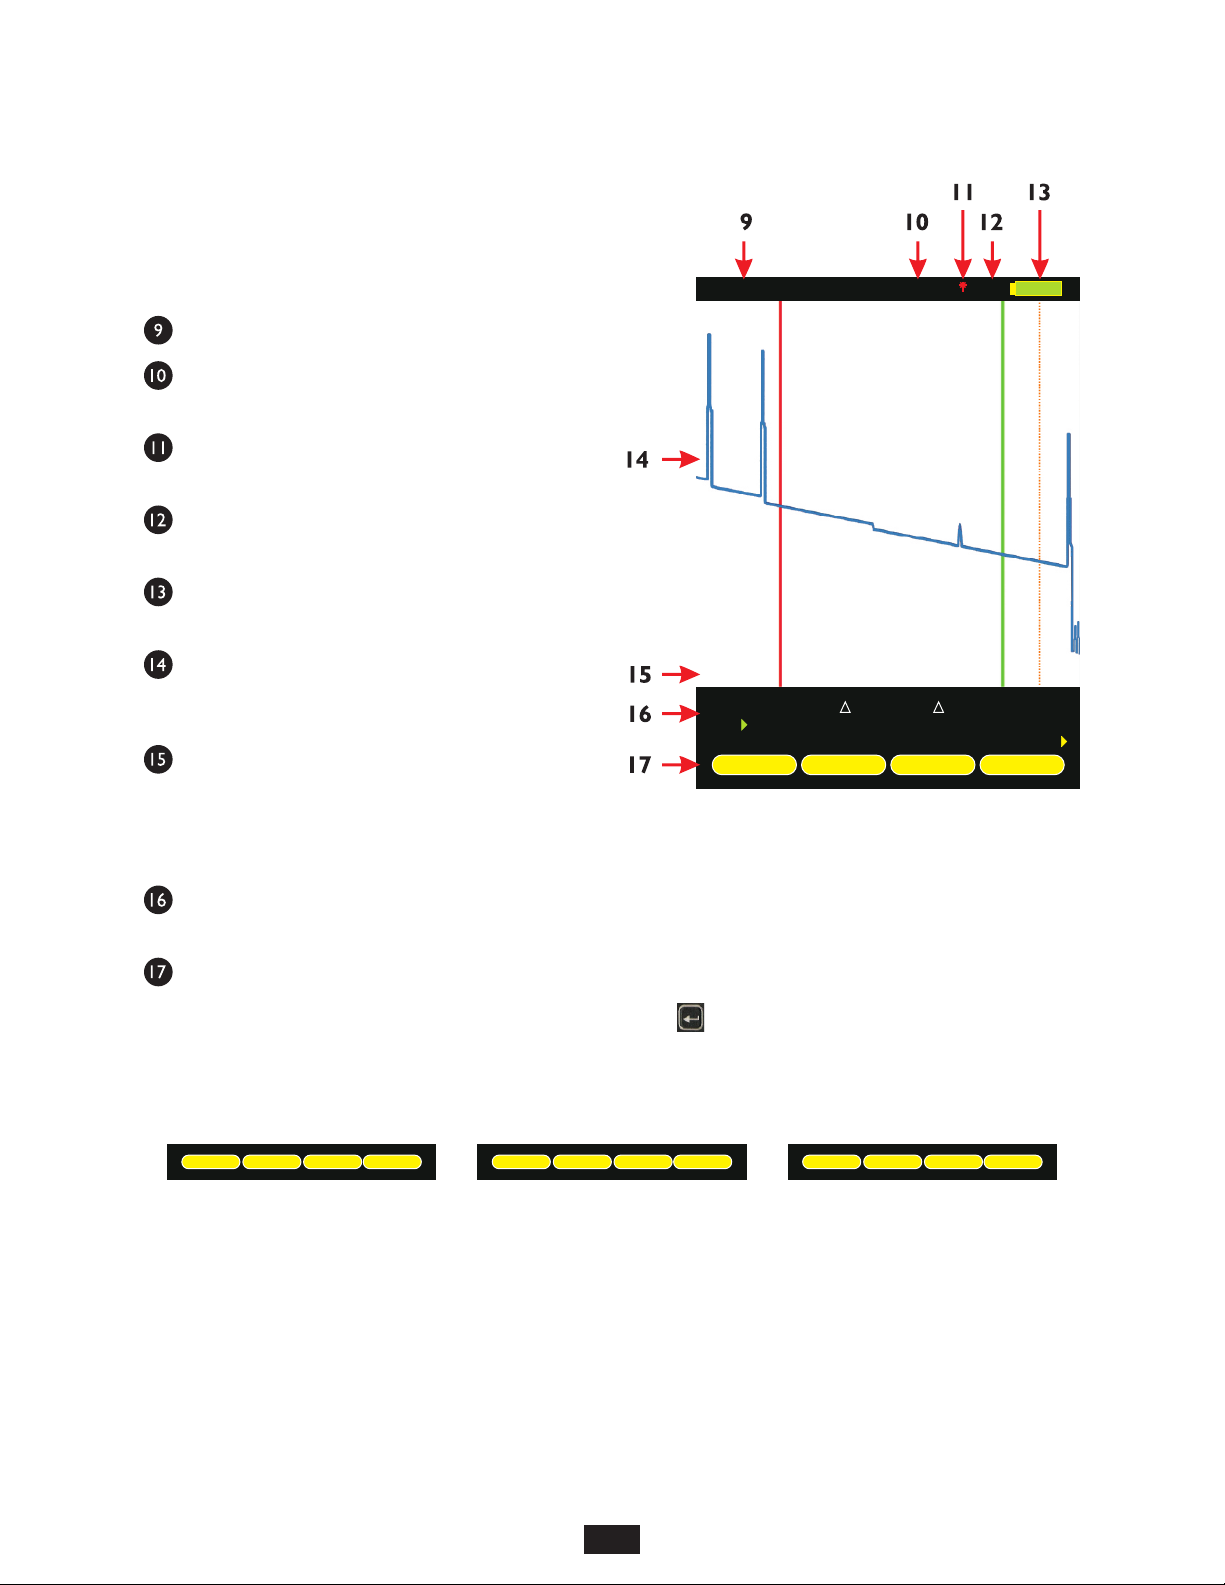
DEAD ZONE LENGTH(m) – range of values: 0 to 1500. Allows the user to enter the length of a dead-zone box (a.k.a. pulse
suppressor), if one is being used. If a value is entered for dead zone, the dead zone portion of the OTDR trace will be grayed out. The
active portion of the trace will begin where the dead zone ends.
RANGE – range of values: 1, 2, 5, 10, 25, 50, 65, 128 km. Allows the user to manually enter the total length of the trace. NOTE: for
best results, this value should be set to the next highest value from the actual length of the fiber under test.
STEP – range of values: 1, 2, 4 m. Trace sample spacing. Smaller steps produce more accurate distance to events, but trace
acquisition takes longer.
06081m
20221m
24711m
RFL dBx
-81.00x
14140
dB
0.00
0.00
L mx
Fiber #x
TESTZOOMLOCKCURSOR
ENTER
AUTO
1550nm