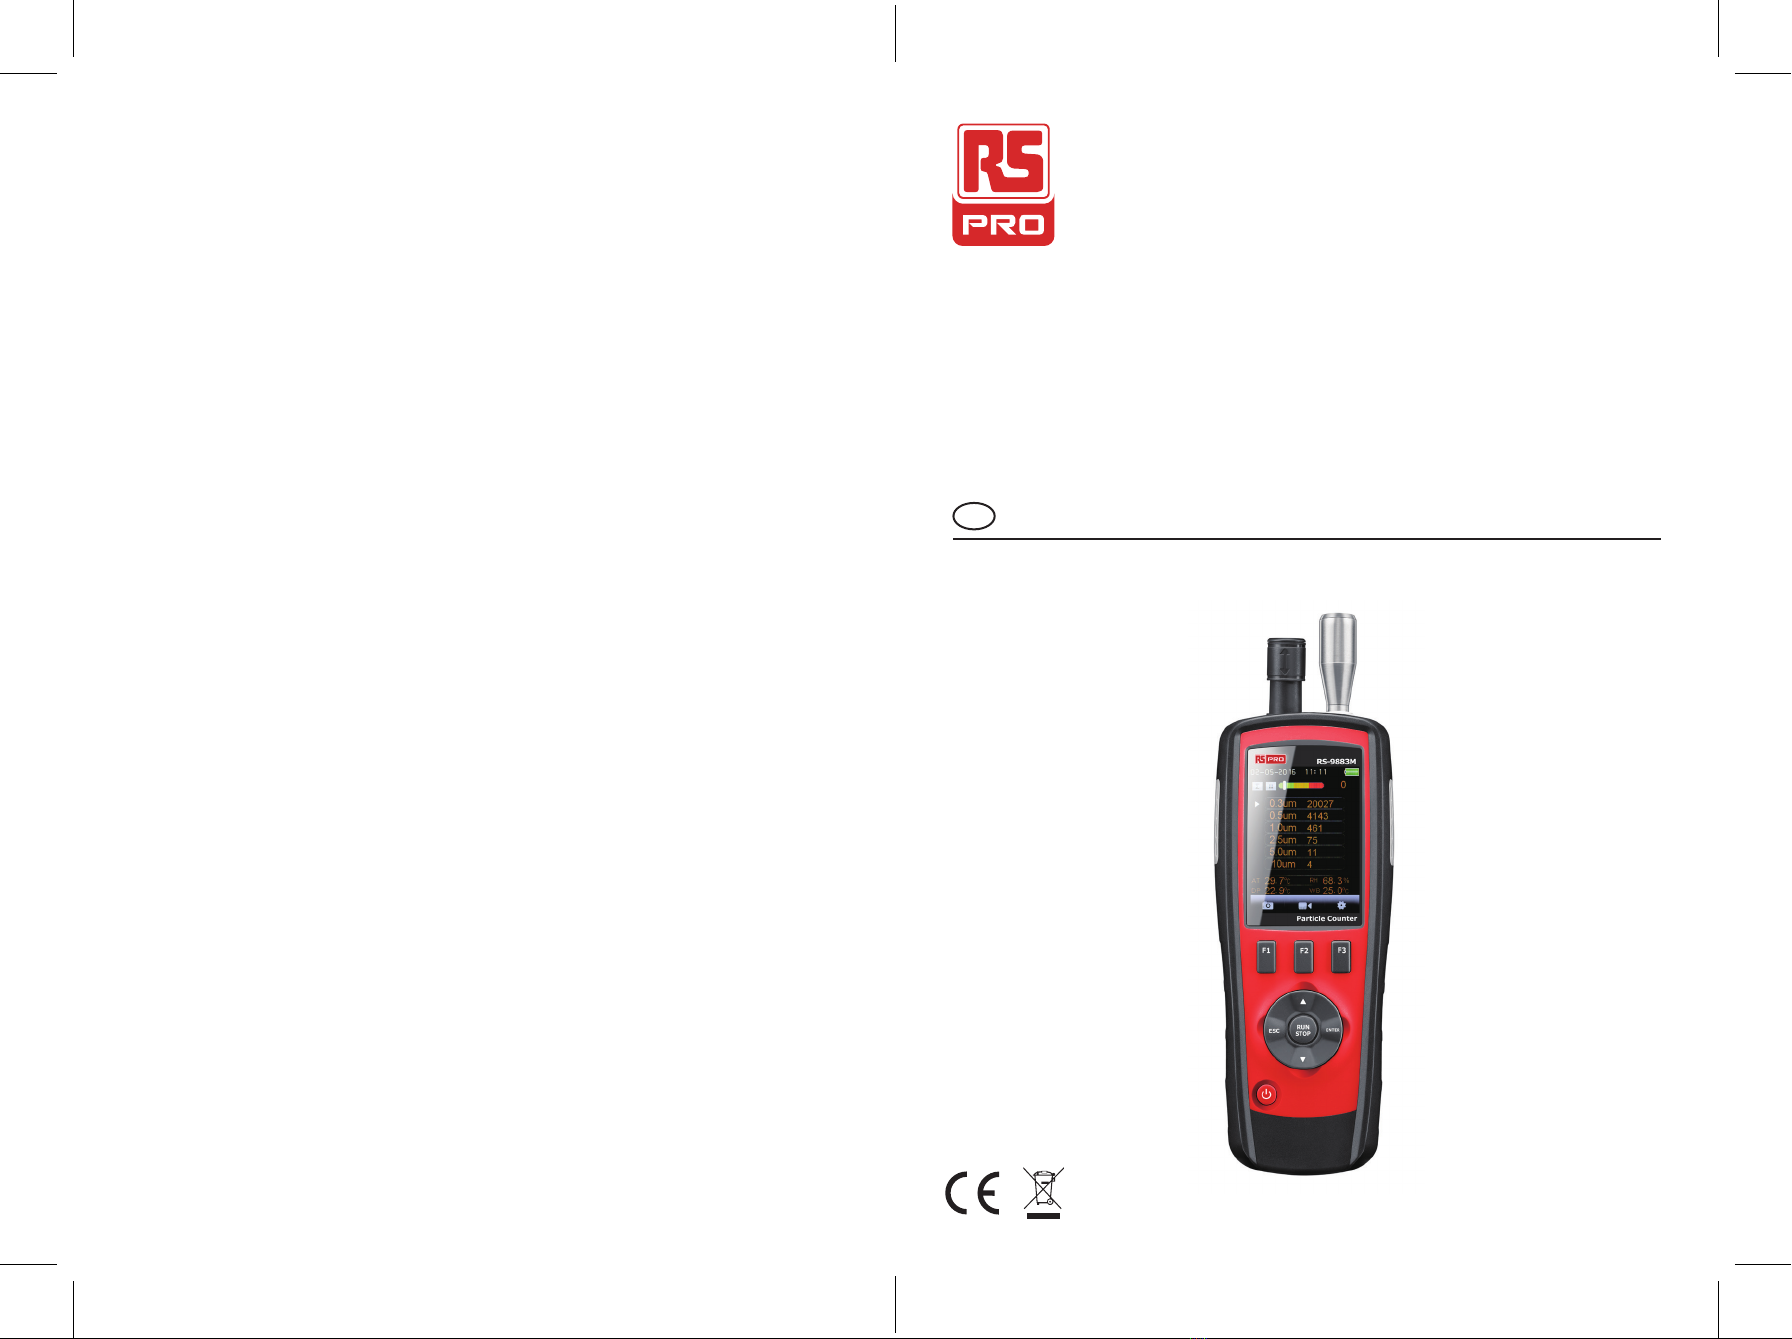
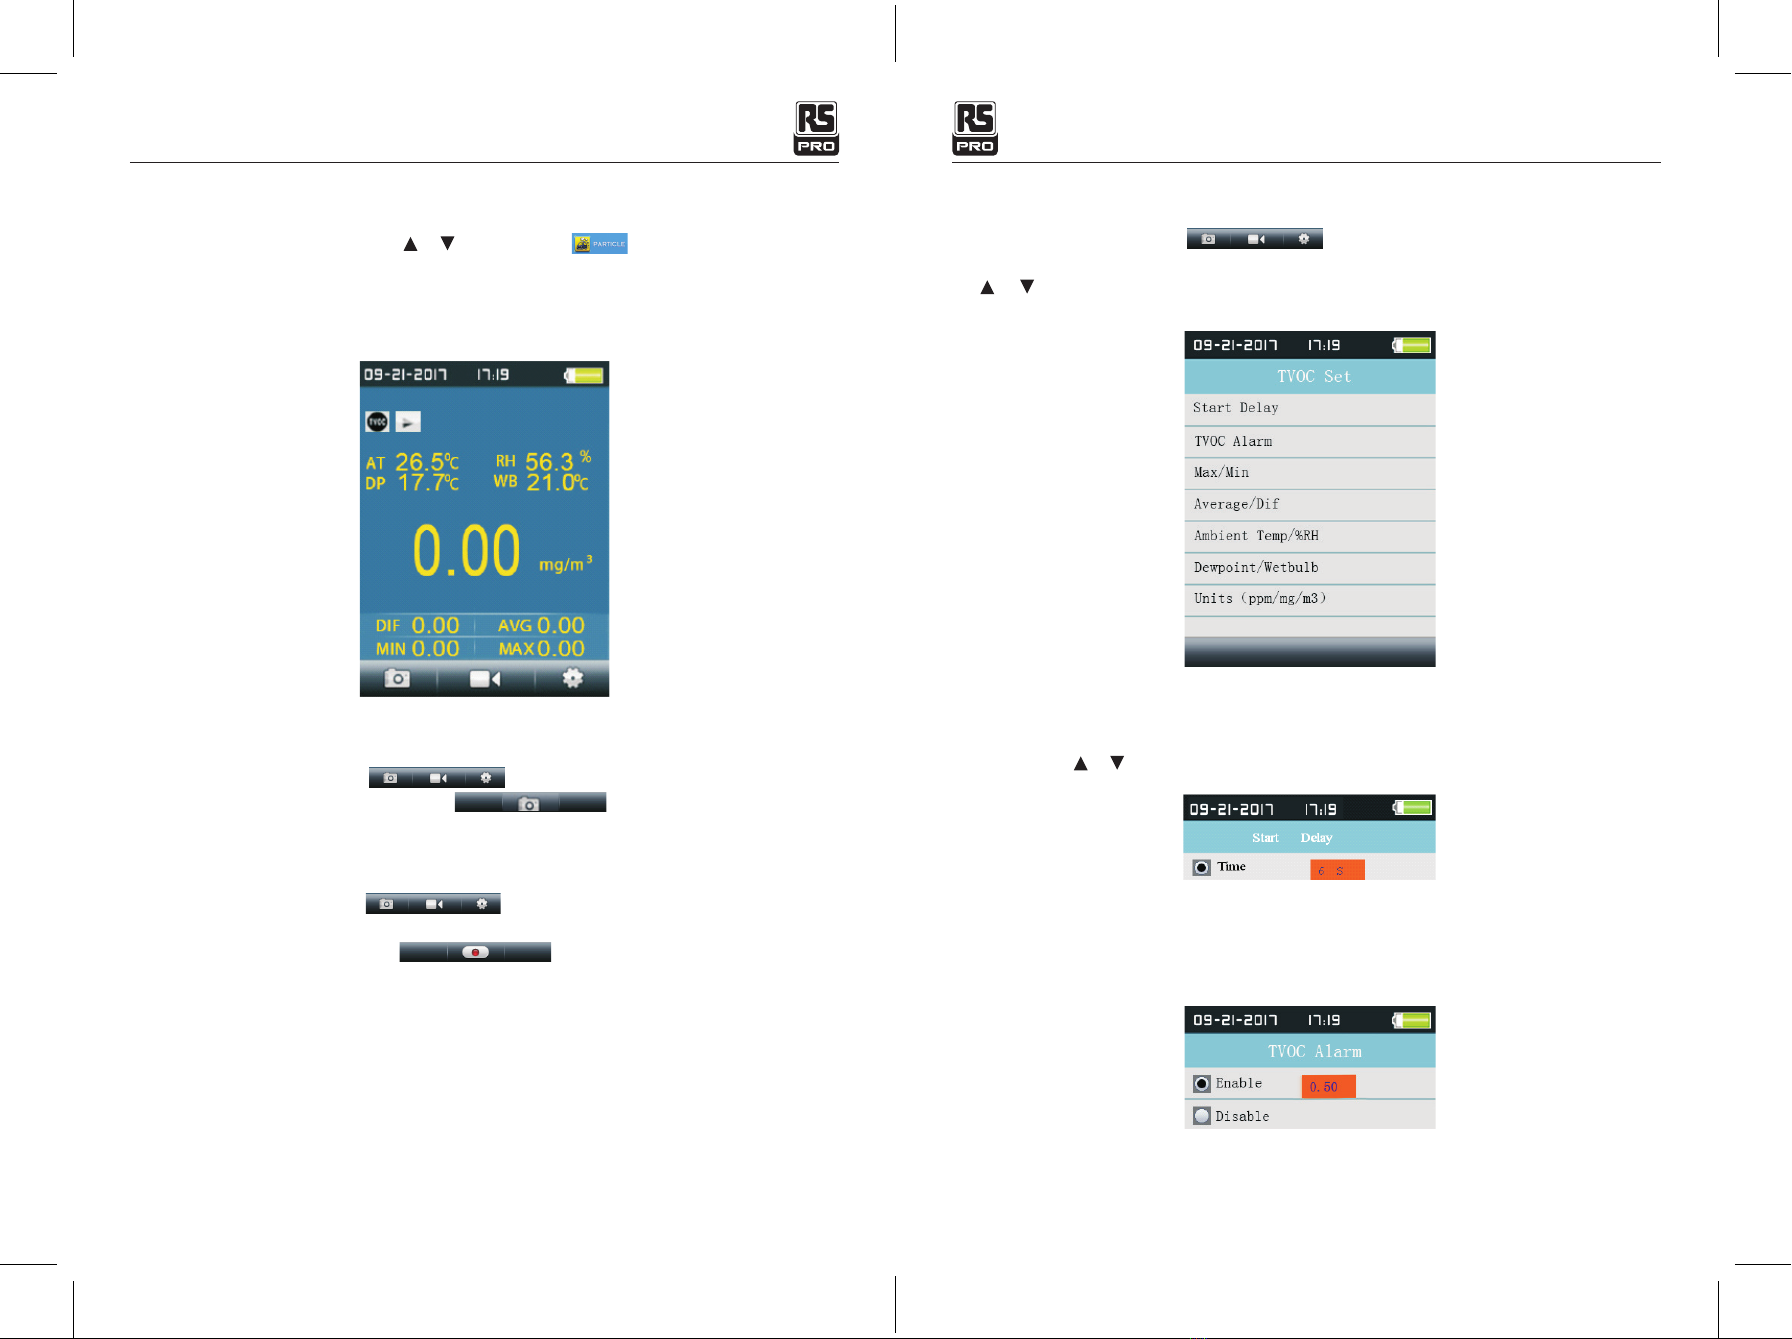
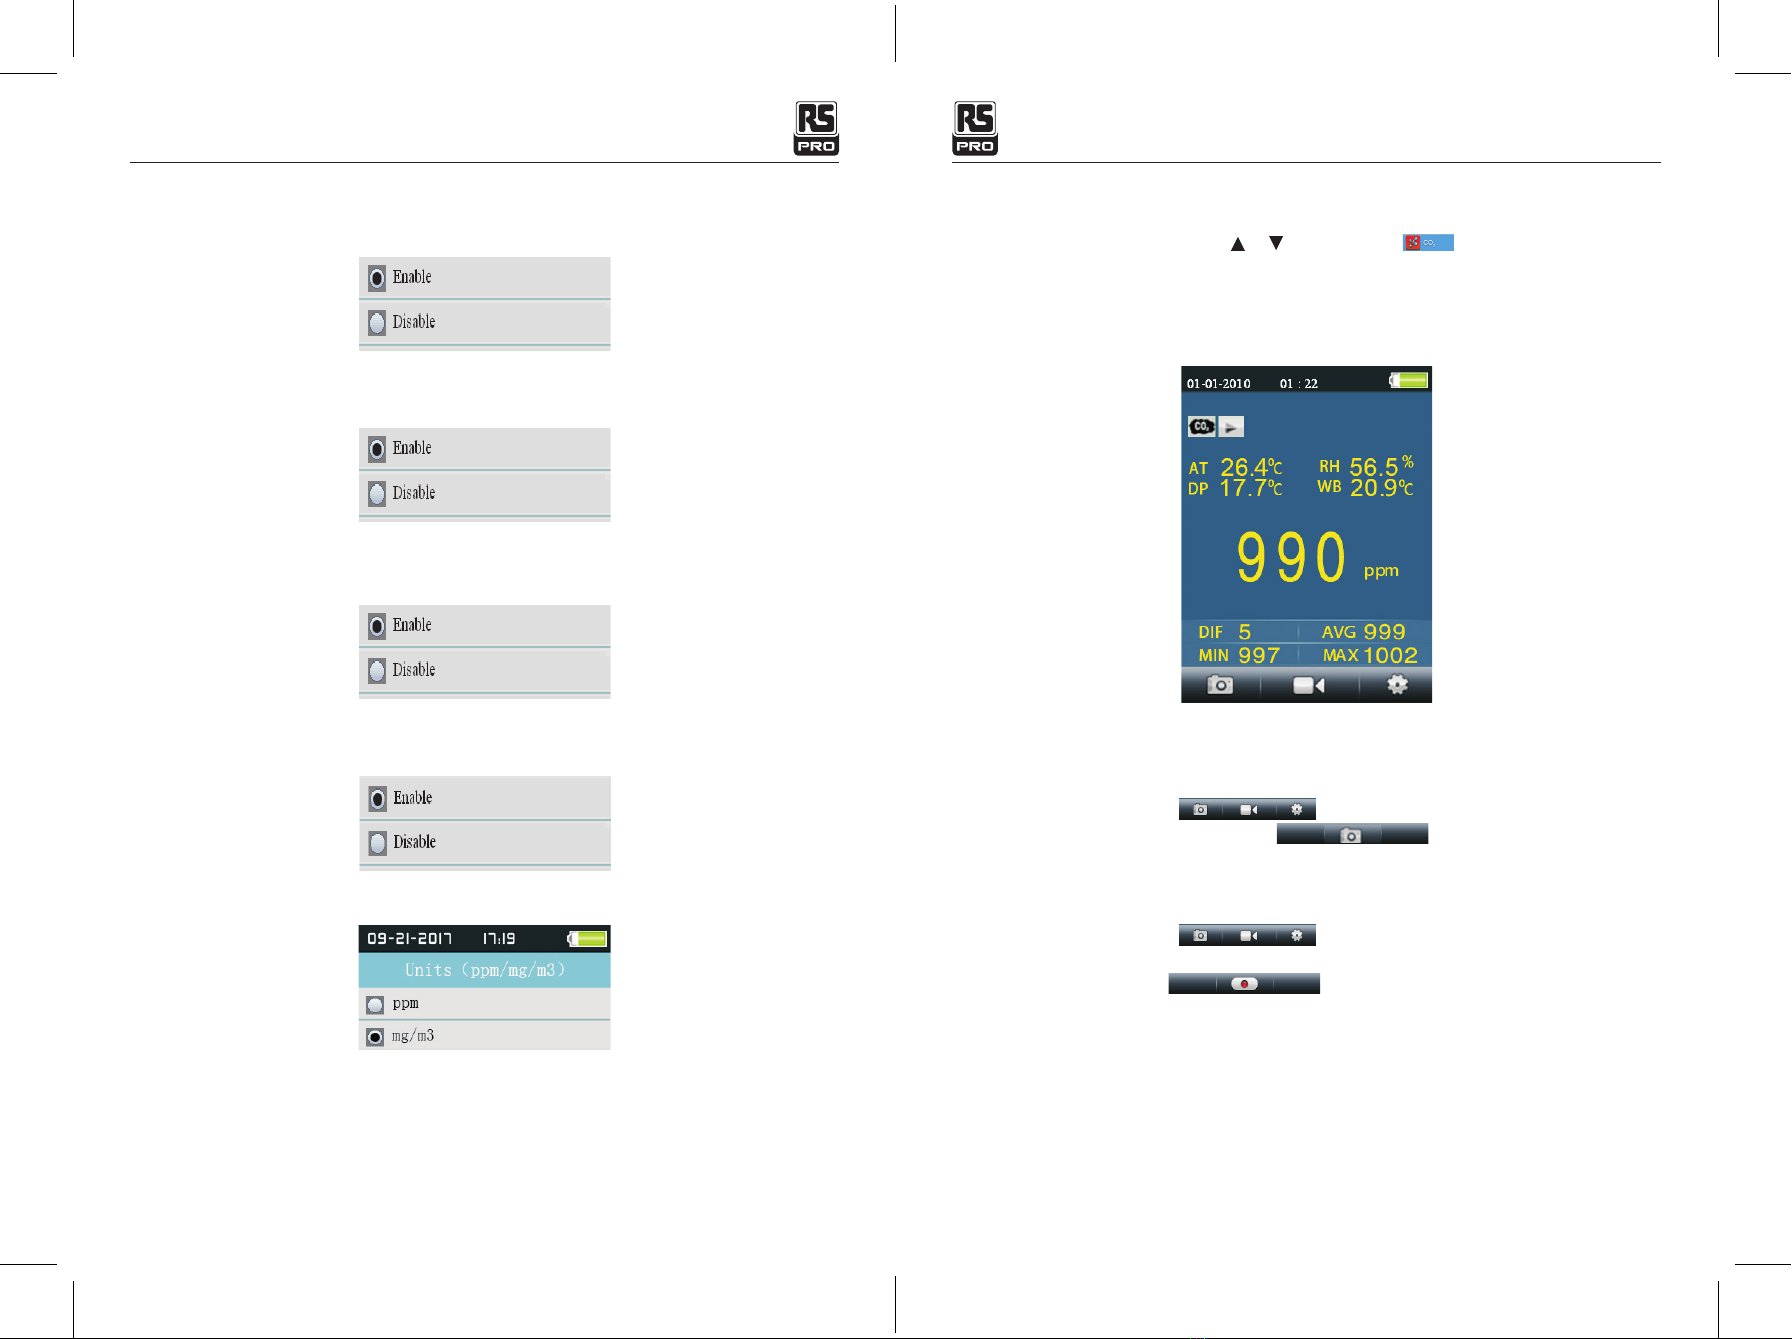
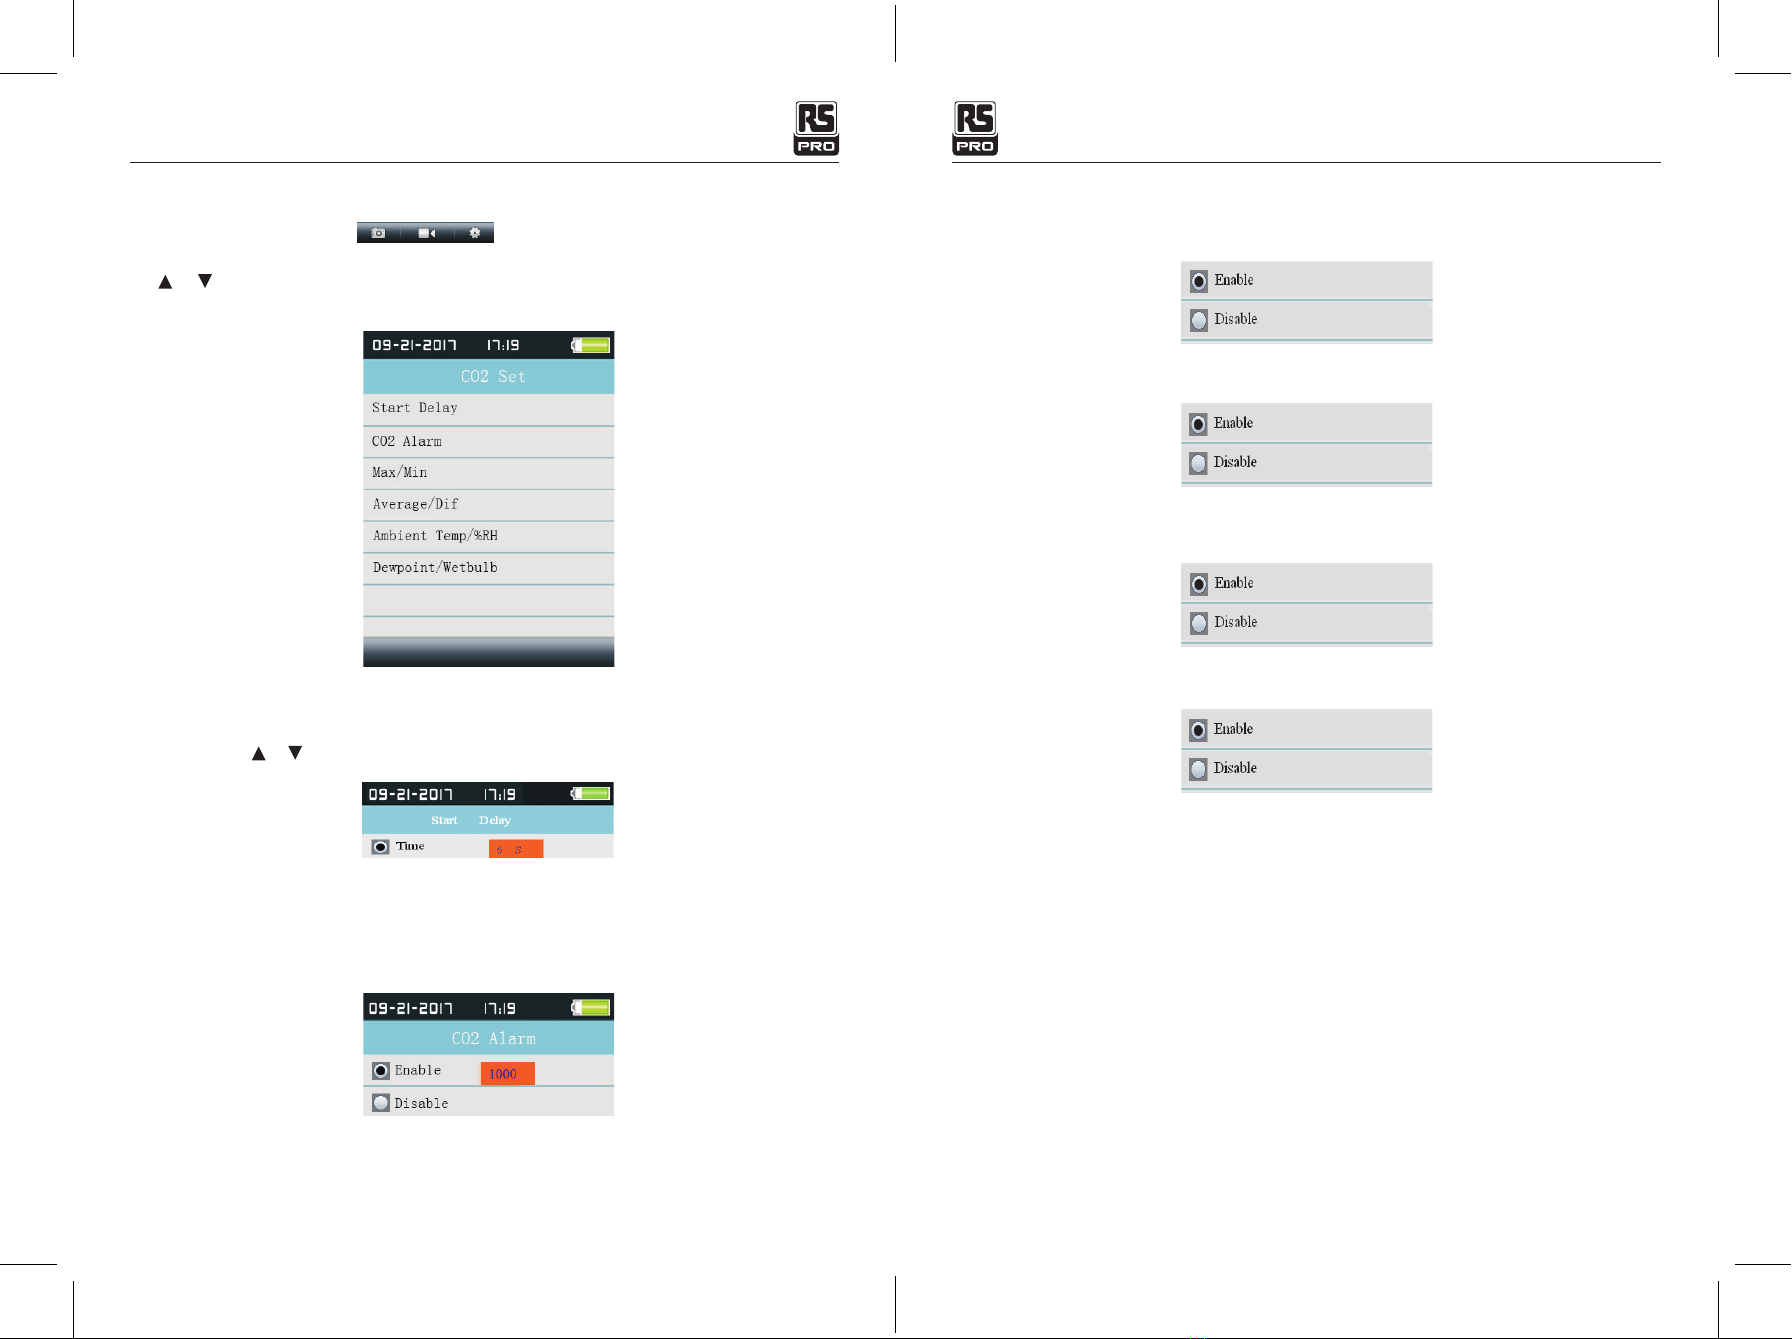
22 23
6 in 1 Particle Counter / English6 in 1 Particle Counter / English
13-1.Particle Counter instruction
• Particles that scattered in the dust in the air, dust or smoke. They mainly come from automobile
exhaust, power plant, garbage incineration furnace and so on. Relative diameter less than 2.5um
particles known as PM2.5, this particle is smaller than human cells, not be drained, but directly into the
lungs and blood, the harm to human body is larger.
• This meter with a simple key operation to achieve a particle counter measurement, real-time monitoring
the value of environmental particles concentration, six channel data measured simultaneously, and at the
same time displayed on the screen, also can be a separate display. Joined the exceed the standard grade
alarm indication, and accompanied by different buzzer, more direct master of environmental quality.
• Equipped with cameras and photographic function, can directly see measured the real situation, can
store large amounts of data ( SD), pictures and video, is used to analyze the data.
• Due to particulate matter measurements need to start the pump, will be dust inhalation, is
recommended for daily use less as far as possible, to reduce the pollution on the sensor, thereby
increasing the service life of the instrument, such as the average daily use 5 times, the instrument can
be used for 5 years.
Attention: in the foggy there will be fine mist as dust!
In Particle Mode: When set the sampling time to 21s, the air level constant(a) table is:
Channel Green Yellow Red
0.3µm 0~100000 100001~250000 250001~500000
0.5µm 0~35200 35201~87500 87501~175000
1.0µm 0~8320 8321~20800 20801~41600
2.5µm 0~545 546~1362 1363~2724
5.0µm 0~193 194~483 484~966
10µm 0~68 69~170 170~340
PM2.5(ug/m3) Status Bar Color
0~35 Good Green
35~75 Moderate Yellow
75~115 Lightly Polluted Orange
115~150 Moderately Polluted Red
150~250 Heavily Polluted Purple
>250 Severely Polluted Brown Red
Value Status
0~800 Fresh air, smooth breathing
801~1500 Normal breathing, air slightly turbid
>1500 Began to feel sleepy, feeling headache, drowsiness, dull, severe lead to
hypoxia asphyxia
(This data is for reference only and does not apply to any legal evidence)
If you set the sampling time as t, the air level constant formula is Y=a*t/21.
In Mass Concentration Mode: The corresponding data for the analog bar is PM2.5, the table is as
follows:
13-2.HCHO introduction
• This test is mainly used for indoor air quality testing, formaldehyde is who identified as carcinogenic
and teratogenic substance, the indoor formaldehyde content of not more than 0.1ppm, ppm is one in a
million.
• Formaldehyde and VOC mainly in paint, glue, and agents, may also exist in the chemicals, there may
exist in the fresh food such as anti season vegetable & fruit, vegetable & fruit in different.
• This meter is the use of advanced sensor technology, real time detection of formaldehyde in the air,
can promptly and effectively prevent formaldehyde harm to human body.
13-3.TVOC introduction
Organic gaseous volatile substances are collectively referred to as TVOC (Total Volatile
Organic Compounds), TVOC has a pungent odor, and some compounds are toxic. It
is generally believed that TVOC can cause the body’s immune disorders, affecting
the central nervous system function, dizziness, headache, drowsiness, weakness,
chest tightness and other symptoms; may also affect the digestive system, loss
of appetite, nausea, severe damage to the liver and Hematopoietic system, such
as allergic reactions. Under normal circumstances indoor VOC concentration of
0.16mg/m3~0.3mg/m3, the basic harm to human health, but often in the decoration of
this indicator, especially in the case of improper decoration, the general provisions of
the indoor TVOC Concentration should not exceed 0.5mg/ m3.
13-4.CO2 introduction
Carbon dioxide is a colorless odorless gas at room temperature, human breathing is to
rely on inhalation of oxygen, exhaled CO2,CO2concentration is too high will directly
affect the human breathing is smooth, even serious asphyxia hazards. In general, the
concentration of CO2can be classified as follows:
05/04/2018 Version No. 00105/04/2018 Version No. 001