Spicer Consulting SC28 User manual

SC28 Monitor for Magnetic Fields,
Vibrations, Acoustics, Temperature and
Humidity
Version 1.0 Beta 1 for Windows 7, 8.1, 10
User Manual
SPICER CONSULTING Electron Beams & Electronic
Systems

© Spicer Consulting, 2020 SC28 User Manual
2
Acknowledgement
The SC28 software includes programs created by Spicer Consulting using
LabVIEW from National Instruments.
Copyrights
This document copyright © 2020 Spicer Consulting. All rights reserved.
This document may not be reproduced or transmitted in any form, electronic or
mechanical, including photocopying, recording, storing in an information retrieval
system, or translating, in whole or in part, without the prior written consent of
Spicer Consulting.
LabVIEW Copyright © 2020 National Instruments Corporation. All rights
reserved.
Trademarks
LabVIEW is a trademark of National Instruments Corporation.
SPICER CONSULTING
Eden Laboratory, Broadmead Road, Stewartby, Bedfordshire, MK43 9ND, England.
Telephone: +44 1234 765773, Fax: +44 1234 765778
E-mail: enq@spicerconsulting.com
Web site: http://www.spicerconsulting.com

© Spicer Consulting, 2020 SC28 User Manual
3
Contents
About this Manual ................................................................................................... 5
Organisation of this Manual ......................................................................... 5
Conventions used in this Manual .................................................................. 6
Chapter 1 - Introduction to the SC28 System .......................................................... 7
Hardware ...................................................................................................... 7
Software ........................................................................................................ 7
Sensors .......................................................................................................... 7
Getting Started .............................................................................................. 8
Adding Sensor Calibration Files ................................................................. 10
Connecting the SC28/SI ............................................................................... 8
Connecting a 3-axis Magnetic Field Sensor ................................................. 8
Connecting Accelerometers .......................................................................... 8
Connecting a Precision Microphone ............................................................. 9
Connecting a Temperature/Humidity Sensor ................................................ 9
Connecting a Voltage Signal (or User-defined Sensor) ................................ 9
How to Run the Programs ............................................................................. 9
How to Exit SC28 ....................................................................................... 11
Getting Help ............................................................................................... 12
Chapter 2 – Environmental Disturbances .............................................................. 13
Electron Beam Instruments ......................................................................... 13
Magnetic Field Sources .............................................................................. 13
Vibration Sources ....................................................................................... 14
Acoustic Sources ........................................................................................ 14
Temperature ................................................................................................ 14
Humidity ..................................................................................................... 15
Chapter 3 – Setting up Monitoring ........................................................................ 16
Setup Steps ................................................................................................. 16
Check the Specifications............................................................................. 16
Define Position and Orientation ................................................................. 17
Set up Signals and Scales ........................................................................... 17
Set up Spectrum Analyser .......................................................................... 17
Set up Chart Recorder ................................................................................. 17
Set up Data Logging ................................................................................... 18
Chapter 4 – Signals and Scales .............................................................................. 19
Signal Display and Clipping ....................................................................... 19
Scales and Ranges ...................................................................................... 20
Chapter 5 – Spectrum Analyser Controls............................................................... 23
Frequency Range ........................................................................................ 23
Number of Points ........................................................................................ 23
Window Function ....................................................................................... 24

© Spicer Consulting, 2020 SC28 User Manual
4
Spectrum Mode .......................................................................................... 25
Combine Mode ........................................................................................... 25
Chapter 6 – Chart Recorder Controls .................................................................... 27
Chart Time Step ......................................................................................... 27
Chart Mode Controls .................................................................................. 27
Chapter 7 – Data Logging Controls ....................................................................... 30
Chapter 8 – Environmental Specifications ............................................................ 33
Specifications ............................................................................................. 33
Specification Editor .................................................................................... 34
Chapter 9 – SC28 Calibration ................................................................................ 37
Calibration Panel ........................................................................................ 37
User Defined Units ..................................................................................... 41
Chapter 10 - Menu and Toolbar Functions ............................................................ 43
Menu .......................................................................................................... 43
Calibration Tool ......................................................................................... 43
Specification Tool ...................................................................................... 43
Setup Files .................................................................................................. 43
Data Logging Tool ..................................................................................... 44
Exiting the Program ................................................................................... 44
Resizing the Window ................................................................................. 44
Help Tool ................................................................................................... 44
Reset DC Sensor Tool ................................................................................ 44
Autoscaling ................................................................................................ 45
Plot Tools ................................................................................................... 45
Appendix 1 – SC28 Specification.......................................................................... 46
Appendix 2 - File Formats ..................................................................................... 48
Export File Text Format ............................................................................. 48
Specification File Format ........................................................................... 52
Default Folders ........................................................................................... 52
Appendix 3 - Units ................................................................................................ 53
Magnetic Field Units .................................................................................. 53
Vibration Units ........................................................................................... 54
Sound Level Units ...................................................................................... 55
Appendix 4 - Window Functions ........................................................................... 56
Index ...................................................................................................................... 57

© Spicer Consulting, 2020 SC28 User Manual
5
About this Manual
This manual describes the SC28 Monitor for Magnetic Fields, Vibrations,
Acoustics, Temperature and Humidity and explains how to use it.
Organisation of this Manual
Chapter 1 - Introduction to the SC28 System, describes the system components and
applications. It explains how to get started, how to use the sensors, how to run the
programs and how to get help.
Chapter 2 – Environmental Disturbances, describes the environmental factors that
can disturb an electron beam instrument.
Chapter 3 – Setting up Monitoring, explains how to use the electron beam
instrument’s environmental specifications to guide the setting of the SC28 controls.
Chapter 4 – Signals and Scales, is a detailed reference on the SC28 signals and
scales settings.
Chapter 5 – Spectrum Analyser Controls, is a detailed reference on the SC28
spectrum analyser settings.
Chapter 6 – Chart Recorder Controls, is a detailed reference on the SC28 chart
recorder settings.
Chapter 7 – Data Logging Controls, is a detailed reference on the SC28
datalogging settings.
Chapter 8 – Environmental Specifications, explains how to load a microscope’s
environmental specifications into the SC28 for direct comparison with measured
results.
Chapter 9 – SC28 Calibration, explains how to load calibration files, reset a DC
sensor, self-check a microphone and add user-defined units.
Chapter 10 - Menu and Toolbar functions, explains how to use all the Menu and
Toolbar functions of the SC28.
Appendices 1-4 give details of SC28 specifications, file formats, units and window
functions.

© Spicer Consulting, 2020 SC28 User Manual
6
Conventions used in this Manual
The following conventions are used in this manual:
bold Bold text denotes control names, menu items, dialog box buttons or
options that appear on the screen.
italic Italic text denotes emphasis, a cross reference, or an introduction to
a key concept.
bold italic Bold italic text denotes a note, caution, or warning.
< > Angle brackets enclose the name of a key on the keyboard.
+ A plus between two or more key names enclosed in angle
brackets denotes that you hold down the first key while you press
the next key(s) - for example, <ctrl+P>.
Warning: This symbol to the left of bold italic text denotes a warning,
which alerts you to the possibility of damage to your equipment.
! Caution: This symbol to the left of bold italic text denotes a caution, which
alerts you to the possibility of data loss or a system crash.
Note: This symbol to the left of bold italic text denotes a note, which
alerts you to important information.

© Spicer Consulting, 2020 SC28 User Manual
7
Chapter 1 - Introduction to the SC28 System
Hardware
The SC28 monitor is a designed for long term monitoring of the room environment
for electron microscopes and similar equipment. It can log the spectra and charts of
ambient magnetic fields, vibrations, acoustic levels, temperature and relative
humidity. It measures the magnetic fields, vibrations and acoustic levels at 2 kHz
and temperature/humidity at 1Hz or below. Measurements are taken continuously,
with no gaps, so that no event is missed. It supports the following hardware:
Model
Number of Inputs
3-axis
Magnetic
Field
Vibration Precision
Microphone
Temperature/
Humidity
AUX
BNC
SC28/SI
1
3
1
1
1
The SC28/SI supports a wired Ethernet connection.
Software
The SC28 software runs on a Windows PC that is connected to the same Local
Area Network as the SC28/SI. It automatically detects the SC28/SI hardware
without needing to know its IP address in advance. Included with the SC28
software is the SCplot program, which views and prints results or saves graphs that
you can use in reports.
Sensors
The following sensors are available for the SC28 system:
Sensor
Description
Sensor
SC11/AC
A 3-axis AC magnetic field sensor with a lower bandwidth of
1 Hz and a dynamic range of 80 mG (8
T) Pk
-
P
k.
Sensor
SC24/DC+AC
A 3-axis DC magnetic field sensor using magneto-resisitive
technology with a lower bandwidth down to DC a dynamic
range of 40 mG (4
T) Pk
-
P
k.
Wilcoxon
731A
A Seismic Accelerometer, with bandwidth of 0.1 Hz to 500 Hz
and max
range of 200 mg’s (20
mm/s
2
) Pk
-
Pk
in this system.
B&K
4190/2669L
A Brüel and Kjær precision microphone type 4190 with
preamplifier type 2669L can measure from 20 dB to 100 dB
with a
lower
bandwidth
of
1.5 Hz.
SC28/TH
A combined Temperature
and Relative Humidity Sensor.
AUX
One input is available for a user
-
defined channel as required.

© Spicer Consulting, 2020 SC28 User Manual
8
Connecting the SC28/SI
Connect an Ethernet cable from the sensor interface to the Local Area Network
(LAN) that your PC is connected to. (If there is no LAN, you may connect the PC
and SC28/SI together directly. In this case, both devices should use a link local IP
address of the form 169.254.x.x). Connect the supplied power supply to the DC IN
input and to an AC outlet of 100-240V, 50-60Hz.
When you run the SC28 software, it automatically detects the SC28/SI hardware
and connects to it. If no SC28/SI is detected the software will wait until one is
connected to the LAN. If more than one SC28/SI is detected on the LAN, the
software asks which you wish to connect to. Once connected, the SC28/SI’s serial
number is automatically selected on the Calibration panel.
Connecting a 3-axis Magnetic Field Sensor
Mount a Sensor SC11/AC or Sensor SC24/DC+AC magnetic field sensor onto
the tripod provided and connect it to the MAG input. Select the serial number of
the sensor on the Calibration panel. The magnetic field sensors have three axes,
oriented as shown on the label. They display on the MX, MY and MZ channels in
the SC28 Monitor. DC sensors must be reset after they are moved, using the
software Reset DC button.
Note: Plug in the AC or DC sensor before you start the SC28 program,
because the software detects the sensor at start up.
Connecting Accelerometers
Each accelerometer measures 1-axis vibration, oriented along the axis of its
cylindrical case. It is supplied with a stand, allowing it to be placed on the floor in
each of the X, Y and Z directions.
On the SC28/SI there are three four-pin accelerometer connectors: VIBX, VIBY,
VIBZ. They display on the VX, VY and VZ channels in the SC28 Monitor.
Select the accelerometer(s) on the Calibration panel. You can connect or
disconnect an accelerometer at any time.
Warning: Do not drop the accelerometers. They are fragile and must be
handled gently.
Note: Allow 2 minutes for the DC operating level of an accelerometer to
stabilise after turning it on or moving it. Moving it more gently
reduces the settling time.

© Spicer Consulting, 2020 SC28 User Manual
9
Connecting a Precision Microphone
Insert a Brüel and Kjær precision microphone type 4190 with preamplifier type
2669L into one of the holders on the tripod provided and gently tighten the holding
screw. Connect the cable to the MIC input of the SC28/SI.
Select the microphone’s serial number on the Calibration panel. The signal then
displays on the A channel in the SC28 Monitor.
You can run a quick self-check on the microphone from the Calibration panel. See
the Microphone Self Check section of Chapter 9 – Calibration for details.
Warning: Do not drop the microphone. It is fragile and must be handled
gently
Connecting a Temperature/Humidity Sensor
Insert a Sensor SC28/TH Temperature/Humidity sensor into one of the holders on
the tripod provided and gently tighten the holding screw. Connect the cable to the
TEMP/RH input of the SC28/SI.
Select the sensors serial number on the Calibration panel. The signals then display
on the T and H channels in the SC28 Monitor.
Connecting a Voltage Signal (or User-defined Sensor)
Connect the signal to the BNC AUX input. This input displays on the U channel of
the SC28 Monitor.
You can connect or disconnect the BNC input at any time. See the User Defined
Units section of Chapter 9 – Calibration for how to add user-defined units.
Warning: Connecting a voltage greater than ±30V to the AUX input could
damage it.
Install the Software
The SC28 system is provided without a PC. First install the software on your
computer using the separate instructions in the release notes.
© Spicer Consulting, 2020 SC28 User Manual
10
Adding Sensor Calibration Files
At installation time, you are prompted to install the sensor calibration files. You
can add them at any other time by clicking the Cal button in the Monitor window
then using Add Sensors on the Calibration panel. For full details, see the Add
Sensors section in Chapter 9 - Calibration.
How to Run the Programs
To run the SC28 programs, select one of the following from:
Start Menu > All Programs > Spicer Consulting > SC28 1.0 >
SC28 1.0
SCplot 5.6
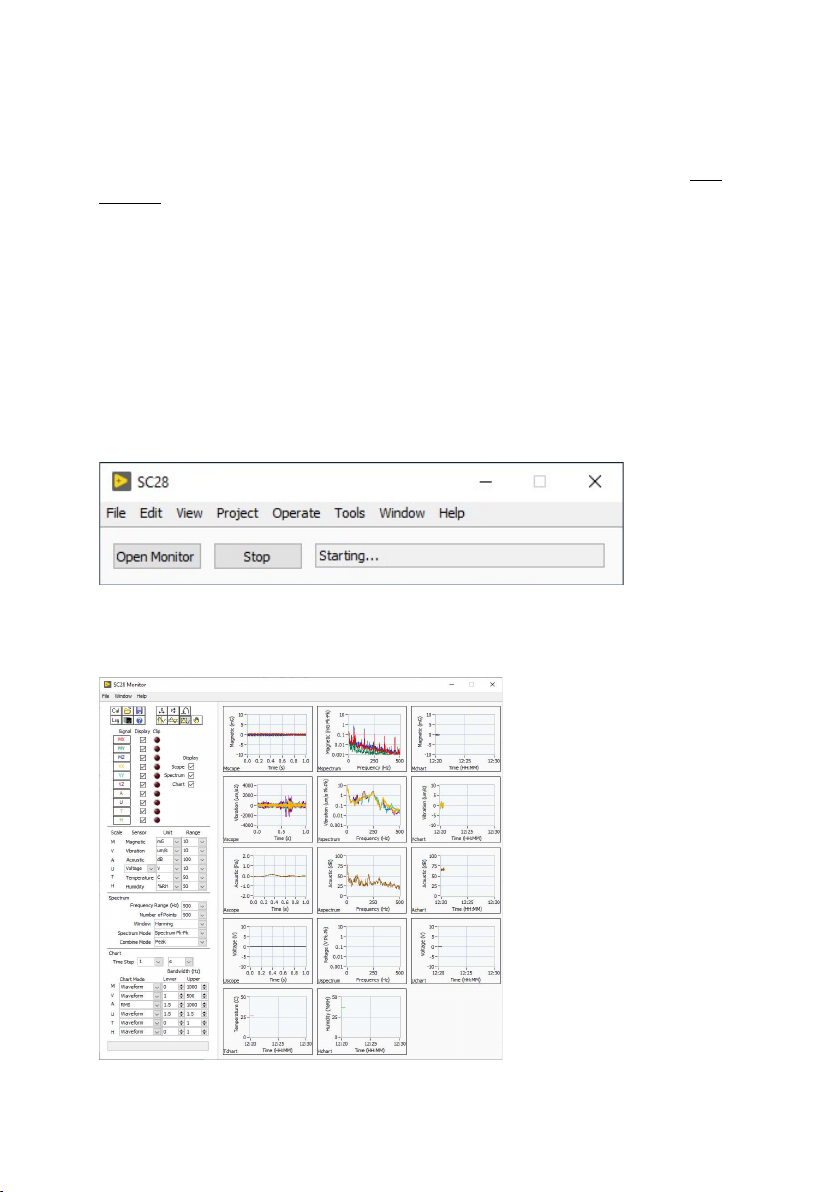
SC28 is the main monitoring program that performs measurements and logs results
to files on the PC.
Click OpenMonitor to show the Monitor window that allows you to configure the
settings and view the current measurements.

© Spicer Consulting, 2020 SC28 User Manual
11
SCplot is for viewing, formatting, printing and saving graphs of results from the
virtual instruments. For full details see the SCPlot User Manual.
Getting Started
Start the SC28. The SC28 should start up in the task bar. Click the SC28 task bar
icon to open the SC28 main window. The status should show Starting… and then
Connected to SC28/SI with its serial number, firmware version and IP address.
Click Open Monitor to show the user interface where you can change the settings
and view the current measurements. When data log files have been written, use
SCplot to view them.
How to Exit SC28
Close the SC28 Monitor window using the close button at the top right corner of
the window. You may do this any time without affecting the data capture and
logging function of the SC28 main window. If you have changed any settings, it
will ask you to save the setup. When the SC28 starts up it automatically loads the
setup file setup.sc28. Normally this is all that is needed. However, you can
save the settings to a different file name if you need to keep alternative setups.
To shut down data logging and close the whole program, click the Stop button on
the SC28 main window.

© Spicer Consulting, 2020 SC28 User Manual
12
Getting Help
Help is available in the following ways:
Help <F1>
• To get help, click the Help button or select Help for SC28 from the Help menu.
• Tip strips appear when you move the pointer over the icons and sensor controls,
providing additional information.
• To turn on the help window, click on Show Context Help from the Help menu in
any of the programs. When you move the cursor onto any control of the
instrument, the help window shows information about that control. You can drag
the help window to any location on the screen. To close the help window, click on
its close button. Alternatively, you can use <ctrl-H> to toggle the help window on
and off.
• To see brief information about the program, click on About... from the Help
menu.

© Spicer Consulting, 2020 SC28 User Manual
13
Chapter 2 – Environmental Disturbances
Electron Beam Instruments
The SC28 Monitor is purposed-designed to monitor the environment for electron
beam instruments, including Scanning Electron Microscopes (SEM), Transmission
Electron Microscopes (TEM), Electron Beam Lithography tools and SEM-based
metrology and inspection tools. These instruments are sensitive to magnetic fields,
floor vibrations, acoustic levels, temperature and humidity. Manufacturers specify
the maximum changes of these quantities that can be tolerated before movement of
the electron beam prevents the instrument from reaching its optimum performance.
The methods and units of the specifications vary between manufacturers, but the
SC28 is flexible enough to measure the parameters found in all mainstream
manufacturers’ specifications.
Magnetic Field Sources
Power Frequency (50 or 60 Hz) magnetic fields are often produced by current-
carrying power cables. Problem fields may come from well-installed cables
carrying very large currents or from moderate but unintentional currents flowing in
loops made by protective ground conductors and structural steel frames.
Equipment such as lighting and air conditioning may make a field, but there are
many examples of well-installed units that cause no problem at all. Power
distribution panels and transformers make very local fields and may therefore
cause severe difficulties if they are close, but none at all if they are distant.
Slowly varying magnetic fields are often called DC fields. They require a DC
sensor to measure them accurately. They may be produced by large ferromagnetic
objects moving in the earth’s magnetic field, including nearby doors, road traffic
and lifts/elevators.
Electric trains, trams or trolley buses may make fields at DC, 16.67, 50 or 60 Hz
depending on the power used. Much of the field comes from currents flowing in
the overhead wires, tracks or associated wiring, rather than passing vehicles
themselves. The field is usually vertical and may extend hundreds of metres away
from the track.
Some equipment associated with electron beam instruments makes local fields.
These fields are not usually a problem for the instrument, but they may cause
confusion if the sensor is placed near to them.
Power frequency magnetic fields often cause regular fine “tearing” of an SEM
image that makes small “teeth” in any vertical edges. Other things may cause the
same effect are ground loop currents in the external cables or pipes supplying the

© Spicer Consulting, 2020 SC28 User Manual
14
electron beam instrument, electrostatic hum on detectors or probes in the chamber
or other microscope faults. Power frequency fields may simply blur a TEM image.
They may cause peaks in electron energy analysers to broaden or even split into
two.
DC magnetic fields may make an SEM image look wavy or cause stitching errors
in electron beam lithography.
Vibration Sources
Vibrations may be caused by a wide variety of sources. Random vibration sources
include people walking by, lifts/elevators, road traffic, trains and ocean waves.
Regular vibrations may be caused by rotating machinery, including rotary pumps
associated with the electron beam instrument. Synchronous motors rotate at
slightly below the power frequency. Transformers may vibrate at harmonics of the
power frequency.
The severity of the vibrations depends strongly on the construction of the building
and floor. Often concrete blocks and other isolation structures are placed under
electron beam instruments to reduce vibration. Vibrations tend to be broadband,
but with peaks at resonant frequencies that are characteristic of the instrument and
its environment.
Random vibrations may cause “tearing” of an SEM image, similar to power
frequency magnetic fields, but much less regular and with varying amplitude.
Acoustic Sources
Acoustic sound levels are pressure waves in the air. They may be made by a wide
variety of sources, which are readily identified by ear. However, many audible
sounds are not a problem, but some instruments, particularly TEMs, are affected by
inaudible low-level infra-sound. Acoustic problems are often caused by air
conditioning systems, which need to be carefully designed to avoid them.
Acoustic levels may translate into vibrations of some part of the instrument, such
as the specimen stage in a TEM. As a result, the effect on the image may look
similar to that of vibration.
Temperature
Changes in room temperature can cause drift of the image as different parts of the
microscope expand or contract slightly. Air conditioning systems must be designed
to keep temperature changes below a specified limit.

© Spicer Consulting, 2020 SC28 User Manual
15
Humidity
For microscopes where the stage is cooled by liquid nitrogen, the humidity in the
room must be kept low to avoid water from the air condensing and forming frost
and ice.

© Spicer Consulting, 2020 SC28 User Manual
16
Chapter 3 – Setting up Monitoring
Setup Steps
The following steps are needed to set up the SC28 to monitor the environment of
an electron beam instrument:
1. Check the Specifications
2. Define Position and Orientation
3. Set up Signals and Scales
4. Set up Spectrum Analyser
5. Set up Chart Recorder
6. Set up Data logging
Check the Specifications
Manufacturers provide environmental specifications for their instruments. Some
are very clear and precise, but others require interpretation.
Magnetic fields are usually specified in mG or nT, but it is not always specified
whether these are RMS, 0-Pk or Pk-Pk values. It is conservative to assume it
means Pk-Pk. Sometimes a distinction is made between fields that are synchronous
or asynchronous with the power frequency because the instrument is designed to
tolerate higher levels of synchronous fields. All instruments are sensitive to DC
fields, but they are not always specified. If in doubt, assume a similar level of
sensitivity as to asynchronous fields.
Vibrations are usually specified in the frequency domain for measurement by
spectrum analyser, but in many different ways. They may use displacement,
velocity or acceleration units, RMS or Pk-Pk. They may use well-defined power
spectral density units or third octave spectra, which are independent of the number
of points setting of the spectrum analyser. However, they may be specified in
straight vibration units, in which case the number of points affects the results, but it
may not be specified. If in doubt, a rule of thumb is to assume that there is one
point per Hz.
Acoustic levels are usually specified in third octave dB bands. Common sound
level weightings are dBA for human hearing, which is less sensitive to low
frequencies, and dBC which is much flatter. Unless otherwise specified, use the
B&K microphone with dB units (un-weighted response.
Temperatures may be specified in degrees Celsius (Centigrade) or Fahrenheit.
Humidity is usually specified as percent relative humidity.

© Spicer Consulting, 2020 SC28 User Manual
17
Specifications in the frequency domain may be entered into the Specification
Editor and loaded into the spectrum for direct comparison with the measurements.
Define Position and Orientation
Fix your measurement location at convenient place near to the column of the
electron beam instrument, preferably where the sensors will not be in the way
during operation or maintenance of the instrument. Place the magnetic field sensor,
microphone and temperature/humidity sensor on the tripod roughly mid height of
the column. Measure the vibration on the floor at the same location.
The conventional orientation is X left-to-right, Y front-to-back, Z upwards relative
to the electron beam instrument. Make a plan of the room showing the position and
orientation of the measurements.
Set up Signals and Scales
In the SC28 Monitor, select the signals you want to measure according to the
microscope specifications and the sensors that you have available. Select the
Scope/Spectrum/Chart view based on the way the specification is written and the
way in which you want to analyse or present the results. Set the units and ranges to
match the units and specified levels for each quantity in the microscope
specifications. See Chapter 4 – Scales and Ranges for more details.
Set up Spectrum Analyser
The Spectrum controls set the Frequency Range, Number of points in the
spectrum, the Window function, the Spectrum Mode and the Combine Mode.
Where possible, be guided by the microscope specification. In the SC28, all the
signals share the same spectrum analyser settings, so compromises may have to be
made. The frequency range can be set to the largest required. The number of points
can be set to give the minimum required point bandwidth. See Chapter 5 -
Spectrum Analyser Controls for more details.
Set up Chart Recorder
The Chart controls set the size and Unit of the Time Step for the chart and the
Lower and Upper bandwidths for each signal.
Where possible, be guided by the microscope specification. The maximum upper
bandwidth in the SC28 is 1 kHz. Bandwidths are also limited by the sensors in
some cases. See Chapter 6 – Chart Recorder Controls for more details.

© Spicer Consulting, 2020 SC28 User Manual
18
Set up Data Logging
Data Logging <F6>
Click the Data Logging tool or select Data Logging from the File menu to open
the Data Logging control panel.
The SC28 provides two types of data logging files Chart and Spectrum. Each
have their own folder, file name and file interval settings. In addition, the SC28 can
automatically delete old log files to save disc space. See Chapter 7 - Data Logging
Controls for more details.
© Spicer Consulting, 2020 SC28 User Manual
19
Chapter 4 – Signals and Scales
The SC28 provides 10 channels of data acquisition. In the SC28 Monitor, these
signals may be displayed on 6 scales and in 3 display formats (Scope, Spectrum
and Chart). Up to 14 different graphs may be displayed giving simultaneous
display of the data as it is acquired.
Scale Signal
Display
Scope
Spectrum
Chart
M
MX
Magnetic X axis
Mscope Mspectrum Mchart
MY
Magnetic Y axis
MZ
Magnetic Z axis
V
VX
Vibration X axis
Vscope Vspectrum Vchart
VY
Vibration Y axis
VZ
Vibration Z axis
A
A
Acoustic
Ascope
Aspectrum
Achart
U
U
User defined
Uscope
Uspectrum
Uchart
T
T
Temperature
-
-
Tchart
H
H
Humidity
-
-
Hchart
Magnetic field signals MX, MY and MZ are displayed together on the M scale.
Vibration signals VX, VY and VZ are displayed together on the V scale.
Temperature T and humidity H appear only on charts because they change too
slowly to display on the Scope and Spectrum graphs.
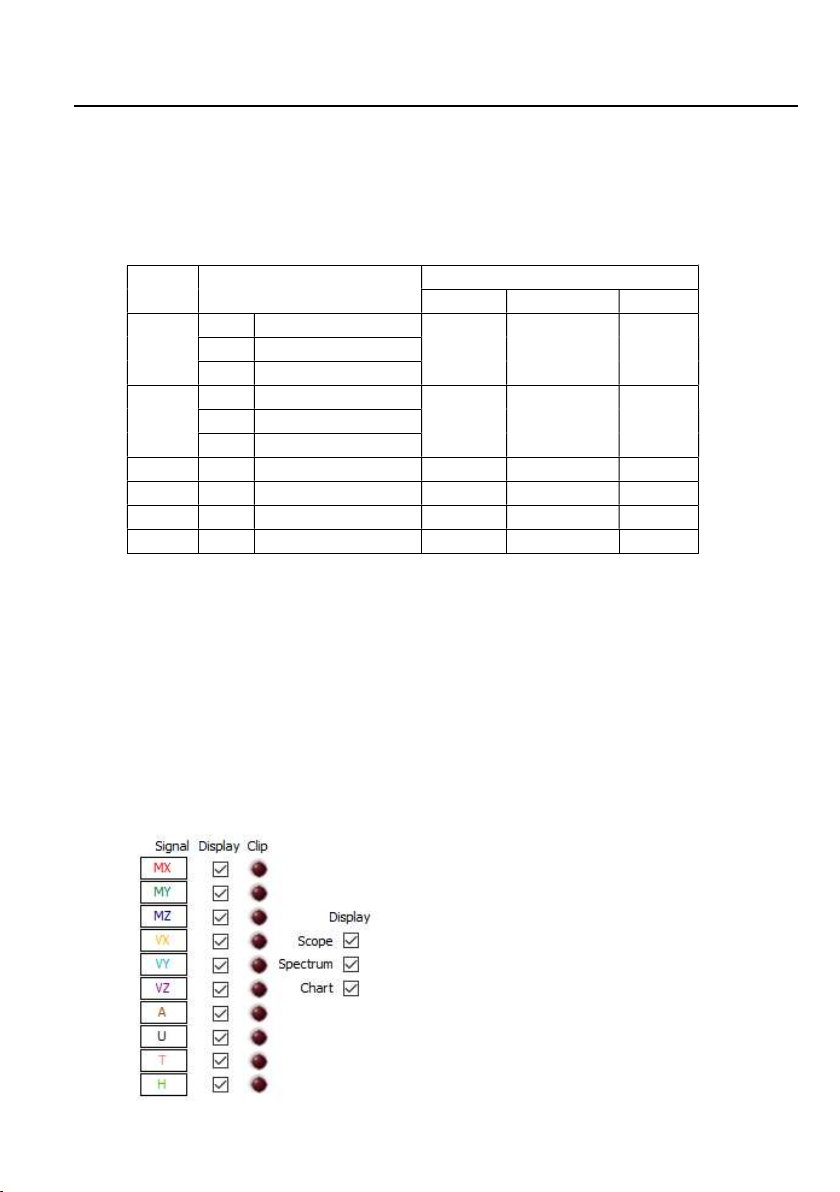
Signal Display and Clipping
The Display tick boxes affect which signals and graphs are on display. The Signal
Display tick boxes also control which signals are data logged. The Scope,
Spectrum and Chart Display tick boxes do not affect data logging.

© Spicer Consulting, 2020 SC28 User Manual
20
The Spectrum and Chart graphs are controlled by the Spectrum and Chart
controls. The Scope graphs do not have their own controls – they are controlled by
the Spectrum settings. The graph area re-formats depending on the settings of the
Display tick boxes.
The Clip indicators show when the incoming signals exceed the analog to digital
converter range. If this happens on any channel selected for Display, the program
turns on the Clip light for that channel. This warns you that data for that channel
will show waveform limiting, harmonic distortion and inaccurate RMS and Pk-Pk
levels.
The following can cause clipping to occur:
• Moving any magnetic field sensor in the Earth's magnetic field
• Placing an SC11/AC sensor in an AC magnetic field greater than 80 mG pk-pk.
• Placing a SC24/DC+AC sensor in an AC field greater than 40 mG pk-pk or
where the DC level fluctuates more than ±20 mG after reset.
• Connecting a voltage greater than 10V to the AUX input.
• Moving an accelerometer or turning it over. Wait 2 minutes for it to recover.
• Placing an accelerometer where it vibrates at greater than 200 mg's peak to peak.
• Using a precision microphone at sound levels more than 103 dB.
• It is not likely to find temperature or humidity out of range of the sensor.
Scales and Ranges
The SC28 provides unit and range settings for each scale. The User scale has a
selectable sensor, depending on the user defined units available.
Table of contents
Other Spicer Consulting Laboratory Equipment manuals

Popular Laboratory Equipment manuals by other brands

Struers
Struers LaboForce-Mi instruction manual

SYSMEX
SYSMEX ogt Cytocell Multiprobe OctoChrome Instructions for use

Apeks
Apeks i.2000 Operation manual

Endress+Hauser
Endress+Hauser Analytik Jena PlasmaQuant MS Series Service manual

Newport
Newport Oriel LCS-100 user manual

Rainin
Rainin Pipetman P-200-M8 manual


