manuals.online logo
Brands
  1. Home
  2. •
  3. Brands
  4. •
  5. Tektronix
  6. •
  7. Test Equipment
  8. •
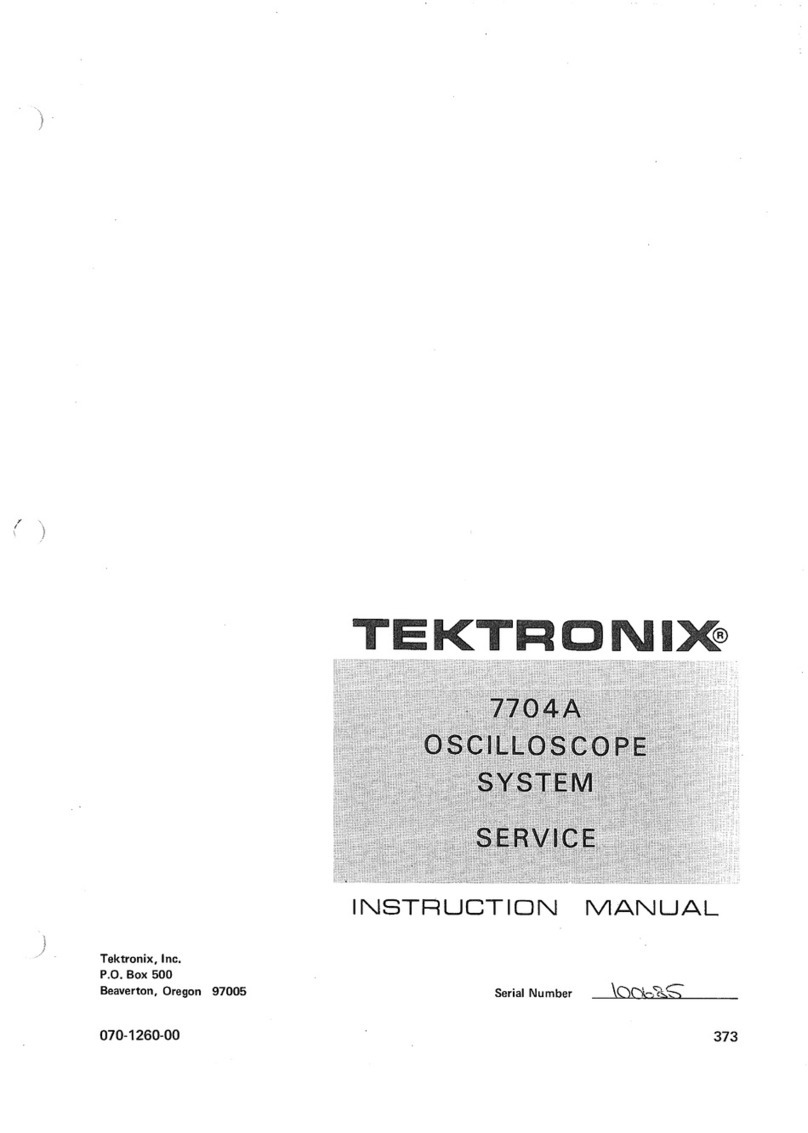
  9. Tektronix 5103N User manual

Tektronix 5103N User manual

INSTRUCTION
MANUAL
S103N
OSCILLOSCOPE
SYSTEM
pLO^j/sl SBCTIDI4
Tektronix ,Inc. •P. O. Box 500 •Beaverton, Oregon 97005 •Phone 644-0161 •Cables: Tektronix
070-1143-00 471
m. :.Vi
p
+* ftl** .
bi""-*'" »
i
'
»«'»-fete* g*ii
!
|t»i t
fU'lUd ith all requests for parts or
pacifications and price change privileges reserved.
Copyright ©1971 by Tektronix, Inc., Beaverton,
Oregon. Printed in the United States of America. All
rights reserved. Contents of this publication may not
be reproduced in any form without permission of the
copyright owner.
«St 4.3
‘ivXP-
U.S.A. and foreign Tektronix products covered
by U.S. and foreign patents and/or patents pending.
5103N
TABLE OF CONTENTS
SECTION 1SPECIFICATION
Introduction
Instrument Options
Table 1-1 Electrical Characteristics
Table 1-2 Environmental Characteristics
Table 1-3 Mainframe Physical Data
Page
1-1
1-1
1-1
1-2
1-3
SECTION 2OPERATING INSTRUCTIONS
General 2-1
Preliminary Information 2-1
Rackmounting 2-1
Operating Voltage 2-1
Operating Temperature 2-2
Plug-In Units 2-2
Installation 2-3
Selection 2-3
General Operating Information 2-3
Display Switching Logic 2-3
Vertical Display Mode 2-4
X-Y Operation 2-4
Raster Display 2-4
Basic Oscilloscope Applications 2-4
General 2-4
Peak-to-Peak Voltage Measurements—AC 2-5
Instantaneous Voltage Measurements—DC 2-5
Comparison Measurements 2-6
Time Period Measurement 2-7
Determining Frequency 2-8
Risetime Measurements 2-9
Multi-Trace Phase Difference Measurement 2-10
X-Y Phase Measurements 2-11
SECTION 3CIRCUIT DESCRIPTION
Page
Replacement Parts 4-5
Standard Parts 4-5
Special Parts 4-5
Ordering Parts 4-5
Component Replacement 4-5
General 4-5
Circuit Board Replacement 4-5
Transistor and Integrated Circuit
Replacement 4-6
Interconnecting Pin Replacement 4-6
Switch Replacement 4-6
Cathode-Ray Tube Replacement 4-7
Neon Bulb Replacement 4-8
Power Transformer Replacement 4-8
Fuse Replacement 4-8
Recalibration After Repair 4-8
SECTION 5CALIBRATION
Introduction 5-1
Services Available 5-1
Equipment Required 5-1
Preliminary Procedure 5-1
Procedure 5-2
SECTION 6RACKMOUNTING
Introduction 6-1
Instrument Conversion 6-1
Mounting Method 6-1
Rack Dimensions 6-1
Installing the Slide-Out Tracks 6-1
R5100 Installation and Adjustment 6-4
Maintenance 6-4
Block Diagram Description 3-1
Interface 3-1
Clock Generator 3-1
Countdown Circuit 3-1
Auxiliary Boards 3-2
Vertical Amplifier 3-2
Horizontal Amplifier 3-2
Power Supply 3-2
Power Input 3-2
Low-Voltage Rectifiers and Unregulated
Outputs 3-2
Line Trigger 3-3
CRT Heater Windings 3-3
Calibrator 3-3
SECTION 7ELECTRICAL PARTS LIST
Abbreviations and Symbols
Parts Ordering Information
Index of Electrical Parts List
Electrical Parts List
SECTION 8DIAGRAMS and CIRCUIT BOARD
ILLUSTRATIONS
Symbols and Reference Designators
Schematic Diagrams and Component Board
Locations
SECTION 9MECHANICAL PARTS LIST
SECTION 4SYSTEM MAINTENANCE
5100 Panel Removal 4-1
Preventive Maintenance 4-1
General 3-1
Cleaning 4-1
Calibration 4-1
Troubleshooting 4-1
General 4-1
Troubleshooting Aids 4-1
Troubleshooting Equipment 4-3
Troubleshooting Techniques 4-3
Mechanical Parts List
Mechanical Parts List Illustration
Accessories
Repackaging
CHANGE INFORMATION
Abbreviations and symbols used in this manual are based on or
taken directly from IEEE Standard 260 "Standard Symbols for
Units", MIL-STD-12B and other standards of the electronics
industry. Change information, if any, is located at the rear of this
manual.
SECTION 1
SPECIF1CATION
5103N
Change information, if any, affecting this section will be found at the rear of the manual.
Introduction ,NOTE
The 5103N Power Supply/Amplifier module is an inter-
connection unit for the display module and plug-in units. It
is operated with adisplay module, and comprises one-half
of the 5100-series oscilloscope mainframe. It accepts up to
three plug-in units and provides pre-amplification for the
deflection signals. The center and left plug-in compartments
are connected to the vertical deflection system, and the
right plug-in compartment is connected to the horizontal
deflection system. Electronic switching between the left
and center plug-ins allow amulti-trace vertical display
(chopped and alternate time-sharing modes). The unit also
contains regulated DC-voltage supplies to provide power to
the instrument system.
The following electrical characteristics apply over an
ambient temperature range of 0°C to +50°C.
Many of the measurement capabilities of the 5100-
Series Oscilloscope are determined by the choice of
display modules and plug-in units. The following
electrical characteristics apply to the Power Supply/
Amplifier unit only, unless noted otherwise. For
display modules or plug-ins only, see the specification
section of the manual for that unit.
INSTRUMENT OPTIONS
Option 1
An export transformer is available for the 5100-series
oscilloscopes, and can be installed as part of the instrument
when ordered, or it can be installed at alater time. This
transformer permits operation from 100-volt, 110-volt,
120-volt, 200-volt, 220-volt, and 240-volt sources with
power-line frequencies of from 50 to 60 hertz and 400
hertz. For further information on option 1, see your Tek-
tronix, Inc., catalog, or contact your local Tektronix Field
Office or representative.
TABLE 1-1
ELECTRICAL CHARACTERISTICS
Characteristic Performance Requirement Supplemental Information
Vertical and Horizontal Amplifiers
Input Signal Amplitude
(Differential Input)
50 millivolts per displayed division, ver-
tical and horizontal.
Horizontal Centering 0.5 division or less.
Bandwidth DC to at least 2.5 megahertz.
X-Y Phase Difference (Checked
with two plug-ins of the
same type)
1° or less to 100 kilohertz.
Sensitivity Change Accuracy degrades by up to 1% when
operated in split-screen storage.
1-1
Specification—5103N
TABLE 1-1 (cont)
Characteristic Performance Requirement Supplemental Information
Channel Switching
Chop Clock Frequency About 200 kilohertz.
Channel Chop Rate About 100 kilohertz.
Plug-In Chop Rate About 50 kilohertz.
Alternate Frequency Sweep rate (once each sweep).
Plug-In Alternate Rate
•
One-half sweep rate (once every two
sweeps).
Channel Alternate Rate One-fourth sweep rate (once every four
sweeps).
TABLE 1-2
ENVIRONMENTAL CHARACTERISTICS
Characteristic Performance
Temperature
Operating Range 0°C to +50° C.
Non-operating Range -40° Cto +70°C.
Altitude
Operating Range To 15,000 feet.
Non-operating Range To 50,000 feet.
Vibration Range To0.01 5inch peak-to-peak displacement at 50 cycles per second.
Shock Range To 30 g's, 1/2 sine, 11milliseconds duration.
Specification —5103N
TABLE 1-3
MAINFRAME PHYSICAL DATA
(5103N with aDisplay Unit)
Characteristic 5100-Series Oscilloscope R51 00-Series Oscilloscope
Dimensions (maximum)
Height (overall) 11.6 in. (29.5 cm) 5.2 in. (13.2 cm)
(cabinet) 10.5 in. (26.7 cm)
Length (overall) 19.9 in. (50.5 cm) 20.0 in. (51.0 cm)
(cabinet) 18.3 in. (46.5 cm) 18.3 in. (46.5 cm)
Width (overall) 8.4 in. (21.4 cm) 19.0 in. (48.3 cm)
(cabinet) 16.8 in. (42.7 cm)
Net Weight «22.8 lbs. (10.3 kg) ^23.5 lbs. (10.7 kg)
Shipping Weight «30.0 lbs. (13.6 kg) «39.0 lbs. (17.7 kg)
Export Weight ^45.0 lbs. (20.4 kg) ^59.0 lbs. (26.8 kg)
1-3
NOTES
5103N
SECTION 2
OPERATING INSTRUCTIONS
Change information, if any, affecting this section will be found at the rear of this manual.
General
To effectively use the 5103N, the operation and capa-
bilities of the instrument must be known. The 5103N
Power Supply/Amplifier module forms the basis of an oscil-
loscope system, and requires adisplay module and plug-ins
to complete the system. This section describes inter-
connection and general operation of the units, including
preliminary information for first-time turn-on, selection
and installation of plug-ins, general operating information,
and some basic oscilloscope applications.
Detailed operating information for aspecific display
module or plug-in is given in the instruction manual for that
unit.
PRELIMINARY INFORMATION
Rackmounting
The 5103N Power Supply/Amplifier module and the dis-
play module can be fastened together stacked or side by
side, permitting operation as abench oscilloscope, or it can
be operated in astandard 19-inch rack. Complete instruc-
tions for rackmounting are given in Section 6, Rack-
mounting.
NOTE
Before attempting to operate the instrument, make
sure the module wiring interconnections are correct,
and if display modules have been changed, that the
correct auxiliary board is installed in the socket on
the plug-in interface board.
Operating Voltage
This instrument is designed for operation from a
power source with its neutral at or near earth
(ground) potential with aseparate safety-earth con-
ductor. It is not intended for operation from two
phases of amulti-phase system, or across the legs of a
single-phase, three-wire system.
The 5100-Series Oscilloscope is operated from a115-volt
nominal line voltage source (NOTE: for instrumentshaving
optional export transformer, see information following
Table 2-1 ). The power transformer is wired to permit either
of two regulating ranges to be selected. The range for which
the primary taps are set is marked on the rear panel of the
instrument. Use the following procedure to change regu-
lating ranges:
1.Disconnect the instrument from the power source.
2. Remove the bottom dust cover of the instrument to
gain access to the Power Supply circuit board
.
3. Remove the brown line-selector block from the
square-pin connectors (see Fig. 2-1) and place it on the
desired set of pins (use pins marked Hor Monly). Select a
range which is centered about the average line voltage to
which the instrument is to be connected (see Table 2-1 ).
4. Change the nominal line voltage information on the
rear panel of the instrument. Use anon-abrasive eraser to
remove previous data, and mark in new data with apencil.
5. Replace the bottom dust cover and apply power to
the instrument.
TABLE 2-1
Regulating Ranges
Line Selector
Block Position Regulating Ranges
LDo not use Internally disconnected
M(110 VNominal) 99 VAC to 121 VAC
H(120 VNominal) 108 VAC to 132 VAC
Optional Export Transformer. An optional export trans-
former permits the 5100-Series Oscilloscope to be operated
from either a115-volt or a230-volt nominal line voltage
source. This transformer is wired to permit one of three
regulating ranges to be selected for either 115-volt or
230-volt nominal operation. The range for which the
2-1
Operating Instructions—5103N
Fig. 2-1. Location of the line-selector block on the Power Supply
circuit board.
primary taps are set is marked on the rear panel of the
instrument. Use the following procedure to obtain correct
instrument operation from the line voltage available:
5. Change the nominal line voltage information on the
rear panel of the instrument. Use anon-abrasive eraser to
remove the previous data, and mark in new data with a
pencil.
6. Replace the bottom dust cover and apply power to
the instrument.
Damage to the instrument may result from incorrect
placement of the line-selector block.
TABLE 2-2
Regulating Ranges For Export Transformer
Line
Selector
Block
Position
Regulatir
115-Volts Nominal
lg Range
230-Volts Nominal
L90 VAC to 110 VAC 180 VAC to 220 VAC
M99 VAC to 121 VAC 198 VAC to 242 VAC

H108 VAC to 132 VAC 216 VAC to 264 VAC
Line Fuse
Data 1.6 Aslow -blow 1Aslow-blow
1.Disconnect the instrument from the power source.
2. Remove the bottom dust cover of the instrument to
gain access to the Power Supply circuit board.
3. To convert from 115 volts to 230 volts nominal line
voltage, or vice versa, remove the line-selector block from
the square-pin connectors (see Fig. 2-1) and replace it with
the other block. Remove the line fuse from the fuse holder
located on the rear panel of the display module and replace
it with one having the correct rating. The unused line-
selector block and line fuse can be stored on the Power
Supply circuit board. Change the line-cord power plug to
match the power-source receptacle or use an adapter.
NOTE
The 115-volt block is color coded brown, and it con-
nects the transformer primary windings in parallel.
The 230-volt block is color coded red, and it connects
the primary windings in series.
4.
To change regulating ranges, place the line-selector
block on the desired set of square pins. Select arange which
is centered about the average line voltage to which the
instrument is to be connected (see Table 2-2)
.
Operating Temperature
The 5103N can be operated where the ambient air
temperature is between 0°C and +50°C. The instrument can
be stored in ambient temperature between —40°C and
+70°C. After storage at atemperature beyond the operating
limits, allow the chassis temperature to come within the
operating limits before power is applied.
Athermal cutout in the display module provides thermal
protection and disconnects the power to the instrument if
the internal temperature exceeds asafe operating level. This
device will automatically re-apply power when the tempera-
ture returns to asafe level.
PLUG-IN UNITS
General
The 5103N is designed to accept up to three Tektronix
5-series plug-in units. This plug-in feature allows avariety of
display combinations and also allows selection of band-
width, sensitivity, display mode, etc., to meet the measure-
ment requirements. In addition, it allows the oscilloscope
system to be expanded to meet future measurement
requirements. The overall capabilities of the resultant
system are in large part determined by the characteristics of
the plug-ins selected.
2-2
Operating Instructions—51 03N
Installation
To install aplug-in unit into one of the plug-in compart-
ments, align the slots in the top and bottom of the plug-in
with the associated guides in the plug-in compartment. Push
the plug-in unit firmly into the plug-in compartment until it
locks into place. To remove aplug-in, pull the release latch
on the plug-in unit to disengage it and pull the unitout of
the plug-in compartment. Plug-in units can be removed or
installed without turning off the instrument power. It is not
necessary that all of the plug-in compartments be filled to
operate the instrument; the only plug-ins needed are those
required for the measurement to be made.
When the display unit is calibrated in accordance with
the calibration procedure given in the display unit instruc-
tion manual, the vertical and horizontal gain are standard-
ized. This allows calibrated plug-in units to be changed
from one plug-in compartment to another without re-
calibration. However, the basic calibration of the individual
plug-in units should be checked when they are installed in
this system to verify their measurement accuracy. See the
operating instructions section of the plug-in unit manual for
verification procedure.
Selection
The plug-in versatility of the 5100-series oscilloscope
allows avariety of display modes with many different plug-
ins. The following information is provided here to aid in
plug-in selection.
To produce asingle-trace display, install asingle-channel
vertical unit (or dual-channel unit set for single-channel
operation) in either of the vertical (left or center) compart-
ments and atime-base unit in the horizontal (right) com-
partment. For dual-trace displays, either install adual-
channel vertical unit in one of the vertical compartments or
install asingle-channel vertical unit in each vertical com-
partment. Acombination of asingle-channel and adual-
channel vertical unit allows athree-trace display; likewise, a
combination of two dual-channel vertical units allows a
four-trace display.
To obtain avertical sweep with the input signal
displayed horizontally, insert the time-base unit into one of
the vertical compartments and the amplifier unit in the
horizontal compartment. If avertical sweep is used, there is
no retrace blanking; however, if used in the right vertical
(center) compartment, internal triggering is provided.
For X-Y displays, either a5A-series amplifier unit or a
5B-series time-base unit having an amplifier channel can be
installed in the horizontal compartment to accept the X
signal. The Ysignal is connected to a5A-series amplifier
unit installed in avertical compartment.
Special purpose plug-in units may have specific restric-
tions regarding the compartments in which they can be
installed. This information will be given in the instruction
manuals for these plug-ins.
GENERAL OPERATING INFORMATION
Display Switching Logic
General. The electronic switching for time-shared dis-
plays is produced at the plug-in interface within the main-
frame; however, the switching logic is selected on the plug-
in units. The system allows any combination of plug-ins and
Display switch settings. Refer to the individual plug-in
manuals for specific capabilities and operating procedures.
Vertical Plug-in Compartments. When avertical plug-in
is in the active mode (Display button pushed in), alogic
level is applied to the switching circuit in the mainframe
and adisplay from this plug-in will occur. When two plug-
ins are both active in the vertical compartments, amulti-
trace display will occur (Alternate or Chopped). When no
plug-in is in the active mode, the signal from the left com-
partment will be displayed. Atime-base unit operated in
one of the vertical compartments has apermanent internal
connection to apply alogic level to the switching circuit;
thus, avertical trace produced by this unit will always be
displayed.
Horizontal Plug-in Compartment. Alternate or Chopped
display switching is selected on atime-base unit operated in
the horizontal compartment. When the Display switch is
out (Alt), anegative impulse is supplied at the end of the
sweep to allow alternate switching between plug-ins and
plug-in channels. When the Display switch is pushed in
(Chop), achopped display will appear if amulti-trace dis-
play is required by the plug-ins in the vertical compart-
ments. An amplifier plug-in unit operated in the horizontal
compartment has apermanent internal connection to pro-
vide achopped display if it is required.
Switching Sequence. Four display time slots are pro-
vided on atime-sharing basis. When two vertical plug-ins are
active, each receives two time slots and the switching
sequence is left, left, right, right, etc. The two time slots
allotted to each plug-in are divided between amplifier
channels in adual-trace unit; if two dual-trace plug-ins are
active, then the switching sequence is left Channel 1, left
Channel 2, right Channel 1, right Channel 2, etc. If only
one vertical plug-in is active, it receives all four time slots.
The switching sequence is the same for both the Alternate
and Chopped display modes.
Operating Instructions—5103N
Vertical Display Mode
Display On. To display asignal, the Display button of
the applicable vertical plug-in unit must be pushed in to
activate the unit. If two plug-ins are installed in the vertical
compartments and only the signal from one of the units is
wanted, set the Display switch of the unwanted unit to Off
(button out). If neither plug-in is activated, the signal from
the left unit will be displayed. Both plug-ins can be acti-
vated for multi-trace displays.
Alternate Mode. The alternate position of the time-base
unit Display switch produces adisplay which alternates be-
tween activated plug-ins and amplifier channels with each
sweep of the CRT. The switching sequence is described
under Display Switching Logic in this section. Although the
Alternate mode can be used at all sweep rates, the Chop
mode provides amore satisfactory display at sweep rates
from about one millisecond/division to five seconds/
division. At these slower sweep rates, alternate-mode
switching becomes difficult to view.
Chopped Mode. The Chop position of the time-base
unit Display switch produces adisplay which is
electronically switched between channels at a200-kilohertz
rate. The switching sequence has been discussed earlier. In
general, the Chop mode provides the best display at sweep
rates slower than about one millisecond/division or when-
ever dual-trace, single-shot phenomena are to be displayed.
At faster sweep rates, the chopped switching becomes
apparent and may interfere with the display.
Dual-Sweep Displays. When adual-sweep time-base unit
is operated in the horizontal compartment, the alternate
and chopped time-shared switching for either the Aor B
sweep is identical to that for asingle time-base unit. How-
ever, if both the Aand Bsweeps are operating, the 5103N
operates in the independent pairs mode. Under this condi-
tion, the left vertical unit is always displayed at the sweep
rate of the Atime base and the right vertical unit is dis-
played at the sweep rate of the Btime base (non-delayed
sweep only). This results in two displays that have com-
pletely independent vertical deflection and chopped or
alternate sweep switching.
Dual-Beam Displays. When adual-beam display module
is operated with the 5103N, the switching sequence is
altered slightly. Between-channel switching occurs; how-
ever, switching between plug-ins is not necessary and does
not occur. Also, the left vertical unit is always displayed by
the upper CRT beam and the right vertical unit is displayed
by the lower CRT beam.
X-Y Operation
In some applications, it is desirable to display one signal
versus another (X-Y) rather than against an internal sweep.
The flexibility of the plug-in units available for use with the
5103N provides ameans for applying asignal to the hori-
zontal deflection system for this type of display. Some of
the 5B-series time-base units can be operated as amplifiers
in addition to their normal use as time-base generators, or
an amplifier unit can be installed in the horizontal compart-
ment. The latter method provides the best X-Y display,
particularly if two identical amplifier units are used, since
both the Xand Yinput systems will have the same capa-
bilities and characteristics. In either case, the mainframe
bandwidth and sensitivity are equal and inherent phase shift
is adjustable to 0degrees in the display module. For further
information on obtaining X-Y displays, see the plug-in unit
manuals.
Raster Display
Araster-type display can be used to effectively increase
the apparent sweep length. For this type of display, the
trace is deflected both vertically and horizontally by saw-
tooth signals, and is accomplished by installing a5B-series
time-base unit in one of the vertical compartments as well
as one in the horizontal compartment. Normally, the unit
in the vertical compartment should be set to aslower sweep
rate than the one in the horizontal compartment; the num-
ber of horizontal traces in the raster depends upon the ratio
between the two sweep rates. Information can be displayed
on the raster using the Ext Intensity Input to provide
intensity modulation of the display. This type of raster
display could be used to provide atelevision-type display.
Complete information on operation using the Z-axis feature
is given in the operating instructions section of the display
module manuals.
BASIC OSCILLOSCOPE APPLICATIONS
General
The 5100-Series Oscilloscope and its associated plug-in
units provide avery flexible measurement system. The
capabilities of the overall system depend mainly upon the
plug-ins that are chosen for use with this instrument. The
following information describes the procedures and tech-
niques for making basic measurements. These applications
are not described in detail, since each application must be
adapted to the requirements of the individual measurement.
Specific applications for the individual plug-in units are
described in the manuals for those units. The overall system
can also be used for many applications which are not
described in detail either in this manual or in the manuals
for the individual plug-in units. Contact your local Tek-
tronix Field Office or representative in making specific
measurements with this instrument.
Operating Instructions—5103N
The following books describe oscilloscope measurement
techniques which can be adapted for use with this
instrument.
Harley Carter, "An Introduction to the Cathode Ray
Oscilloscope”, Philips Technical Library, Cleaver-Hume Press
Ltd., London, 1960.
J. Czech, "Oscilloscope Measuring Techniques", Philips
Technical Library, Springer-Verlag, New York, 1965.
Robert G. Middleton, "Scope Waveform Analysis”,
Howard W. Sams &Co. Inc., The Bobbs-Merrill Company
Inc., Indianapolis, 1963.
Robert G. Middleton and L. Donald Payne, "Using the
Oscilloscope in Industrial Electronics", Howard W.Sams&
Co. Inc., The Bobbs-Merrill Company Inc., Indianapolis,
1961.
John F. Rider and Seymour D. Uslan, "Encyclopedia of
Cathode-Ray Oscilloscopes and Their Uses", John F. Rider
Publisher Inc., New York, 1959.
John F. Rider, "Obtaining and Interpreting Test Scope
Traces", John F. Rider Publisher Inc., New York, 1959.
Rufus P. Turner, "Practical Oscilloscope Handbook”,
Volumes 1and 2, John F. Rider Publisher Inc., New York,
1964.
Peak-to-Peak Voltage Measurements—AC
To make peak-to-peak voltage measurements, use the
following procedure:
1.Set the Input Coupling on the vertical plug-in unit to
GND and connect the signal to the input connector.
2. Set the Input Coupling to AC and set the Volts/Div
switch to display about 5or 6vertical divisions of the
waveform. Check that the Variable Volts/Div control (red
knob) is in the Cal position.
3. Adjust the time-base triggering controls for astable
display and set the Seconds/Div switch to display several
cycles of the waveform.
4. Turn the vertical Position control so the lower
portion of the waveform coincides with one of the graticule
lines below the center horizontal line, and the top of the
Position to center
vertical line
Fig. 2-2. Measuring peak-to-peak voltage of awaveform.
waveform is in the viewing area. Move the display with the
horizontal Position control so one of the upper peaks is
aligned with the center vertical reference line (see Fig. 2-2).
5.
Measure the vertical deflection from peak to peak
(divisions)
.
NOTE
This technique may also be used to make measure-
ments between two points on the waveform,rather
than peak to peak.
6.
Multiply the distance (in divisions) measured in step
5by the Volts/Div switch setting. Also include the attenua-
tion factor of the probe, if applicable.
EXAMPLE: Assume apeak-to-peak vertical deflection of
4.6 divisions and aVolts/Div switch setting of 5V.
Peak-to-peak _4.6 5(Volts/Div_ 23
volts (divisions) setting) volts
NOTE
If an attenuator probe not having the capability to
change the scale factor readout (Volts/Div) is used,
multiply the right side of the above equation by the
attenuation factor.
Instantaneous Voltage Measurement—DC
To measure the DC level at agiven point on awaveform,
use the following procedure:
2-5
Operating Instructions—51 03N
rr
f
Vertical
distance
1
I
1———
'
"(A)
——
J
A
Reference line
Fig. 2-3. Measuring instantaneous DC voltage with respect to a
reference voltage.
1.
Set the Input Coupling of the vertical plug-in unit to
GND and position the trace to the bottom line of the grati-
cule (or other selected reference line). If the voltage to be
measured is negative with respect to ground, position the
trace to the top line of the graticule. Do not move the
vertical Position control after this reference has been estab-
lished.
6. Multiply the distance measured in step 4by the
Volts/Div switch setting. Include the attenuation factor of
the probe, if applicable (see the note following the Peak-to-
Peak Voltage Measurement example).
EXAMPLE: Assume that the vertical distance measured
is 4.6 divisions, the polarity is positive, and the Volts/Div
switch setting is 2V.
Instantaneous _4.6 ^2-+9.2
Voltage (divisions) (Volts/Div) volts
Comparison Measurements
In some applications, it may be necessary to establish a
set of deflection factors other than those indicated by the
Volts/Div or Seconds/Div switches. This is useful for com-
paring signals to areference voltage amplitude or period. To
establish anew set of deflection factors based upon a
specific reference amplitude or period, proceed as follows:
VERTICAL DEFLECTION FACTOR
1.
Apply areference signal of known amplitude to the
vertical input connector. Using the Volts/Div switch and
Variable Volts/Div control, adjust the display for an exact
number of divisions. Do not move the Variable Volts/Div
control after obtaining the desired deflection.
NOTE
To measure avoltage level with respect to avoltage
other than ground, make the following changes to
step 1: Set the Input Coupling switch to DC and
apply the reference voltage to the input connector,
then position the trace to the reference line.
2.
Connect the signal to the input connector. Set the
Input Coupling to DC (the ground reference can be checked
at any time by setting the Input Coupling to GND).
3.
Set the Volts/Div switch to display about 5 or 6verti-
cal divisions of the waveform. Check that the Variable
Volts/Div control (red knob) is in the Cal position. Adjust
the time-base triggering controls for astable display.
4.
Measure the distance in divisions between the ref-
erence line and the point on the waveform at which the DC
level is to be measured. For example, in Fig. 2-3 the
measurement is made between the reference line and point
A.
5. Establish the polarity. The voltage is positive if the
signal is applied to the +input connector and the waveform
is above the reference line.
2.
Divide the amplitude of the reference signal (volts)
by the product of the deflection in divisions (established in
step 1) and the Volts/Div switch setting. This is the Deflec-
tion Conversion Factor.
Deflection
Conversion =
Factor
reference signal amplitude (volts)
deflection (divisions XVolts/Div setting
3.
To determine the peak-to-peak amplitude of asignal
compared to areference, disconnect the reference and
apply the signal to the input connector.
4.
Set the Volts/Div switch to asetting that provides
sufficient deflection to make the measurement. Do not
readjust the Variable Volts/Div control.
5.
To establish aModified Deflection Factor at any
setting of the Volts/Div switch, multiply the Volts/Div
switch setting by the Deflection Conversion Factor
established in step 2.
Modified
Deflection
Factor
Volts/Div
setting
Deflection
Conversion
Factor
®
2-6
Operating Instructions—5103N
6. Measure the vertical deflection in divisions and deter-
mine the amplitude by the following formula:
Div switch setting by the Deflection Conversion Factor
established in step 2.
Signal
Amplitude
Modified
Deflection X
Factor
deflection
(divisions)
Modified
Deflection
Factor
Second s/Div
switch setting
Deflection
XConversion
Factor
EXAMPLE: Assume areference signal amplitude of 30
volts, aVolts/Div switch setting of 5Vand adeflection of
four divisions. Substituting these values in the Deflection
Conversion Factor formula (step 2):
30 V
(4) (5 V) 1.5
6. Measure the horizontal deflection in divisions and
determine the period by the following formula:
Modified horizontal
Period =Deflection Xdeflection
Factor (divisions)
Then, with aVolts/Div switch setting of 2V, the Modified
Deflection Factor (step 5) is:
(2 V) (1.5) =3volts/division
To determine the peak-to-peak amplitude of an applied
signal which produces avertical deflection of five divisions
with the above conditions, use the Signal Amplitude
formula (step 6)
:
(3 V) (5) -15 volts
SWEEP RATE
1.
Apply areference signal of known frequency to the
vertical input connector. Using the Seconds/Div switch and
Variable Seconds/Div control, adjust the display so that one
cycle of the signal covers an exact number of horizontal
divisions. Do not change the Variable Seconds/Div control
after obtaining the desired deflection.
2. Divide the period of the reference signal (seconds) by
the product of the horizontal deflection in divisions (estab-
lished in step 1) and the setting of the Seconds/Div switch.
This is the Deflection Conversion Factor.
Deflection reference signal period (seconds)
Conversion =horizontal Seconds/Div
Factor deflection Xswitch
(divisions) setting
3. To determine the period of an unknown signal, dis-
connect the reference and apply the unknown signal.
4. Set the Seconds/Div switch to asetting that provides
sufficient horizontal deflection to make an accurate meas-
urement. Do not readjust the Variable Seconds/Div control.
EXAMPLE: Assume areference signal frequency of 455
hertz (period 2.2 milliseconds), aSeconds/Div switch
setting of .2 ms, and ahorizontal deflection of eight divi-
sions. Substituting these values in the Deflection Conver-
sion Factor formula (step 2):
(8) (0.2 ms)
Then, with aSeconds/Div switch setting of 50 jus, the Modi-
fied Deflection Factor (step 5) is:
(50jus) (1.375) =68.75 microseconds/division
To determine the time period of an applied signal which
completes one cycle in seven horizontal divisions, use the
Period formula (step 6):
(68.75 jus) (7) -481 microseconds
This product can be converted to frequency by taking the
reciprocal of the period (see application on Determining
Frequency).
Time Period Measurement
To measure the time (period) between two points on a
waveform, use the following procedure:
1.
Connect the signal to the vertical input connector,
select either AC or DC input coupling, and set the Volts/
Div switch to display about four divisions of the waveform.
2.
Set the time-base triggering controls to obtain a
stable display. Set the Seconds/Div switch to the fastest
sweep rate that will permit displaying one cycle of the
waveform in less than eight divisions (some non-linearity
may occur in the first and last graticule divisions of dis-
play). Refer to Fig. 2-4.
5.
To establish aModified Deflection Factor at any
setting of the Seconds/Div switch, multiply the Seconds/
3.
Adjust the vertical Position control to move the
points between which the time measurement is made to the
2-7
Operating Instructions—5103N
Fig. 2-4. Measuring time duration (period) between points on a
waveform.
Fig. 2-5. Measuring risetime.
center horizontal line. Adjust the horizontal Position con-
trol to center the time-measurement points within the cen-
ter eight divisions of the graticule.
4. Measure the horizontal distance between the time
measurement points. Be sure the Variable Seconds/Div con-
trol is in the Cal position.
5. Multiply the distance measured in step 4by the
setting of the Seconds/Div switch.
EXAMPLE: Assume that the horizontal distance
between the time-measurement points is five divisions and
the Seconds/Div switch is set to .1 ms.
Using the formula:
p.^horizontal distance ^Seconds/Div
(divisions) switch setting
=(5) (0.1 ms) =0.5 ms
The period is 0.5 millisecond.
Determining Frequency
The time measurement technique can also be used to
determine the frequency of asignal. The frequency of a
periodically recurrent signal is the reciprocal of the time
duration (period) of one cycle. Use the following pro-
cedure:
1. Measure the period of one cycle of the waveform as
described in the previous application.
2. Take the reciprocal of the period to determine the
frequency.
EXAMPLE: The frequency of the signal shown in Fig.
2-4, which has aperiod of 0.5 millisecond, is:
11
Frequency =:—-=—=2kilohertz
period 0.5 ms
Risetime Measurements
Risetime measurements employ basically the same tech-
niques as the time-period measurements. The main differ-
ence is the points between which the measurement is made.
The following procedure gives the basic method of
measuring risetime between the 10% and 90% points of the
waveform.
1.Connect the signal to the input connector.
2. Set the Volts/Div switch and Variable Volts/Div con-
trol to produce adisplay an exact number of divisions in
amplitude.
3. Center the display about the center horizontal line
with the vertical Position control.
4.
Set the time-base triggering controls to obtain a
stable display. Set the Seconds/Div switch to the fastest
sweep rate that will display less than eight divisions be-
tween the 10% and 90% points on the waveform (see Fig.
2-5).
5.
Determine the 10% and 90% points on the rising por-
tion of the waveform. The figures given in Table 2-3 are for
10% up from the start of the rising portion and 10% down
from the top of the rising portion (90% point).
2-8
Operating Instructions—51 03N
TABLE 2-3
Divisions of
display
10% and 90%
points
Divisions vertically
between 10%
and 90% points
40.4 and 3.6 divisions 3.2
50.5 and 4.5 divisions 4.0
60.6 and 5.4 divisions 4.8
70.7 and 6.3 divisions 5.6
80.8 and 7.2 divisions 6.4
6.
Adjust the horizontal Position control to move the
10% point of the waveform to the second vertical line of
the graticule. For example, with asix-division display, the
10% point would be 0.6 division up from the start of the
rising portion.
Fig. 2-6. Measuring time difference between two pulses.
7. Measure the horizontal distance between the 10% and
90% points. Be sure the Variable Seconds/Div control is in
the Cal position.
8. Multiply the distance measured in step 7by the
setting of the Seconds/Div switch.
EXAMPLE: Assume that the horizontal distance be-
tween the 10% and 90% points is six divisions and the
Seconds/Div switch is set to 1jus.
Using the period formula to find risetime:
Risetime _horizontal distance Seconds/Div
period (divisions) setting
=(6) (Ijus) =0.6 microsecond
The risetime is 0.6 microsecond.
Time Difference Measurements
When used in conjunction with acalibrated time-base
plug-in unit, the multi-trace feature of the 5100-series oscil-
loscope permits measurement of time difference between
two or more separate events. To measure time difference,
use the following procedure:
1.
Set the Input Coupling switches of the amplifier
channels to either AC or DC.
2.
Set the Display Mode switch on the time-base unit to
either Chop or Alt. In general, Chop is more suitable for
low-frequency signals and the Alt position is more suitable
for high-frequency signals. More information on deter-
mining the mode is given under Vertical Display Mode in
this section.
3. Set the Triggering Mode switches to trigger the dis-
play on Channel 1(or Left Plug-in).
4. Connect the reference signal to the Channel 1input
connector and the comparison signal to the Channel 2input
connector. The reference signal should precede the com-
parison signal in time. Use coaxial cables or probes which
have similar time-delay characteristics to connect the signal
to the input connectors.
5. If the signals are of opposite polarity, push the Invert
button to invert the Channel 2display. (Signals may be of
opposite polarity due to 180° phase difference; if so, take
this into account in the final calculation.)
6. Set the Volts/Div switches to produce about four
divisions of displayed waveform.
7. Set the time-base triggering controls for astable dis-
play. Set the Seconds/Div switch for asweep rate which
shows three or more divisions between the measurement
points, if possible.
8. Adjust the vertical Position controls to bring the
measurement points to the center horizontal reference line.
9. Adjust the horizontal Position control so the Channel
1waveform (reference) crosses the center horizontal line at
avertical graticule line.
10. Measure the horizontal distance between the two
measurement points (see Fig. 2-6).
2-9
Operating Instructions—51 03N
11.Multiply the measured distance by the setting of the
Seconds/Div switch.
EXAMPLE: Assume that the Seconds/Div switch is set
to 50 jus and the horizontal distance between measurement
points is four divisions.
Using the formula:
_^.Seconds/Div horizontal distance
Time Delay =X
setting (divisions)
=(50 jus) (4) =200 jus.
The time delay is 200 microseconds, i
Multi-Trace Phase Difference Measurement
Phase comparison between two or more signals of the
same frequency can be made using adual-trace plug-in or
two single-trace plug-ins. This method of phase difference
measurement can be used up to the frequency limit of the
vertical system. To make the comparison, use the following
procedure:
1.
Set the Input Coupling switches of the amplifier
channels to either AC or DC.
2.
Set the Display Mode switch on the time-base unit to
either Chop or Alt. In general. Chop is more suitable for
low-frequency signals and the Alt position is more suitable
for high-frequency signals. More information on deter-
mining the mode is given under Vertical Display Mode in
this section.
Fig. 2-7. Measuring phase difference.
7. Set the time-base triggering controls to obtain a
stable display. Set the Seconds/Div switch to asweep rate
which displays about one cycle of the waveform.
8. Move the waveforms to the center of the graticule
with the vertical Position controls.
9.
Turn the Variable Seconds/Div control until one
cycle of the reference signal (Channel 1) occupies exactly
eight divisions between the second and tenth vertical lines
of the graticule (see Fig. 2-7). Each division of the graticule
represents 45° of the cycle (360° +8divisions =45°/
division). The sweep rate can be stated in terms of degrees
as 45°/division.
3.
Set the Triggering Mode switches to trigger the dis-
play on Channel 1(or Left plug-in).
10.
Measure the horizontal difference between corres-
ponding points on the waveforms.
4.
Connect the reference signal to the Channel 1input
connector and the comparison signal to the Channel 2input
connector. The reference signal should precede the com-
parison signal in time. Use coaxial cables or probes which
have similar time-delay characteristics to connect the signals
to the input connectors.
11.
Multiply the measured distance (in divisions) by
45 /division (sweep rate) to obtain the exact amount of
phase difference.
EXAMPLE: Assume ahorizontal difference of 0.6 divi-
sion with asweep rate of 45°/division as shown in Fig. 2-7.
Using the formula:
5. If the signals are of opposite polarity, push the Invert
button to invert the Channel 2display. (Signals may be of
opposite polarity due to 180° phase difference; if so, take
this into account in the final calculation.)
horizontal
Phase Difference= difference X
(divisions)
sweep rate
(degrees/
division)
6. Set the Volts/Div switches and the Variable Volts/Div
controls so the displays are equal and about five divisions in
amplitude.
=(0.6) (45°)
The phase difference is 27°.
27°
2-10
Operating Instructions—5103N
Fig. 2-8. High-resolution phase-difference measurement with in-
creased sweep rate.
High Resolution Phase Measurements
More accurate dual-trace phase measurements can be
made by increasing the sweep rate (without changing the
Variable Seconds/Div control setting). One of the easiest
ways to increase the sweep rate is with the SWP MAG
(10X) button on the time-base unit. The magnified sweep
rate is automatically indicated by the knob-skirt scale-
factor readout.
EXAMPLE: If the sweep rate were increased 10 times
with the magnifier, the magnified sweep rate would be 45°/
division-^ 10= 4.5°/division. Fig. 2-8 shows the same sig-
nals as used in Fig. 2-7, but with the SWP MAG button
pushed in. With ahorizontal difference of six divisions, the
phase difference is:
horizontal magnified
Phase Difference =difference Xsweep rate
(divisions) (degrees/division)
(6) (4.5°) =27°
The phase difference is 27°.
X-Y Phase Measurements
The X-Y phase measurement method can also be used to
measure the phase difference between two signals of the
same frequency. The phase angle is determined from the
Lissajous pattern as outlined in the following steps:
1.
Insert an amplifier plug-in unit into one of the verti-
cal plug-in compartments and an amplifier of the same type
into the horizontal plug-in compartment.
Fig. 2-9. Phase difference measurement from an X-Y display.
2.
Connect asignal to the input connector of each plug-
in and select the desired input coupling.
3.
Position the display to the center of the screen and
adjust the Volts/Div switches to produce adisplay six divi-
sions vertically (Y) and six divisions horizontally (X).
4. Center the display in relation to the center vertical
graticule line. Measure the distances Aand Bas shown in
Fig. 2-9. Distance Bis the vertical measurement between
the two points where the trace crosses the center vertical
line. Distance Ais the maximum vertical amplitude of the
display.
5. Divide Bby Ato obtain the sine of the phase angle
(T>) between the two signals. The angle can then be
obtained from atrigonometric table. If the display appears
as adiagonal straight line, the two signals are either in phase
(tilted upper right to lower left), or 180° out of phase
(tilted upper left to lower right). If the display is acircle,
the signals are 90° out of phase. Fig. 2-10 shows the
Lissajous displays produced between 0° and 360°. Notice
that above 180° phase shift, the resultant display is the
same as at some lower angle.
EXAMPLE: Assume adisplay as shown in Fig. 2-9
where Ais 6divisions and Bis 0.4 division.
Using the formula:
Sine =-7-==0.0660
A6
From the trigonometric tables (or slide rule):
$=arcsin 0.0660 =3.78°
2-11
Fig. 2-10. Phase of aLissajous display. (A) 0° or 360°, (B) 30° or 330°, (C) 90° or 270°, (D) 150° or 210°, and (E) 180°.
2-12

Other Tektronix Test Equipment manuals

Tektronix MTS415 Use and care manual

Tektronix

Tektronix MTS415 Use and care manual

Tektronix A6302 User manual

Tektronix

Tektronix A6302 User manual

Tektronix MSO 4 Series User guide

Tektronix

Tektronix MSO 4 Series User guide

Tektronix TDS3012B User manual

Tektronix

Tektronix TDS3012B User manual

Tektronix TBS2000 Series Setup guide

Tektronix

Tektronix TBS2000 Series Setup guide

Tektronix 543B User manual

Tektronix

Tektronix 543B User manual

Tektronix 455 User manual

Tektronix

Tektronix 455 User manual

Tektronix TPS2000 Series User manual

Tektronix

Tektronix TPS2000 Series User manual

Tektronix 067-0883-99 User manual

Tektronix

Tektronix 067-0883-99 User manual

Tektronix MSO4104B User manual

Tektronix

Tektronix MSO4104B User manual

Tektronix TBS2000B Series User manual

Tektronix

Tektronix TBS2000B Series User manual

Tektronix 3S3 User manual

Tektronix

Tektronix 3S3 User manual

Tektronix MSO44B Instruction manual

Tektronix

Tektronix MSO44B Instruction manual

Tektronix 2445B User manual

Tektronix

Tektronix 2445B User manual

Tektronix MDO3000 Series User manual

Tektronix

Tektronix MDO3000 Series User manual

Tektronix DF2 User manual

Tektronix

Tektronix DF2 User manual

Tektronix TDS6000 Series User manual

Tektronix

Tektronix TDS6000 Series User manual

Tektronix 516 series User manual

Tektronix

Tektronix 516 series User manual

Tektronix 5B12N User manual

Tektronix

Tektronix 5B12N User manual

Tektronix 475 User manual

Tektronix

Tektronix 475 User manual

Tektronix MTS4000 MPEG Manual

Tektronix

Tektronix MTS4000 MPEG Manual

Tektronix MDO3000 Series User manual

Tektronix

Tektronix MDO3000 Series User manual

Tektronix BERTScope Manual

Tektronix

Tektronix BERTScope Manual

Tektronix 465M User manual

Tektronix

Tektronix 465M User manual

Popular Test Equipment manuals by other brands

Polaris Easy Cast instruction manual

Polaris

Polaris Easy Cast instruction manual

ARM Musca-B1 Technical overview

ARM

ARM Musca-B1 Technical overview

Desco 19493 Operation and maintenance

Desco

Desco 19493 Operation and maintenance

Agilent Technologies ProBER 2 User's reference manual

Agilent Technologies

Agilent Technologies ProBER 2 User's reference manual

Kewtech KT72 user manual

Kewtech

Kewtech KT72 user manual

AEMC SR751 user manual

AEMC

AEMC SR751 user manual

Gamry Instruments Universal Dummy Cell 3 Operator's manual

Gamry Instruments

Gamry Instruments Universal Dummy Cell 3 Operator's manual

Tescom TC-5062C operating manual

Tescom

Tescom TC-5062C operating manual

Bartec TECHRITEPRO TPMS quick start guide

Bartec

Bartec TECHRITEPRO TPMS quick start guide

ARROWELD ARW-HMR instruction manual

ARROWELD

ARROWELD ARW-HMR instruction manual

Avdel FKT 12V instruction manual

Avdel

Avdel FKT 12V instruction manual

AlcoSense Elite2 user manual

AlcoSense

AlcoSense Elite2 user manual

Telequipment D83 user manual

Telequipment

Telequipment D83 user manual

Thermo Scientific HAAKE Viscotester iQ instruction manual

Thermo Scientific

Thermo Scientific HAAKE Viscotester iQ instruction manual

Time Electronics 1040 user manual

Time Electronics

Time Electronics 1040 user manual

brennenstuhl Multi-Test MT 6 S/2 Directions for use

brennenstuhl

brennenstuhl Multi-Test MT 6 S/2 Directions for use

Mecmesin MultiTest 0.5-dV Service and repair manual

Mecmesin

Mecmesin MultiTest 0.5-dV Service and repair manual

Measumax 34-219 operating instructions

Measumax

Measumax 34-219 operating instructions

manuals.online logo
manuals.online logoBrands
  • About & Mission
  • Contact us
  • Privacy Policy
  • Terms and Conditions

Copyright 2025 Manuals.Online. All Rights Reserved.