User’s Guide
Water Flow Meter
ABSTRACT
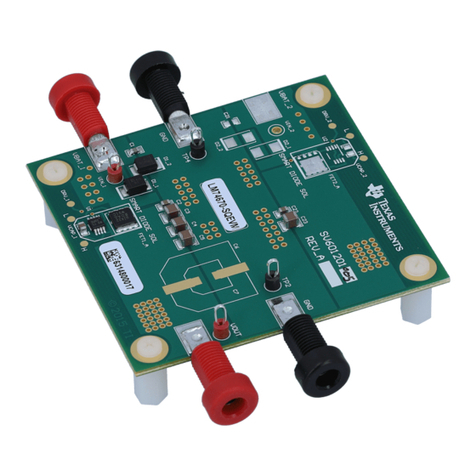
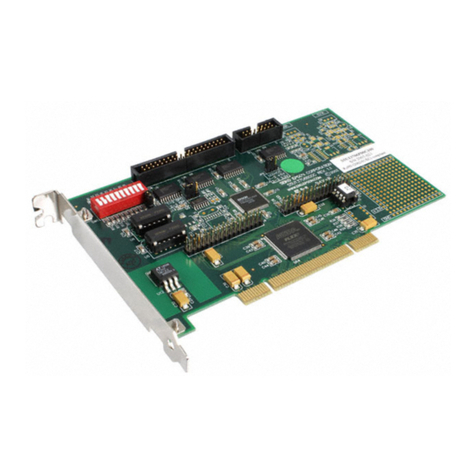
This getting started guide reviews the contents of the MSP430FR6047 ultrasonic sensing evaluation module and
tells you how to quickly get started with the MSP430FR6047 device for a water flow meter solution. The
information in this guide also applies to the MSP430FR600x and MSP430FR6043 ultrasonic sensing evaluation
module when used in the water metering configuration. For more information on the EVM430-FR6043 in water
metering configuration, see the Optimized ultrasonic sensing metrology reference design for water flow
measurement.
Table of Contents
1 Introduction.............................................................................................................................................................................2
1.1 Package Contents..............................................................................................................................................................2
1.2 What is Not Included.......................................................................................................................................................... 2
1.3 System Requirement..........................................................................................................................................................2
1.4 MSP430FR600x Evaluation............................................................................................................................................... 2
2 Connect the EVM to the Flow Meter......................................................................................................................................3
3 Flashing the EVM and Installing the GUI..............................................................................................................................4
4 USS GUI................................................................................................................................................................................... 5
4.1 Connecting to the Platform.................................................................................................................................................5
4.2 Configuration Parameters.................................................................................................................................................. 6
4.3 Capturing the ADC Signals...............................................................................................................................................11
4.4 Capturing Waveforms.......................................................................................................................................................14
4.5 Frequency Response....................................................................................................................................................... 15
5 Meter Characterization......................................................................................................................................................... 16
5.1 Single Shot Standard Deviation....................................................................................................................................... 16
5.2 Zero Flow Drift Testing..................................................................................................................................................... 16
5.3 Flow Testing..................................................................................................................................................................... 17
6 Revision History................................................................................................................................................................... 18
List of Figures
Figure 2-1. EVM430-FR6047 Connected to Flow Meter............................................................................................................. 3
Figure 2-2. EVM430-FR6047 Jumper Settings............................................................................................................................3
Figure 3-1. Select MSP430FR6047 Device.................................................................................................................................4
Figure 3-2. Load Image............................................................................................................................................................... 4
Figure 4-1. USS GUI Connected to EVM.................................................................................................................................... 5
Figure 4-2. Parameters Tab......................................................................................................................................................... 6
Figure 4-3. Configuration Timing Diagram...................................................................................................................................7
Figure 4-4. Advanced Parameters Tab........................................................................................................................................ 8
Figure 4-5. Representative Captured Waveform With Interpolation............................................................................................ 9
Figure 4-6. Captured ADC Signal.............................................................................................................................................. 11
Figure 4-7. Gap Between Pulse Start and ADC Capture Set Too Long.................................................................................... 12
Figure 4-8. Gap Between Pulse Start and ADC Capture Set Too Short....................................................................................12
Figure 4-9. Captured ADC Signal With No Water or Bad Connection....................................................................................... 13
Figure 4-10. Capturing Waveforms............................................................................................................................................14
Figure 4-11. Frequency Sweep Peak Amplitudes......................................................................................................................15
Figure 5-1. Single Shot Standard Deviation.............................................................................................................................. 16
Figure 5-2. Flow Test Setup.......................................................................................................................................................17
www.ti.com Table of Contents
SLAU810B – SEPTEMBER 2019 – REVISED SEPTEMBER 2020
Submit Document Feedback
Water Flow Meter 1
Copyright © 2020 Texas Instruments Incorporated
